
UNITED STATES
SECURITIES AND EXCHANGE COMMISSION
Washington, D.C. 20549
SCHEDULE 13E-3
(Rule 13e-3 Transaction Statement under Section 13(e) of the Securities Exchange Act of 1934)
PRIORITY TECHNOLOGY HOLDINGS, INC.
(Name of the Issuer)
Priority Technology Holdings, Inc.
WD Capital Partners Parent Inc.
WD Capital Partners Merger Sub Inc.
WD Capital Partners Holdings LP
WD Capital Partners Holdings GP LLC
Thomas C. Priore
The Thomas Priore 2019 GRAT
The Thomas C. Priore Irrevocable Insurance Trust u/a/d 1/8/2010
John V. Priore
AESV CreditCard Consulting, LLC
(Names of Persons Filing Statement)
Common Stock, par value $0.001 per share
(Title of Class of Securities)
74275G107
(CUSIP Number)
Bradley J. Miller General Counsel, Chief Risk Officer and Corporate Secretary Priority Technology Holdings, Inc. 2001 Westside Parkway, Suite 155 Alpharetta, GA 30004 (800) 935-5961 |
Thomas C. Priore WD Capital Partners Parent Inc. 2001 Westside Parkway, Suite 155 Alpharetta, GA 30004 (800) 935-5961 |
with copies to:
Jeffrey D. Marell Cullen L. Sinclair Paul, Weiss, Rifkind, Wharton & Garrison LLP 1285 Avenue of the Americas New York, NY 10019 (212) 373-3000 |
Richard F. Langan, Jr. Conrad R. Adkins Nixon Peabody LLP 55 West 46th Street New York, NY 10036 (212) 940-3140 |
Benjamin Kozinn, Lauren Troeller, Eric Orsic McDermott Will & Schulte LLP One Vanderbilt Avenue New York, NY 10017 (212) 547-5400 |
(Name,
Address and Telephone Number of Person Authorized to Receive
Notices and Communications on Behalf of the Persons Filing Statement)
This statement is filed in connection with (check the appropriate box):
| ☒ | a. | The filing of solicitation materials or an information statement subject to Regulation 14A, Regulation 14C or Rule 13e-3(c) under the Securities Exchange Act of 1934. | |
| ☐ | b. | The filing of a registration statement under the Securities Act of 1933. | |
| ☐ | c. | A tender offer. | |
| ☐ | d. | None of the above. |
Check the following box if the soliciting materials or information statement referred to in checking box (a) are preliminary copies: ☒
Check the following box if this is a final amendment reporting the results of the transaction: ☐
NEITHER THE SECURITIES AND EXCHANGE COMMISSION NOR ANY STATE SECURITIES COMMISSION HAS APPROVED OR DISAPPROVED OF THIS TRANSACTION, PASSED UPON THE MERITS OR FAIRNESS OF THIS TRANSACTION, OR PASSED UPON THE ADEQUACY OR ACCURACY OF THE DISCLOSURE IN THIS TRANSACTION STATEMENT ON SCHEDULE 13E-3. ANY REPRESENTATION TO THE CONTRARY IS A CRIMINAL OFFENSE.
INTRODUCTION
This Rule 13e-3 Transaction Statement on Schedule 13E-3 (together with the exhibits hereto, this “Transaction Statement”) is being filed with the Securities and Exchange Commission (the “SEC”) pursuant to Section 13(e) of the Securities Exchange Act of 1934, as amended (the “Exchange Act”), jointly by the following persons (each, a “Filing Person” and collectively, the “Filing Persons”): (i) Priority Technology Holdings, Inc., a Delaware corporation (the “Company” or “Priority”), the issuer of the common stock, par value $0.001 per share (the “Shares”), that is the subject of the Rule 13e-3 transaction; (ii) WD Capital Partners Parent Inc., a Delaware corporation (“Parent”); (iii) WD Capital Partners Merger Sub Inc., a Delaware corporation and a direct, wholly owned subsidiary of Parent (“Merger Sub”); (iv) WD Capital Partners Holdings LP, a Delaware limited partnership (“Ultimate Parent”); (v) WD Capital Partners Holdings GP LLC, a Delaware limited liability company and the general partner of Ultimate Parent (“Ultimate Parent GP”); (vi) Thomas C. Priore (the “Majority Stockholder”); (vii) the Thomas Priore 2019 GRAT; (viii) the Thomas C. Priore Irrevocable Insurance Trust u/a/d 1/8/2010; (ix) John V. Priore; and (x) AESV CreditCard Consulting, LLC.
On September 18, 2026, the Company entered into an Agreement and Plan of Merger (as it may be amended from time to time, the “Merger Agreement”) by and among the Company, Parent and Merger Sub, pursuant to which Merger Sub will merge with and into the Company (the “Merger”), with the Company surviving the Merger as a wholly owned subsidiary of Parent. If the Merger is completed, each Share issued and outstanding immediately prior to the effective time of the Merger (other than the Excluded Shares) will be converted into the right to receive $8.05 per Share in cash, without interest and less any applicable withholding taxes.
Concurrently with the filing of this Transaction Statement, the Company is filing with the SEC a preliminary proxy statement (together with any amendments or supplements thereto, the “Proxy Statement”) under Regulation 14A relating to the special meeting of the Company’s stockholders at which the Company’s stockholders will consider and vote on, among other things, a proposal to adopt the Merger Agreement. A copy of the Proxy Statement is attached hereto as Exhibit (a)(1). The adoption of the Merger Agreement requires the affirmative vote of (i) the holders of a majority of the outstanding Shares entitled to vote thereon, voting as a single class, and (ii) the holders of a majority of the votes cast by the Unaffiliated Company Stockholders at the Special Meeting.
Pursuant to General Instruction F to Schedule 13E-3, the information contained in the Proxy Statement, including all annexes thereto, is incorporated herein by reference in its entirety, and the responses to each item in this Transaction Statement are qualified in their entirety by reference to the information contained in the Proxy Statement and the annexes thereto. As of the date hereof, the Proxy Statement is in preliminary form and is subject to completion or amendment. Capitalized terms used but not defined in this Transaction Statement have the meanings given to them in the Proxy Statement.
All information contained in this Transaction Statement concerning any Filing Person has been supplied by such Filing Person, and no Filing Person, including the Company, is responsible for the accuracy of any information supplied by any other Filing Person.
The filing of this Transaction Statement shall not be construed as an admission by any Filing Person, or by any affiliate of any Filing Person, that the Company is “controlled” by any other Filing Person, or that any Filing Person is an “affiliate” of the Company within the meaning of Rule 13e-3 under Section 13(e) of the Exchange Act.
Item 1. Summary Term Sheet
The information set forth in the Proxy Statement under the caption “Summary Term Sheet” and “Questions and Answers About the Proposals and the Special Meeting” is incorporated herein by reference.
Item 2. Subject Company Information
(a) Name and Address. The information set forth in the Proxy Statement under the caption “Parties to the Merger — The Company” and “Where You Can Find Additional Information” is incorporated herein by reference.
(b) Securities. The information set forth in the Proxy Statement under the following captions is incorporated herein by reference: “The Special Meeting — Record Date and Quorum”, “The Special Meeting — Vote Required,” “The Special Meeting — Voting,” and “Other Important Information Regarding the Company — Security Ownership of Certain Beneficial Owners and Management.”
1
(c) Trading Market and Price. The information set forth in the Proxy Statement under the caption “Other Important Information Regarding the Company — Market Price of Shares and Dividends” is incorporated herein by reference.
(d) Dividends. The information set forth in the Proxy Statement under the caption “Other Important Information Regarding the Company — Market Price of Shares and Dividends” is incorporated herein by reference.
(e) Prior Public Offerings. The information set forth in the Proxy Statement under the caption “Other Important Information Regarding the Company — Prior Public Offerings” is incorporated herein by reference.
(f) Prior Stock Purchases. The information set forth in the Proxy Statement under the following captions is incorporated herein by reference: “Other Important Information Regarding the Company — Certain Transactions in the Shares.”
Item 3. Identity and Background of Filing Person
(a)–(c) Name and Address; Business and Background of Entities; Business and Background of Natural Persons. The information set forth in the Proxy Statement under the following captions is incorporated herein by reference: “Parties to the Merger,” “Other Important Information Regarding the Company — Directors and Executive Officers of the Company,” “Other Important Information Regarding the Purchaser Filing Parties.”
Item 4. Terms of the Transaction
(a)(2) Material Terms – Mergers or Similar Transactions. The information set forth in the Proxy Statement under the following captions is incorporated herein by reference: “Summary Term Sheet,” “Questions and Answers About the Proposals and the Special Meeting,” “Special Factors,” “The Merger (The Merger Agreement Proposal — Proposal 1),” “Special Factors — Certain Effects of the Merger; Treatment of the Shares,” “Special Factors — Interests of the Company’s Directors and Executive Officers in the Merger,” “Special Factors — Material U.S. Federal Income Tax Consequences of the Merger,” “Special Factors — Financing of the Merger,” “Special Factors — Support Agreement,” “Special Factors — Limited Guaranty,” “The Special Meeting — Vote Required,” “Effects of the Merger on Stockholder Rights,” “Merger-Related Executive Compensation Arrangements (The Golden Parachute Proposal — Proposal 2),” “Adjournment of the Special Meeting (The Adjournment Proposal — Proposal 3),” “Provisions for Unaffiliated Stockholders,” and “The Merger Agreement.”
(c) Different Terms. The information set forth in the Proxy Statement under the following captions is incorporated herein by reference: “Special Factors — Certain Effects of the Merger; Treatment of the Shares,” “Special Factors — Interests of the Company’s Directors and Executive Officers in the Merger,” “Special Factors — Support Agreement,” “Special Factors — Plans for the Company After the Merger,” “Special Factors — Financing of the Merger,” “Special Factors —Limited Guaranty,” “Special Factors — Intent of the Supporting Stockholders to Vote in Favor of the Merger and Adoption of the Merger Agreement,” “The Special Meeting — Vote Required,” “The Merger Agreement — The Merger Consideration,” “The Merger Agreement — Treatment of Equity Compensation Awards” and “Effects of the Merger on Stockholder Rights.”
(d) Appraisal Rights. The information set forth in the Proxy Statement under the following captions is incorporated herein by reference: “The Special Meeting — Appraisal Rights,” “The Merger (The Merger Agreement Proposal — Proposal 1) — Appraisal Rights,” “Questions and Answers About the Proposals and the Special Meeting,” “Special Factors — Appraisal Rights,” “Effects of the Merger on Stockholder Rights” and Annex E (Section 262 of the Delaware General Corporation Law).
(e) Provisions for Unaffiliated Security Holders. The information set forth in the Proxy Statement under the caption “Provisions for Unaffiliated Stockholders” is incorporated herein by reference.
(f) Eligibility for Listing or Trading. Not applicable.
2
Item 5. Past Contacts, Transactions, Negotiations and Agreements
Regulation M-A Item 1005.
(a) –(b) Transactions; Significant Corporate Events. The information set forth in the Proxy Statement under the following captions is incorporated herein by reference: “Special Factors — Background of the Merger,” “Special Factors — Reasons for the Merger; Recommendation of the Board and the Special Committee,” “Special Factors — Financing of the Merger,” “Special Factors — Interests of the Company’s Directors and Executive Officers in the Merger,” “Special Factors — Support Agreement,” “Other Important Information Regarding the Company — Certain Transactions in the Shares,” and “The Merger Agreement.”
(c) Negotiations or Contacts. The information set forth in the Proxy Statement under the following captions is incorporated herein by reference: “Special Factors — Background of the Merger,” “Special Factors — Reasons for the Merger; Recommendation of the Board and the Special Committee,” “Special Factors — Support Agreement,” “Special Factors — Financing of the Merger,” “Special Factors — Limited Guaranty,” and “The Merger Agreement.”
(e) Agreements Involving the Subject Company’s Securities. The information set forth in the Proxy Statement under the following captions is incorporated herein by reference: “Special Factors — Financing of the Merger,” “Special Factors — Support Agreement,” “Special Factors — Limited Guaranty,” “Special Factors — Interests of the Company’s Directors and Executive Officers in the Merger,” “Special Factors — Certain Effects of the Merger; Treatment of the Shares,” “The Merger Agreement — Treatment of Equity Compensation Awards,” “Other Important Information Regarding the Company — Certain Transactions in the Shares,” “The Merger Agreement,” and “The Special Meeting — Vote Required.” In addition, concurrently with the execution of the Merger Agreement, Ultimate Parent, Parent, Merger Sub, the Majority Stockholder and Searchlight IV SAT, L.P., an affiliate of the Equity Financing Source, entered into an Interim Investors Agreement in order to establish certain terms and conditions that will govern the relationship among the parties thereto with respect to the Merger Agreement, the Equity Commitment Letter and the other agreements related thereto and the transactions contemplated thereby. The Interim Investors Agreement is incorporated by reference as Exhibit (d)(4) hereto.
Item 6. Purposes of the Transaction and Plans or Proposals
(b) Use of Securities Acquired. The information set forth in the Proxy Statement under the following captions is incorporated herein by reference: “Special Factors — Certain Effects of the Merger; Treatment of the Shares,” “Special Factors — Certain Effects on the Company if the Merger is Not Completed,” “Effects of the Merger on Stockholder Rights,” and “The Merger Agreement — The Merger Consideration.”
(c) (1)–(8) Plans. The information set forth in the Proxy Statement under the following captions is incorporated herein by reference: “Summary Term Sheet,” “Special Factors — Plans for the Company After the Merger,” “Special Factors — Certain Effects of the Merger; Treatment of the Shares,” “Special Factors — Financing of the Merger,” “Special Factors — Delisting of the Company’s Common Stock,” “Special Factors — No Public Market After the Merger,” “Special Factors — Reasons for the Merger; Recommendation of the Board and the Special Committee,” “Special Factors — Support Agreement,” “Special Factors — Interests of the Company’s Directors and Executive Officers in the Merger,” “Questions and Answers About the Proposals and the Special Meeting,” “Effects of the Merger on Stockholder Rights,” “The Merger Agreement,” “The Merger Agreement — Organizational Documents, Directors and Officers of the Surviving Corporation,” “Other Important Information Regarding the Company — Description of Company Debt,” “Delisting and Deregistration of Common Stock” and Annex B (Certificate of Incorporation of the Surviving Corporation).
Item 7. Purposes, Alternatives, Reasons and Effects
(a) Purposes. The information set forth in the Proxy Statement under the following captions is incorporated herein by reference: “Special Factors — Background of the Merger,” “Special Factors — Reasons for the Merger; Recommendation of the Board and the Special Committee,” “Special Factors — Position of the Purchaser Filing Parties as to the Fairness of the Merger,” and “Special Factors — Purpose and Reasons of the Purchaser Filing Parties for the Merger.”
3
(b) Alternatives. The information set forth in the Proxy Statement under the following captions is incorporated herein by reference: “Special Factors — Background of the Merger,” “Special Factors — Reasons for the Merger; Recommendation of the Board and the Special Committee,” “Special Factors — Certain Unaudited Prospective Financial Information” and “Special Factors — Certain Effects on the Company if the Merger is Not Completed.”
(c) Reasons. The information set forth in the Proxy Statement under the following captions is incorporated herein by reference: “Special Factors — Reasons for the Merger; Recommendation of the Board and the Special Committee,” “Special Factors — Certain Unaudited Prospective Financial Information,” “Special Factors — Position of the Purchaser Filing Parties as to the Fairness of the Merger,” and “Special Factors — Purpose and Reasons of the Purchaser Filing Parties for the Merger.”
(d) Effects. The information set forth in the Proxy Statement under the following captions is incorporated herein by reference: “Special Factors — Certain Effects of the Merger; Treatment of the Shares,” “Special Factors — Certain Effects on the Company if the Merger is Not Completed,” “Special Factors — Interests of the Company’s Directors and Executive Officers in the Merger,” “Special Factors — Material U.S. Federal Income Tax Consequences of the Merger,” “Special Factors — Delisting of the Company’s Common Stock,” “Special Factors — No Public Market After the Merger,” “Special Factors — Plans for the Company After the Merger,” “Special Factors — Financing of the Merger,” “Special Factors — Support Agreement,” “Special Factors — Limited Guaranty,” “Special Factors — Accounting Treatment,” “Special Factors — Regulatory Approvals,” “Special Factors — Fees and Expenses,” “Risk Factors,” “Provisions for Unaffiliated Stockholders,” “Merger-Related Executive Compensation Arrangements (The Golden Parachute Proposal — Proposal 2),” “Delisting and Deregistration of Common Stock,” “Effects of the Merger on Stockholder Rights,” and “The Merger Agreement.”
Item 8. Fairness of the Transaction
(a)–(b) Fairness; Factors Considered in Determining Fairness. The information set forth in the Proxy Statement under the following captions is incorporated herein by reference: “Special Factors — Background of the Merger,” “Special Factors — Reasons for the Merger; Recommendation of the Board and the Special Committee,” “Special Factors — Opinion of Barclays Capital Inc.,” “Special Factors — Certain Unaudited Prospective Financial Information,” “Special Factors — Position of the Purchaser Filing Parties as to the Fairness of the Merger,” “Special Factors — Purpose and Reasons of the Purchaser Filing Parties for the Merger,” “Special Factors — Interests of the Company’s Directors and Executive Officers in the Merger,” “Special Factors — Certain Effects of the Merger; Treatment of the Shares,” “Questions and Answers About the Proposals and the Special Meeting,” “The Special Meeting — Vote Required,” and “Provisions for Unaffiliated Stockholders.”
(c) Approval of Security Holders. The information set forth in the Proxy Statement under the following captions is incorporated herein by reference: “Summary Term Sheet,” “Questions and Answers About the Proposals and the Special Meeting,” “The Special Meeting — Record Date and Quorum,” “The Special Meeting — Vote Required,” and “Provisions for Unaffiliated Stockholders.” The transaction is structured to require approval of the holders of a majority of the votes cast by the Unaffiliated Company Stockholders.
(d) Unaffiliated Representative. The information set forth in the Proxy Statement under the following captions is incorporated herein by reference: “Special Factors — Background of the Merger,” “Special Factors — Reasons for the Merger; Recommendation of the Board and the Special Committee,” and “Provisions for Unaffiliated Stockholders.”
(e) Approval of Directors. The information set forth in the Proxy Statement under the following captions is incorporated herein by reference: “Special Factors — Background of the Merger” and “Special Factors — Reasons for the Merger; Recommendation of the Board and the Special Committee,” and “Provisions for Unaffiliated Stockholders.” The Board (other than Mr. Priore and Mr. Crisafulli, who each recused himself) approved the Merger Agreement.
(f) Other Offers. The information set forth in the Proxy Statement under the following captions is incorporated herein by reference: “Special Factors — Background of the Merger” and “Special Factors — Reasons for the Merger; Recommendation of the Board and the Special Committee.”
4
Item 9. Reports, Opinions, Appraisals and Negotiations
(a)–(b) Report, Opinion or Appraisal; Preparer and Summary. The information set forth in the Proxy Statement under the following captions is incorporated herein by reference: “Special Factors — Background of the Merger,” “Special Factors — Reasons for the Merger; Recommendation of the Board and the Special Committee,” “Special Factors — Opinion of Barclays Capital Inc.,” “Special Factors — Certain Other Presentations by Barclays,” “Special Factors — Position of the Purchaser Filing Parties as to the Fairness of the Merger,” “Special Factors — Purpose and Reasons of the Purchaser Filing Parties for the Merger,” and “Special Factors — Certain Unaudited Prospective Financial Information.” The full text of the written opinion of Barclays is attached to the Proxy Statement as Annex C.
(c) Availability of Documents. The reports, opinions or appraisals referenced in this Item 9 will be made available for inspection and copying at the principal executive offices of the Company during its regular business hours by any interested holder of Shares or representative who has been so designated in writing. The information set forth in the Proxy Statement under the caption “Where You Can Find Additional Information” is incorporated herein by reference.
Item 10. Source and Amounts of Funds or Other Consideration
(a)–(b), (d) Source of Funds; Conditions; Borrowed Funds. The information set forth in the Proxy Statement under the following captions is incorporated herein by reference: “Summary Term Sheet,” “Special Factors — Financing of the Merger,” “Special Factors — Limited Guaranty,” “The Merger Agreement — Parent Financing,” “The Merger Agreement — Conditions to the Completion of the Merger,” “The Merger Agreement — Termination Fees,” and “Other Important Information Regarding the Company — Description of Company Debt.”
(c) Expenses. The information set forth in the Proxy Statement under the following captions is incorporated herein by reference: “Special Factors — Fees and Expenses” and “The Special Meeting — Solicitation of Proxies; Payment of Solicitation Expenses.”
Item 11. Interest in Securities of the Subject Company
(a) Securities Ownership. The information set forth in the Proxy Statement under the following captions is incorporated herein by reference: “Other Important Information Regarding the Company — Security Ownership of Certain Beneficial Owners and Management,” “Special Factors — Interests of the Company’s Directors and Executive Officers in the Merger,” “Special Factors — Support Agreement,” “Special Factors — Intent of the Company’s Directors and Executive Officers to Vote in Favor of the Merger and Adoption of the Merger Agreement,” “Special Factors — Intent of the Supporting Stockholders to Vote in Favor of the Merger and Adoption of the Merger Agreement,” “The Special Meeting — Vote Required” and “The Special Meeting — Voting Intentions of the Company’s Directors and Executive Officers.”
(b) Securities Transactions. The information set forth in the Proxy Statement under the following captions is incorporated herein by reference: “Other Important Information Regarding the Company — Certain Transactions in the Shares” and “Special Factors — Interests of the Company’s Directors and Executive Officers in the Merger.”
Item 12. The Solicitation or Recommendation
(d) Intent to Tender or Vote in a Going-Private Transaction. The information set forth in the Proxy Statement under the following captions is incorporated herein by reference: “Summary Term Sheet,” “Special Factors — Intent of the Company’s Directors and Executive Officers to Vote in Favor of the Merger and Adoption of the Merger Agreement,” “Special Factors — Intent of the Supporting Stockholders to Vote in Favor of the Merger and Adoption of the Merger Agreement,” “Special Factors — Support Agreement,” “The Special Meeting — Vote Required” and “The Special Meeting — Voting Intentions of the Company’s Directors and Executive Officers.”
(e) Recommendations of Others. The information set forth in the Proxy Statement under the following captions is incorporated herein by reference: “Special Factors — Reasons for the Merger; Recommendation of the Board and the Special Committee,” “The Special Meeting — Recommendation of the Board,” “The Merger (The Merger Agreement Proposal — Proposal 1) — Vote Recommendation,” “Merger-Related Executive Compensation Arrangements (The Golden Parachute Proposal — Proposal 2) — Vote Recommendation,” “Adjournment of the Special Meeting (The Adjournment Proposal — Proposal 3) — Vote Recommendation,” “Special Factors — Position of the Purchaser Filing Parties as to the Fairness of the Merger,” and “Special Factors — Purpose and Reasons of the Purchaser Filing Parties for the Merger.”
5
Item 13. Financial Statements
(a) Financial Information. The information set forth in the Proxy Statement under the following captions is incorporated herein by reference: “Other Important Information Regarding the Company — Selected Historical Consolidated Financial Data,” “Other Important Information Regarding the Company — Book Value per Share,” “Other Important Information Regarding the Company — Description of Company Debt,” and “Where You Can Find Additional Information.” The audited consolidated financial statements of the Company for the fiscal years ended December 31, 2025 and December 31, 2024 are incorporated by reference into the Proxy Statement from the Company’s Annual Report on Form 10-K for the fiscal year ended December 31, 2025, and the unaudited condensed consolidated financial statements for the quarterly period ended June 30, 2026 are incorporated by reference from the Company’s Quarterly Report on Form 10-Q for such period.
(b) Pro Forma Information. Not applicable.
Item 14. Persons/Assets, Retained, Employed, Compensated or Used
(a) –(b) Solicitations or Recommendations; Employees and Corporate Assets. The information set forth in the Proxy Statement under the following captions is incorporated herein by reference: “Special Factors — Background of the Merger,” “Special Factors — Reasons for the Merger; Recommendation of the Board and the Special Committee,” “The Special Meeting — Solicitation of Proxies; Payment of Solicitation Expenses,” “The Special Meeting — Questions and Additional Information,” and “Special Factors — Fees and Expenses.”
Item 15. Additional Information
(b) Golden Parachute Compensation. The information set forth in the Proxy Statement under the following captions is incorporated herein by reference: “Special Factors — Interests of the Company’s Directors and Executive Officers in the Merger” and “Merger-Related Executive Compensation Arrangements (The Golden Parachute Proposal — Proposal 2).”
(c) Other Material Information. The information set forth in the Proxy Statement, including all annexes thereto, is incorporated herein by reference, including the information under the captions “Cautionary Statement Regarding Forward-Looking Statements,” “Risk Factors,” “Special Factors — Regulatory Approvals” and “Special Factors — Litigation Relating to the Merger.”
Item 16. Exhibits
6
| * | Schedules and exhibits have been omitted pursuant to Item 601(a)(5) of Regulation S-K. The Company hereby agrees to furnish supplementally a copy of any omitted schedule or exhibit to the SEC upon request. |
7
SIGNATURES
After due inquiry and to the best of my knowledge and belief, I certify that the information set forth in this statement is true, complete and correct.
Dated: October 30, 2026
| PRIORITY TECHNOLOGY HOLDINGS, INC. | |||
| By: | /s/ Timothy M. O’Leary | ||
| Name: | Timothy M. O’Leary | ||
| Title: | Chief Financial Officer | ||
| WD CAPITAL PARTNERS PARENT INC. | |||
| By: | /s/ Thomas C. Priore | ||
| Name: | Thomas C. Priore | ||
| Title: | President and Secretary | ||
| WD CAPITAL PARTNERS MERGER SUB INC. | |||
| By: | /s/ Thomas C. Priore | ||
| Name: | Thomas C. Priore | ||
| Title: | President and Secretary | ||
| WD CAPITAL PARTNERS HOLDINGS LP | |||
| By: WD Capital Partners Holdings GP LLC, its general partner | |||
| By: | /s/ Thomas C. Priore | ||
| Name: | Thomas C. Priore | ||
| Title: | President and Secretary | ||
| WD CAPITAL PARTNERS HOLDINGS GP LLC | |||
| By: | /s/ Thomas C. Priore | ||
| Name: | Thomas C. Priore | ||
| Title: | President and Secretary | ||
| THOMAS C. PRIORE | |||
| /s/ Thomas C. Priore | |||
| Thomas C. Priore | |||
8
| THE THOMAS PRIORE 2019 GRAT | ||
| /s/ Lori A. Priore | ||
| Name: | Lori A. Priore | |
| Title: | Trustee | |
THE THOMAS C. PRIORE IRREVOCABLE INSURANCE TRUST U/A/D 1/8/2010 | ||
| /s/ Lori A. Priore | ||
| Name: | Lori A. Priore | |
| Title: | Trustee | |
| /s/ Bertrand H. Smyers | ||
| Name: | Bertrand H. Smyers | |
| Title: | Trustee | |
| JOHN V. PRIORE | ||
| /s/ John V. Priore | ||
| John V. Priore | ||
| AESV CREDITCARD CONSULTING, LLC | ||
| /s/ John V. Priore | ||
| Name: | John V. Priore | |
| Title: | Manager | |
9
Exhibit (B)(1)
SEARCHLIGHT CAPITAL PARTNERS, L.P. 745 Fifth Avenue, 27th Floor New York, New York 10151 |
September 18, 2026
WD Capital Partners Holdings LP
2001 Westside Parkway, Suite 155
Alpharetta, GA 30004
Attn: Thomas C. Priore
Preferred Equity Commitment Letter
Ladies and Gentlemen:
You have advised each of the entities set forth on the signature pages hereto as “Commitment Parties” (each a “Purchaser” and a “Commitment Party”, and collectively, the “Purchasers”, the “Commitment Parties”, “us” or “we”) that you intend to acquire, directly or indirectly, Priority Technology Holdings, Inc., a Delaware corporation (the “Company”) (as described on Exhibit A hereto) and consummate the other transactions described on Exhibit A hereto (collectively, the “Transactions”). Capitalized terms used but not otherwise defined herein are used with the meanings assigned to such terms in the Exhibits hereto. All references herein to Sections or Exhibits shall be construed to refer to Sections of this Commitment Letter (as defined below) and Exhibits to this Commitment Letter.
| 1. | Commitments |
In connection with the Transactions contemplated hereby, each of the Purchasers hereby, severally and not jointly, commits to purchase, and WD Capital Partners Holdings LP, a Delaware limited partnership (“you” or the “Issuer”), hereby commits to issue and sell to such Purchaser, Series A Preferred Units (the “Preferred Units”) with an Initial Stated Value amount set forth opposite such Purchaser’s name on Schedule I hereto, and with an aggregate Initial Stated Value of up to $160,000,000 (but not less than $150,000,000), which shall be funded in cash (the “Equity Commitment”), upon the terms set forth or referred to in this letter, the Transaction Summary attached hereto as Exhibit A and the Summary of Terms and Conditions for the Preferred Units and Common Units (as defined below) attached hereto as Exhibit B (the “Equity Term Sheet”). The purchase, issuance and sale of the Preferred Units is subject only to the conditions set forth on Exhibit C attached hereto (the “Conditions Annex”). This letter, together with Exhibits A through C, including the annexes thereto, collectively constitute this “Commitment Letter.”
In connection with the purchase of the Preferred Units, you shall issue to the Purchasers (directly and/or through one or more affiliates, directly or indirectly managed investment funds and accounts) common equity interests of the Issuer (the “Common Units”), on the terms set forth in the Equity Term Sheet (together with the purchase of the Preferred Units, the “Investment”).
You agree that no other purchasers will be appointed, no other titles will be awarded and no compensation will be paid to obtain the commitment of any person to become a purchaser of the Preferred Units unless you and we shall so reasonably agree.
| 2. | Representations and Warranties; Covenants. |
Each Commitment Party hereby covenants, represents and warrants to the Issuer that: (a) it is a legal entity duly formed or organized, validly existing and (to the extent such concept is recognized under the laws of such jurisdiction) in good standing under the laws of its jurisdiction of formation or organization; (b) it has all necessary limited partnership power and authority to execute, deliver and perform this Commitment Letter; (c) the execution, delivery and performance of this Commitment Letter by it has been duly authorized and approved by all necessary action by it and no other action on the part of such Commitment Party or any equity holder of such Commitment Party is necessary to authorize the execution, delivery and performance by such Commitment Party of this Commitment Letter and such execution, delivery and performance does not contravene any provisions of such Commitment Party’s partnership agreement or other organizational documents or side letter thereto or any law binding on such Commitment Party or its assets; (d) this Commitment Letter has been duly and validly executed and delivered by it and constitutes a legal, valid and binding obligation of such Commitment Party, enforceable against it in accordance with the terms of this Commitment Letter, subject to the effects of bankruptcy, insolvency, fraudulent transfer, reorganization, moratorium or other similar laws of general applicability affecting creditors’ rights generally and to general equity principles (whether considered in a proceeding in equity or at law); (e) all consents, approvals, authorizations, permits of, filings with and notifications to, any Governmental Entity (as defined in the Merger Agreement) necessary for the due execution, delivery and performance of this Commitment Letter by such Commitment Party have been obtained or made and all conditions thereof have been duly complied with; (f) such Commitment Party has, as of the date hereof and at Closing, will have the enforceable right to obtain sufficient liquid and unencumbered assets from its limited partners, available lines of credit or other sources of immediately available funds in an amount equal to the Equity Commitment (for purposes of clarity, it is hereby acknowledged that such funds may not be in the possession of such Commitment Party at all times but such Commitment Party has and shall have the ability to timely call such funds in order to effect the Closing (as defined in the Merger Agreement) in accordance with the terms of the Merger Agreement); (g) its execution, delivery and performance of this Commitment Letter does not and will not violate, contravene, conflict with or result in any violation of, or default (with or without notice or lapse of time or both) under any contract to which it is a party, except as would not prevent, impair or delay its ability to perform its obligations hereunder; and (h) each Commitment Party’s pro rata Equity Commitment does not exceed the maximum amount such Commitment Party is permitted to invest in any one portfolio investment pursuant to the terms of its organizational documents or otherwise, or no such restriction exists.
The Issuer hereby covenants, represents and warrants to Commitment Parties that: (a) it is a legal entity duly formed or organized, validly existing and in good standing under the laws of the State of Delaware; (b) it has all necessary limited partnership power and authority to execute, deliver and perform this Letter; (c) the execution, delivery and performance of this Commitment Letter by it has been duly and validly authorized and approved by all necessary action by it and no other action on the part of the Issuer or any equity holder of the Issuer is necessary to authorize the execution, delivery and performance by the Issuer of this Commitment Letter and such execution, delivery and performance does not contravene any provision of the Issuer’s partnership agreement or other organizational documents or side letter thereto or any law binding on the Issuer or its assets; (d) this Commitment Letter has been duly and validly executed and delivered by it and constitutes a legal, valid and binding obligation of the Issuer, enforceable against the Issuer in accordance with the terms of this Commitment Letter, subject to the effects of bankruptcy, insolvency, fraudulent transfer, reorganization, moratorium or other similar laws of general applicability affecting creditors’ rights generally and to general equity principles (whether considered in a proceeding in equity or at law); and (e) all consents, approvals, authorizations, permits of, filings with and notifications to, any Governmental Entity necessary for the due execution, delivery and performance of this Commitment Letter by the Issuer have been obtained or made and all conditions thereof have been duly complied with.
- 2 -
Each Commitment Party shall provide to the Company for inclusion in the Restructuring Notices (as defined in the Merger Agreement) all information regarding the relevant persons or entities of Searchlight Capital Partners, L.P. (as determined by counsel for such entities or requested by the applicable Governmental Entity (as defined in the Merger Agreement)) as if such entities were deemed, as of the Closing to exercise “Control” as set forth in each relevant state’s money transmission statute within forty-five (45) days following the execution of this Commitment Letter (in the case of preparation and submission) or the date the Governmental Entity’s request is communicated to such Commitment Party (in the case of supplementation); provided that, with respect to any personal, financial, fingerprinting, background check or other sensitive information that is required to be provided, such Commitment Party may provide such information directly to the applicable Governmental Entity or applicable regulatory filing system, and such Commitment Party shall keep the Company reasonably informed of the status of such submission and provide such evidence of submission as may be reasonably requested by the Company and lawfully provided; provided, further, that, with respect to any such information that is not available with such forty-five (45) days period, such Commitment Party shall cause such information to be provided as promptly as practicable thereafter and shall keep the Company reasonably informed of the status of obtaining such information.
| 3. | Closing Payment |
You agree to pay (or cause to be paid) to the Commitment Parties a closing payment (the “Closing Payment”) in respect of the Preferred Units funded in cash on the Closing Date as expressly set forth in the Equity Term Sheet under the section labeled “Closing Payment,” which Closing Payment shall be allocated among the Commitment Parties based on their pro rata share of the Equity Commitment as set forth on Schedule I, and which the parties hereto agree to treat for U.S. federal and other applicable tax purposes as an adjustment (i.e., discount) to the purchase price of the Preferred Units and/or Common Units. Once paid, except as agreed in writing by the parties hereto, such amount shall not be refundable under any circumstances.
| 4. | No Shop; Alternate Transaction |
You agree and acknowledge that, in connection with the consummation of the Acquisition and subject to our compliance with the terms and conditions of this Commitment Letter, in no event shall the Acquisition be consummated without simultaneously consummating the Investment (and we may specifically enforce the foregoing).
From the date hereof until the earliest of: (a) the consummation of the Acquisition; and (b) the valid termination of the Merger Agreement in accordance with its terms (or such later date as you and the Purchasers shall have mutually agreed to extent the Purchasers’ commitments hereunder), you (i) shall not, and shall cause your affiliates (excluding the Company and its subsidiaries), agents, representatives, counsel, consultants and advisors and any other person acting on your or their behalf not to, directly or indirectly solicit, participate in any negotiations or discussions with, or provide or afford access to information to any third party with respect to, or otherwise facilitate, encourage or accept any offers for the purchase of Preferred Units or any alternative preferred equity, equity or debt financing arrangements in connection with the Transactions (other than in connection with the Closing Date Debt Incurrence (as defined on Exhibit A) or rollover by existing equity holders of the Company) and (ii) shall terminate or have terminated prior to the date hereof any agreement or arrangement related to the foregoing to which you or your affiliates are parties, as well as any activities and discussions related to the foregoing and may be continuing on the date hereof with any party other than the Purchasers and their representatives.
- 3 -
If the Acquisition is not consummated on the date that is on or prior to the Expiration Date, and during the period from the Expiration Date until the date that is six months after the Expiration Date, you or any of your affiliates consummate an acquisition (or any similar transaction) that is substantially similar to the Transaction described in the Transaction Summary attached hereto as Exhibit A and, in any case, includes an acquisition of the equity interests of the Company by entities affiliated with Thomas C. Priore following which the Company ceases to be listed on any national securities exchange (any such transaction, an “Alternate Transaction”), in each case, with preferred equity or holding company indebtedness as a financing source, which for the avoidance of doubt may be provided to the Company or one or more of its subsidiaries to effect such Alternate Transaction, then you agree that you shall offer the Purchasers the bona fide reasonable opportunity to provide preferred equity financing or holding company indebtedness for such Alternate Transaction on substantially the same terms and conditions contemplated by this Commitment Letter, except that the amount of such financing shall be proportionately adjusted upward or downward, as applicable, to reflect the actual amount of preferred equity or holding company indebtedness financing required to consummate such Alternate Transaction as of the date thereof.
If the Acquisition is not consummated on or prior to the Expiration Date and, following the date that is six months after the Expiration Date, you or any of your affiliates propose to consummate an Alternate Transaction with preferred equity or holding company indebtedness as a financing source provided by any unaffiliated third-party, which for the avoidance of doubt may be provided to the Company or one or more of its subsidiaries to effect such Alternate Transaction, then you agree that, prior to entering into any binding agreement with such unaffiliated third-party with respect to such financing, you shall first offer the Purchasers the right, but not the obligation, to provide such financing on the same terms and conditions offered or proposed to be offered to such unaffiliated third-party. The Purchasers shall have ten business days from receipt of such offer (which offer shall include all material terms thereof in reasonable detail) to notify you of their election to provide such financing on such terms. If the Purchasers do not so notify you of their election within such period, you shall be free to consummate such Alternate Transaction with such unaffiliated third-party on terms no more favorable in the aggregate to such financing source than those offered to the Purchasers; provided, that if the terms of such financing are subsequently modified to be more favorable in the aggregate to such third-party, then you shall re-offer the Purchasers the right of first offer on such modified terms in accordance with this paragraph.
If an Alternate Transaction is completed using preferred equity or holding company indebtedness as a financing source and you were required pursuant to this Section 4 to offer the Purchasers the bona fide reasonable opportunity to provide such financing but did not so offer a bona fide reasonable opportunity, then you agree to pay (or cause to be paid), upon the closing of such Alternate Transaction, in cash to the Purchasers, an aggregate amount equal to 50% of the Closing Payment, based on the stated value of such preferred equity or holding company indebtedness funding, and allocated among the Purchasers on a pro rata basis.
| 5. | Conditions |
The Purchasers’ commitment to purchase the Preferred Units on the Closing Date is subject only to the conditions set forth in the Conditions Annex, and upon satisfaction (or waiver by the Purchasers) of the conditions set forth therein, the making of the Investment on the Closing Date shall occur.
| 6. | Limited Guaranty |
Concurrently with the execution and delivery of this Commitment Letter, the Commitment Parties are executing and delivering to the Company a limited guaranty related to certain of Parent’s obligations under the Merger Agreement (the “Limited Guaranty”). Notwithstanding anything to the contrary set forth in this Commitment Letter, the Merger Agreement or the Limited Guaranty, (a) the Company’s or any of its Related Parties’ (as defined in the Limited Guaranty) right to assert any Permitted Claim (as defined in the Limited Guaranty) against the applicable Person (including the Company’s rights to enforce this Commitment Letter pursuant to Section 8) and (b) the Company or any of its Related Parties’ right to assert a claim arising out of or relating to fraud of the Commitment Parties (collectively, the claims set forth in clauses (a) and (b), the “Retained Claims”), shall be, and are intended to, be the sole and exclusive direct or indirect remedies available to the Company, its affiliates or its or their respective Related Parties and any other Person, directly or indirectly, claiming by, through or for the benefit of any of the foregoing, against the Commitment Parties or any Related Party of the Commitment Parties in its capacity as such for any liability, obligation, loss, damage or recovery of any kind whatsoever (including any multiple, consequential, indirect, special, statutory, exemplary or punitive damages or damages arising from loss of profits, business opportunities or goodwill, diminution in value or any other losses, whether at law, in equity, in contract, in tort or otherwise) arising under or in connection with any breach of this Commitment Letter, the Merger Agreement, the Limited Guaranty, or any documents or instruments delivered in connection herewith or therewith or the transactions contemplated hereby or thereby (including the termination or abandonment thereof) or otherwise (in each case, whether willfully, intentionally, unintentionally or otherwise) or the failure of the Merger to be consummated for any reason or otherwise in connection with the transactions contemplated hereby and thereby or otherwise or in respect of any oral representations made or alleged to have been made in connection herewith or therewith, it being expressly agreed and acknowledged that no personal liability whatsoever shall attach to, be imposed on, or otherwise be incurred by any Related Party of the Commitment Parties (other than the applicable Persons pursuant to Permitted Claims), as such, for any obligations under the Merger Agreement; provided, that, if the Commitment Parties’ purchase of the Preferred Units as contemplated hereunder and the closing of the Merger occurs, none of the Company or any of its affiliates or Related Parties, or any other Person, directly or indirectly, claiming by, through or for the benefit of any of the foregoing, may recover any amount whatsoever under the Limited Guaranty. Notwithstanding the foregoing, the preceding sentence shall not in any respect limit claims of the Issuer against the Commitment Parties arising directly out of the Commitment Parties’ obligations under this Commitment Letter.
- 4 -
| 7. | Parties in Interest; Third Party Beneficiaries |
Each of the parties hereto hereby agrees that its respective agreements and obligations set forth herein are solely for the benefit of the other parties hereto and each of its respective successors and permitted assigns, in accordance with and subject to the terms of this Commitment Letter. This Commitment Letter is not intended to, and does not, confer upon any Person other than the parties hereto and their respective successors and permitted assigns any benefits, rights or remedies under or by reason of, or any rights to enforce or cause the Issuer to enforce, the obligations set forth herein, except that (a) the Company (i) is an express third-party beneficiary of the last paragraph of Section 2, this Section 7, Section 8 and Section 12, and is intended to benefit therefrom and (ii) shall expressly be entitled to enforce the rights of the Issuer under this Commitment Letter, solely with respect to the Company’s right to seek specific performance pursuant to Section 9.9(b) of the Merger Agreement in accordance with Section 8 of this Commitment Letter, and (b) each of the Commitment Parties’ Related Parties is an express third-party beneficiary of this Commitment Letter for the purposes of relying on and enforcing the provisions of Section 6. The Commitment Parties acknowledge that the Company has specifically relied on this Commitment Letter in determining to enter into the Merger Agreement.
| 8. | Enforceability |
This Commitment Letter may only be enforced by (a) the Issuer or (b) the Company (and, pursuant to Section 7, the Company is an express third-party beneficiary of this Commitment Letter and may rely on and enforce the provisions of this Commitment Letter accordingly) pursuant to or in connection with the Company’s rights, solely pursuant to and following the satisfaction of the terms and conditions of Section 9.9(b) of the Merger Agreement to obtain specific performance or other equitable relief to enforce Parent’s obligation to cause the Commitment Parties (and its successors and permitted assigns (solely if and to the extent an assignment has occurred in accordance with the terms of this Commitment Letter)) to fund (or to directly enforce the Commitment Parties’ obligation to fund) the Equity Commitment in accordance with the terms hereof, pursuant to, and subject to, and solely in accordance with, the terms of Section 9.9 of the Merger Agreement and the rights and obligations set forth herein; provided, that, notwithstanding the foregoing, the Company’s right to enforce the Commitment Parties’ obligation to fund the Equity Commitment shall arise solely pursuant and subject to the conditions set forth in Section 9.9(b) of the Merger Agreement. Neither the Issuer’s creditors nor any other Person (other than the Company to the extent provided herein) shall have any right to enforce this Commitment Letter or to cause the Issuer to enforce this Commitment Letter. Each party hereto hereby waives any requirement for the security or posting of any bond in connection with such remedies. The election to pursue an injunction, specific performance or other equitable relief shall not restrict, impair or otherwise limit the Company from, in the alternative, seeking to terminate the Merger Agreement and pursuing payment of the Parent Termination Fee, solely to the extent payable pursuant to the terms of the Merger Agreement. Notwithstanding anything to the contrary contained in this Commitment Letter or in the Limited Guaranty, under no circumstance shall the Company be permitted or entitled to receive both (a) a grant of specific performance hereunder or under the Merger Agreement to cause the Closing to occur or to cause the Issuer to enforce the funding of the Equity Commitment under this Commitment Letter, and (b) payment of the Parent Termination Fee or any monetary damages for breach of the Merger Agreement or this Commitment Letter.
- 5 -
| 9. | Confidentiality |
You agree that you will not disclose the contents of this Commitment Letter or any of its terms or substance to any third party (including, without limitation, any financial institution or intermediary) without the Purchasers’ prior written consent, except the Commitment Letter may be disclosed (a) to your affiliates, equityholders, members, partners, and the directors, officers, employees, attorneys, accountants, independent auditors, agents and other advisors of any of the foregoing, in connection with the Transactions; provided, that this Commitment Letter may also be disclosed to the Company and its equity holders, directors, officers, employees, affiliates, members, partners, stockholders, attorneys, accountants, independent auditors, agents and other advisors, in each case on a confidential and need-to-know basis, (b) to the extent compelled in a judicial or administrative proceeding or as otherwise required by law (in which case you agree, to the extent permitted by law and reasonably practicable, to (i) promptly inform the Purchasers prior to any such disclosure or such later time as may be required by law and (ii) use commercially reasonable efforts to ensure that any such information so disclosed is accorded confidential treatment), (c) in any proxy statement or other filing relating to the Merger or the Transactions, (d) to prospective bona fide additional investors, (e) to the extent such information becomes publicly available other than by reason of improper disclosure by you in violation of any confidentiality obligations hereunder, (f) if the Purchasers consent to such proposed disclosure (such consent not to be unreasonably withheld, delayed or conditioned) and (g) in connection with the enforcement of any rights or remedies under this Commitment Letter, the Merger Agreement or the Limited Guaranty. You agree to inform all such persons who receive non-public information concerning the Purchasers or this Commitment Letter that such information is confidential and may not be used for any purpose other than in connection with the Transactions and may not be disclosed to any other person, except pursuant to any of the exceptions in the immediately preceding sentence.
The Purchasers hereby acknowledge, confirm and agree to be bound by, and that the terms of this Commitment Letter are subject to in all cases, the terms of that certain Joinder to Confidentiality Agreement, dated June 23, 2026, by and between Searchlight Capital Partners, L.P. and Thomas Priore (the “NDA Joinder”) as though the Purchasers were an original party thereto and acknowledge and agree that the Purchasers are “Receiving Party Representatives” (as defined in the NDA Joinder) thereunder. Notwithstanding anything to the contrary in the NDA Joinder, each Purchaser shall be permitted to disclose any information received by it in connection with the Transactions and related transactions (including any information obtained by it based on a review of any books and records relating to the Issuer and the Company or any of their respective subsidiaries and affiliates) to its managed funds, managed accounts, limited partners and current and prospective direct or indirect investors on a “need to know” basis solely in connection with the transactions contemplated hereby, in each case, who are bound by confidentiality or similar agreements with the Purchasers or their affiliates.
- 6 -
| 10. | Indemnification; Expenses |
You agree (a) to indemnify and hold harmless each of the Purchasers, their respective affiliates and controlling persons and the respective directors, officers, employees, partners, equityholders, agents, advisors and other representatives of each of the foregoing (each, an “indemnified person”) from and against any and all losses, claims, damages and liabilities to which any such indemnified person may become subject arising out of or in connection with this Commitment Letter, the Investment, the use of the proceeds thereof and the Transactions or any claim, litigation, investigation, inquiry or proceeding relating to any of the foregoing (a “Proceeding”), regardless of whether any indemnified person is a party thereto or whether such Proceeding is brought by you, any of your affiliates, your equityholders or creditors or any third party, and to reimburse each indemnified person within 30 days following written demand therefor (together with reasonable backup documentation supporting such reimbursement request) for any reasonable and documented legal or other out-of-pocket expenses incurred in connection with investigating or defending any Proceeding (but limited, in the case of legal fees and expenses, to one counsel to such indemnified person, taken as a whole, and, solely in the case of an actual or potential conflict of interest, one additional counsel to all affected indemnified persons, taken as a whole (and, if reasonably necessary, of one local counsel in any relevant material jurisdiction to all such persons, taken as a whole and, solely in the case of an actual or potential conflict of interest, one additional local counsel to all affected indemnified persons, taken as a whole, in each such material relevant jurisdiction)); provided, that the foregoing indemnity will not, as to any indemnified person, apply to losses, claims, damages, liabilities or related expenses to the extent they arise from (i) the willful misconduct, bad faith or gross negligence of, or material breach of this Commitment Letter, the Limited Guaranty or the Equity Documentation by, such indemnified person (or any of its Related Parties), in each case, as determined by a final non-appealable judgment of a court of competent jurisdiction, or (ii) any dispute solely among indemnified persons which does not arise out of any act or omission of the Issuer or any of its subsidiaries or affiliates, and (b) if the Closing Date occurs, to reimburse each Purchaser on the Closing Date (to the extent an invoice therefor is received at least two business days prior to the Closing Date, or if invoiced after such date, within 30 days following receipt of the relevant invoice), for all reasonable and documented out-of-pocket expenses (including due diligence expenses, but limited, in the case of legal fees and expenses, to (i) the reasonable fees, charges and disbursements of Latham & Watkins LLP, acting as legal counsel to the Purchasers and (ii) if reasonably necessary, the fees, charges and disbursements of one local counsel in any relevant material local jurisdiction for all such persons, taken as a whole), incurred in connection with the Preferred Units and any related documentation (including this Commitment Letter and the Equity Documentation), which amounts (not including indemnification amounts) shall not exceed $1,000,000 without your consent. The foregoing provisions of this paragraph shall be superseded, in each case, to the extent covered thereby by the applicable provisions of the Equity Documentation upon execution thereof and thereafter shall have no further force and effect.
None of the indemnified persons, you or the Target or any of your or their respective affiliates or the respective directors, officers, employees, agents, advisors or other representatives of any of the foregoing shall be liable for any special, indirect, consequential (including lost profits or diminution of value) or punitive damages in connection with this Commitment Letter or the Preferred Units (including the use or intended use of the proceeds of the Preferred Units) or the transactions contemplated hereby or thereby; provided, that nothing contained in this sentence shall limit your indemnification obligations hereinabove to the extent such punitive damages are awarded to a third party in connection with a claim for which such indemnified person is otherwise entitled to indemnification hereunder.
- 7 -
No indemnified person or any other party hereto shall be liable for any damages arising from the use by any person (other than such indemnified person (or its Related Parties) or any other party hereto) of written information with respect to the Issuer, the Company and each of their respective subsidiaries in connection with the Transactions, or other materials obtained through electronic, telecommunications or other information transmission systems, except to the extent of direct, as opposed to indirect, consequential or punitive, damages arising from gross negligence, bad faith or willful misconduct of, or material breach of this Commitment Letter, the Limited Guaranty or the Equity Documentation by, such indemnified person (or any of its Related Parties), or such other party hereto, as applicable, in each case, as determined by a final non-appealable judgment of a court of competent jurisdiction; provided, that nothing contained in this sentence shall limit your indemnification obligations hereinabove to the extent any such punitive damages are included in any third party claim in connection with which such indemnified person is otherwise entitled to indemnification hereunder. In the event that any Proceeding is instituted involving any indemnified person for which indemnification is to be sought hereunder, then such indemnified person will promptly notify you thereof; provided, that any failure of any indemnified person to so notify you shall not affect any of your obligations under this Section, except to the extent that you are actually and materially prejudiced by such failure to so notify you.
You shall not be liable for, and the indemnification obligation in the preceding paragraph shall not apply to, any settlement of any Proceeding effected by any indemnified person without your consent (which consent shall not be unreasonably withheld, conditioned or delayed) or any other loss, claim, damage, liability and/or expense incurred in connection therewith, but if any such Proceeding is settled with your written consent, or if there is a final non-appealable judgment of a court of competent jurisdiction against an indemnified person in any such Proceeding, you agree to indemnify and hold harmless such indemnified person in the manner set forth above. You shall not, without the prior written consent of the affected indemnified person (which consent shall not be unreasonably withheld, conditioned or delayed), effect any settlement of any pending or threatened Proceeding against any indemnified person in respect of which indemnity could have been sought hereunder by such indemnified person unless such settlement (a) includes an unconditional release of such indemnified person from all liability or claims that are the subject matter of such Proceeding and (b) does not include any statement as to any admission of fault or culpability.
| 11. | Sharing Information; Absence of Fiduciary Relationship |
You acknowledge that the Purchasers and their respective affiliates may have economic interests that conflict with those of you, the Company and your and its respective affiliates, and are under no obligation to disclose any conflicting interest to you. You further acknowledge and agree that (a) the Purchasers will act under this Commitment Letter as independent contractors and no fiduciary, advisory or agency relationship or implied duty between you and the Purchasers has been or will be created in respect of any of the transactions contemplated by this Commitment Letter, irrespective of whether the Purchasers or their respective affiliates have advised or are advising you on other matters and (b) you will not assert any claim against any Purchaser for breach or alleged breach of fiduciary duty and agree that such Purchaser shall not have any direct or indirect liability to you in respect of such a fiduciary duty claim or to any person asserting a fiduciary duty claim on behalf of or in right of you, including your stockholders, employees or creditors. Neither the Purchasers nor their respective affiliates will use information obtained from you or your affiliates in connection with the Investment or the other Transactions in connection with the performance by the Purchasers and their respective affiliates of services for other companies or other persons.
As you know, certain affiliates of the Purchasers are full service securities firms engaged, either directly or through their affiliates, in various activities, which may include securities trading, commodities trading, investment management, financing and brokerage activities and financial planning and benefits counseling for both companies and individuals. In the ordinary course of these activities, certain affiliates of the Purchasers may actively engage in commodities trading or trade the debt and equity securities (or related derivative securities) and financial instruments (including bank loans and other obligations) of, and the Purchasers and their affiliates may be providing debt financing or equity capital to, you and your affiliates, the Company and its affiliates, the Company’s customers or competitors and other companies which may be the subject of the arrangements contemplated by this Commitment Letter for their own account and for the accounts of their customers and may at any time hold long and short positions in such securities.
- 8 -
The Purchasers and their respective affiliates may also co-invest with, make direct investments in, and invest or co-invest client monies in or with funds or other investment vehicles managed by other parties, and such funds or other investment vehicles may trade or make investments in securities of you and your affiliates, the Company and its affiliates or other companies which may be the subject of the arrangements contemplated by this Commitment Letter or engage in commodities or other trading with any thereof.
You acknowledge and agree that (i) the transactions contemplated by this Commitment Letter are arm’s-length commercial transactions between the Purchasers and their respective affiliates, on the one hand, and you, on the other, (ii) in connection therewith and with the process leading to such transaction each of the Company and its applicable affiliates (as the case may be) is acting solely as a principal and not as an agent or fiduciary of you, the Company, your and their respective subsidiaries, management, equity holders, creditors, affiliates or any other person, (iii) each of the Purchasers and its applicable affiliates (as the case may be) have not assumed an advisory or fiduciary responsibility or any other obligation in favor of you or your respective affiliates with respect to the financing transactions contemplated hereby, the exercise of the remedies with respect thereto or the process leading thereto (irrespective of whether the Purchasers or any of their respective affiliates have advised or are currently advising you or the Company on other matters) and the Purchasers have no obligation to you or your or their affiliates with respect to the transactions contemplated hereby except the obligations expressly set forth in this Commitment Letter and (iv) the Purchasers and their respective affiliates have not provided any legal, accounting, regulatory or tax advice and you have consulted your own legal and financial advisors to the extent you deemed appropriate.
You further acknowledge and agree that you are responsible for making your own independent judgment with respect to any transactions contemplated by this Commitment Letter and the process leading thereto. You agree that you will not claim that the Purchasers or their applicable affiliates, as the case may be, have rendered advisory services of any nature or respect, or owe a fiduciary or similar duty to you or your affiliates, in connection with any transactions contemplated by this Commitment Letter or the process leading thereto.
| 12. | Assignments and Amendments |
This Commitment Letter and the commitments hereunder are not assignable without the prior written consent of each other party hereto and the Company and any attempted assignment without such consent will be null and void; provided, that the Purchasers shall have the right to reallocate, assign, sell or otherwise transfer all or a portion of their respective commitment in respect of the Investment and their respective rights and obligations hereunder (without the consent of any person or entity but with notice to the Issuer and the Company) to one or more investment funds, alternative investment vehicles, accounts or special purpose vehicles managed exclusively by Searchlight Capital Partners, LP; provided, further, that no such reallocation, assignment, sale or transfer shall reduce or release any Purchaser from its obligations hereunder (including the applicable commitment to fund the Equity Commitment) unless and until such obligations are satisfied in full. This Commitment Letter may not be amended or waived except in a written instrument signed by you, the Company and the Purchasers.
This Commitment Letter is the only agreement that has been entered into among us and you solely with respect to the Preferred Units and the Common Units and sets forth the entire understanding of the parties with respect hereto and thereto, and supersedes all prior agreements and understandings related to the subject matter hereof.
- 9 -
| 13. | Counterparts and Governing Law |
This Commitment Letter may be executed in counterparts, each of which shall be deemed an original and all of which counterparts shall constitute one and the same document. Delivery of an executed signature page of this Commitment Letter by electronic (including “PDF”) transmission shall be effective as delivery of a manually executed counterpart hereof. This Commitment Letter shall not be denied legal effect merely because the signatures thereto were delivered by electronic (including “PDF”) transmission and each party hereto agrees not to contest the validity or enforceability of this Commitment Letter merely because it is made electronically. The words “execution,” “signed,” “signature,” “delivery,” and words of like import in or relating to this Commitment Letter and/or any document to be signed in connection with this letter agreement and the transactions contemplated hereby shall be deemed to include electronic signatures or electronic records, each of which shall be of the same legal effect, validity or enforceability as a manually executed signature, physical delivery thereof or the use of a paper-based recordkeeping system, as the case may be, to the extent and as provided for in any applicable law, including the Federal Electronic Signatures in Global and National Commerce Act, the New York State Electronic Signatures and Records Act, or any other similar state laws based on the Uniform Electronic Transactions Act.
This Commitment Letter and any claim, controversy or dispute arising under or related to this Commitment Letter (whether in tort, contract (at law or in equity) or otherwise), shall be governed by, and construed and interpreted in accordance with, the laws of the State of Delaware.
| 14. | Venue and Submission to Jurisdiction |
Each of the parties hereto irrevocably and unconditionally (a) submits to the exclusive jurisdiction of any state or federal court sitting in New Castle County in the State of Delaware (or any appellate court therefrom) over any suit, action or proceeding arising out of or relating to this Commitment Letter, (b) agrees that all claims in respect of any such action or proceeding shall be heard and determined in such Delaware state or, to the extent permitted by law, federal court and (c) agrees that a final, non-appealable judgment in any such action may be enforced in other jurisdictions in any manner provided by law. You and we agree that service of any process, summons, notice or document by registered mail addressed to such person shall be effective service of process against such person for any suit, action or proceeding brought in any such court. Each of the parties hereto hereby irrevocably and unconditionally waives any objection to the laying of venue of any such suit, action or proceeding brought in any such court and any claim that any such suit, action or proceeding has been brought in an inconvenient forum.
| 15. | Waiver of Jury Trial |
EACH OF THE PARTIES HERETO IRREVOCABLY AGREES TO WAIVE, TO THE FULLEST EXTENT PERMITTED BY APPLICABLE LAW, ALL RIGHT TO TRIAL BY JURY IN ANY SUIT, ACTION, PROCEEDING OR COUNTERCLAIM (WHETHER BASED UPON CONTRACT, TORT OR OTHERWISE) RELATED TO OR ARISING OUT OF THE MERGER, THIS COMMITMENT LETTER OR THE PERFORMANCE BY US OR ANY OF OUR AFFILIATES OF THE SERVICES CONTEMPLATED HEREBY. THIS WAIVER APPLIES TO ANY ACTION, SUIT OR PROCEEDING WHETHER SOUNDING IN TORT, CONTRACT OR OTHERWISE.
| 16. | Survival |
The provisions of this Commitment Letter set forth under this heading and the headings “No Shop; Alternate Transaction”, “Confidentiality”, “Indemnification; Expenses”, “Sharing Information; Absence of Fiduciary Relationship”, “Assignments and Amendments”, “Counterparts and Governing Law”, “Venue and Submission to Jurisdiction” and “Waiver of Jury Trial” shall survive the termination or expiration of this Commitment Letter and shall remain in full force and effect regardless of whether the Investment closes; provided, that if the Investment is consummated, the provisions under the headings “Confidentiality”, “Indemnification; Expenses”, and “Sharing Information; Absence of Fiduciary Relationship” shall be superseded and deemed replaced by the terms of the Equity Documentation governing such matters.
- 10 -
| 17. | Integration |
This Commitment Letter supersedes any and all discussions, negotiations, understandings or agreements, written or oral, express or implied, between or among the parties hereto and their affiliates as to the subject matter hereof.
This Commitment Letter constitutes a legal, valid and binding obligation, enforceable against each of the parties hereto and thereto in accordance with their respective terms (subject to the effects of bankruptcy, insolvency, fraudulent conveyance, reorganization and other similar laws relating to or affecting creditors’ rights generally and general principles of equity (whether considered in a proceeding in equity or law)) and with respect to the subject matter contained herein and therein (including an obligation to negotiate in good faith), it being acknowledged and agreed that the obligation to consummate the Investment on the Closing Date pursuant to the commitments provided hereunder is subject only to those conditions set forth in the Conditions Annex.
| 18. | No Underwriter or Similar Role |
NOTWITHSTANDING ANYTHING CONTAINED HEREIN TO THE CONTRARY, NEITHER THE PURCHASERS NOR ANY OF THEIR AFFILIATES ARE ACTING AS AN UNDERWRITER, ARRANGER, TRUSTEE, AGENT OR IN A SIMILAR ROLE OR OTHERWISE PERFORMING ANY SERVICES HEREUNDER AND THE ROLE OF THE PURCHASER AND ITS AFFILIATES HEREUNDER SHALL BE LIMITED TO THEIR COMMITMENT TO PURCHASE THE PREFERRED UNITS AS A PRINCIPAL.
| 19. | Patriot Act |
The Purchasers hereby notify you that pursuant to the requirements of the USA PATRIOT Act, Title III of Pub. L. 107-56 (signed into law October 26, 2001) (the “PATRIOT Act”), the Purchasers may be required to obtain, verify and record information that identifies the Company, which information includes the name, address, tax identification number and other information regarding the Company that will allow the Purchaser to identify the Company in accordance with the PATRIOT Act. This notice is given in accordance with the requirements of the PATRIOT Act and is effective as to the Purchaser.
| 20. | Acceptance and Termination |
If the foregoing correctly sets forth our agreement, please indicate your acceptance of our offer by returning to us executed counterparts of the Commitment Letter. If you do so execute and deliver to us this Commitment Letter, we agree to hold our commitment to purchase the Preferred Units available for you until the earliest of: (a) after the execution of the Merger Agreement and prior to the time of the consummation of the Merger, the valid termination of the Merger Agreement in accordance with its terms; (b) the consummation of the Closing and funding of the Equity Commitment (at which time the Commitment Parties’ obligations hereunder shall be deemed fulfilled); (c) the assertion, in writing, in any litigation or any arbitration proceeding, by the Company or any of its Subsidiaries or any of its or their respective authorized Representatives, of any Non-Permitted Claim (as defined in the Limited Guaranty); provided, further, that for the avoidance of doubt, neither the pursuit of specific performance or other equitable relief pursuant to Section 8 of this Commitment Letter or Section 9.9(b) of the Merger Agreement, nor the subsequent or alternative pursuit of the Parent Termination Fee or Guaranteed Obligations under and solely in accordance with the Merger Agreement or the Limited Guaranty, shall constitute a claim that triggers termination of this Commitment Letter pursuant to this clause (c) or a Non-Permitted Claim (as defined in the Limited Guaranty), and the exercise of any such remedy shall not prejudice, limit or otherwise affect the Company’s right to pursue any other remedy expressly permitted hereunder, under the Merger Agreement or under the Limited Guaranty; (d) the payment by the Purchasers of their Guaranteed Obligations (as defined in the Limited Guaranty) pursuant to the Limited Guaranty; and (e) 11:59 p.m., New York City time on the date which is 90 days after the Outside Date (as defined in, and as it may be extended pursuant to the express provisions of, the Merger Agreement as in effect on the date hereof) (such earliest time, the “Expiration Date”); provided, that the termination of any commitment pursuant to this sentence shall not prejudice your rights and remedies in respect of any breach of this Commitment Letter. Upon the occurrence of any of the events referred to in the preceding sentence, this Commitment Letter and the commitments of each of the Purchasers hereunder shall automatically terminate unless the Purchasers shall, in their sole discretion, agree to an extension in writing.
[THE REMAINDER OF THIS PAGE INTENTIONALLY LEFT BLANK]
- 11 -
| Sincerely, | ||
| COMMITMENT PARTIES: | ||
| SEARCHLIGHT CAPITAL IV, L.P. | ||
| By: | Searchlight Capital Partners IV GP, L.P., | |
| its general partner | ||
| By: | Searchlight Capital Partners IV GP, LLC, | |
| its general partner | ||
| By: | /s/ Andrew Frey | |
| Name: | Andrew Frey | |
| Title: | Authorized Signatory | |
| SEARCHLIGHT CAPITAL IV PV-A, L.P. | ||
| By: | Searchlight Capital Partners IV GP, L.P., | |
| its general partner | ||
| By: | Searchlight Capital Partners IV GP, LLC, | |
| its general partner | ||
| By: | /s/ Andrew Frey | |
| Name: | Andrew Frey | |
| Title: | Authorized Signatory | |
| SEARCHLIGHT CAPITAL IV PV-B, L.P. | ||
| By: | Searchlight Capital Partners IV GP, L.P., | |
| its general partner | ||
| By: | Searchlight Capital Partners IV GP, LLC, | |
| its general partner | ||
| By: | /s/ Andrew Frey | |
| Name: | Andrew Frey | |
| Title: | Authorized Signatory | |
[Signature Page to Preferred Equity Commitment Letter]
| Agreed and accepted | ||
| AS OF THE DATE FIRST WRITTEN ABOVE: | ||
| ISSUER: | ||
| WD CAPITAL PARTNERS HOLDINGS LP | ||
| By: | /s/ Thomas C. Priore | |
| Name: | Thomas C. Priore | |
| Title: | President and Secretary | |
[Signature Page to Preferred Equity Commitment Letter]
SCHEDULE I
| Purchaser | Initial Stated Value of Preferred Units | |||
| Searchlight Capital IV, L.P. | $ | 88,679,113.00 | ||
| Searchlight Capital IV PV-A, L.P. | $ | 63,131,638.00 | ||
| Searchlight Capital IV PV-B, L.P. | $ | 8,189,249.00 | ||
| Total: | $ | 160,000,000.00 | ||
EXHIBIT A
Transaction Summary
WD Capital Partners Parent Inc., a Delaware corporation (the “Parent”) and wholly owned subsidiary of the Issuer, intends to directly acquire (the “Merger”) all of the outstanding equity interests of the Company, all as set forth in the Merger Agreement (as defined on Exhibit C). In connection therewith:
| a) | The Company, Parent and WD Capital Partners Merger Sub Inc., a newly formed Delaware corporation and a direct, wholly-owned subsidiary of Parent (“Merger Sub”), will enter into the Merger Agreement, pursuant to which, among other things, on the Closing Date, Merger Sub will merge (the “Merger”) with and into the Company, with the Company the surviving the Merger as a direct, wholly-owned subsidiary of Parent; |
| b) | On or prior to the Closing Date, the Issuer will contribute, directly or indirectly, the proceeds of the issuance of the Preferred Units to Parent in the form of common equity; |
| c) | In connection with the Closing, immediately prior to the Effective Time, certain stockholders of the Company as of immediately prior to the Effective Time (the “Rollover Stockholders”) will contribute and transfer all of their outstanding equity interests in the Company to Holdings in exchange for a number of newly issued equity interests of Holdings (collectively, the “Equity Rollover”), in each case, pursuant to the terms and conditions of that certain Support Agreement, dated as of the date hereof, by and among the Company, Parent, Holdings and the Rollover Stockholders (the “Support Agreement”); |
| d) | Priority Holdings, LLC, as borrower under the Credit Agreement (as defined on Exhibit B to the Commitment Letter) shall, (i) on or prior to the Closing Date (A) make a Borrowing (under and as defined in the Credit Agreement) in an amount sufficient, together with all available cash on hand, to make the Closing Restricted Payment (as defined below), (B) declare an irrevocable Restricted Payment (as defined in the Credit Agreement), payable at Closing, in an aggregate amount not to exceed $131,200,000 (the “Closing Restricted Payment”), the proceeds of which shall be distributed to the Company, and (C) make an “LCT Election” under and as defined in the Credit Agreement that the Closing Restricted Payment shall, from and after the date of declaration of such Closing Restricted Payment, constitute a “Limited Condition Transaction” as defined in and in accordance with Section 1.08 of the Credit Agreement and (ii) on the Closing Date, make the Closing Restricted Payment substantially concurrently with the Closing. The Closing Restricted Payment shall be irrevocable prior to the Outside Date (as defined in, and as it may be extended pursuant to the express provisions of, the Merger Agreement as in effect on the date hereof); and |
| e) | The fees, premiums and expenses and other transaction costs incurred in connection with the Transactions, including the Closing Payment and/or any upfront fees will be paid in accordance with the Equity Term Sheet and Section 3 of this Commitment Letter. |
The transactions described above are collectively referred to as the “Transactions”. For purposes of this Commitment Letter, “Closing Date” will mean the date of the consummation of the Merger and the satisfaction or waiver by the Purchasers of the conditions set forth on Exhibit C, the purchase of the Preferred Units and the issuance of the Common Units.
EXHIBIT C
Conditions to Closing
The availability of the Investment set forth in the Commitment Letter shall be subject solely to the satisfaction (or waiver by the Purchasers) of the following conditions:
| 1. | Merger. Substantially concurrently with the making of the Investment, the Merger shall have been consummated in accordance with that certain Agreement and Plan of Merger dated as the date hereof by and among the Company, Parent and Merger Sub (including the exhibits, schedules and all related documents, the “Merger Agreement”) and the conditions set forth in Section 7.1 and Section 7.3 of the Merger Agreement shall have been satisfied (without any amendment, modification or waiver of any of the provisions thereof that would be materially adverse to the interests of the Purchasers in their respective capacities as such, without the prior written consent of the Purchasers (such consent not to be unreasonably withheld, delayed or conditioned)); provided, that (i) a reduction in the purchase price under the Merger Agreement shall not be deemed to be materially adverse to the interests of the Purchasers so long as such decrease does not reduce the Initial Stated Value of the Preferred Units purchased by the Purchasers pursuant to this Commitment Letter to an amount less than $150,000,000, (ii) any amendment or waiver to or consent in respect of the terms of the Merger Agreement that has the effect of increasing the cash consideration required to be paid thereunder on the Closing Date shall not be deemed to be materially adverse to the interests of the Purchasers as long as such increase is not funded with the proceeds of indebtedness for borrowed money or equity securities ranking pari passu or senior (including structurally senior) to the Preferred Units, (iii) any purchase price adjustment expressly contemplated by the Merger Agreement (including any working capital purchase price adjustment) shall not be considered an amendment or waiver of the Merger Agreement or consent with respect thereto, and (iv) any amendment or waiver to or consent in respect of the occurrence of a Company Material Adverse Effect contained in the Merger Agreement shall be deemed materially adverse to the Purchasers. |
| 2. | Material Adverse Effect. Since the date of the Merger Agreement, there shall not have occurred any Company Material Adverse Effect. |
| 3. | Equity Rollover. The Equity Rollover shall have occurred in accordance with the terms of the Support Agreement as in effect on the date hereof without any amendment, modification or waiver of any of the provisions of the Support Agreement, without the prior written consent of the Purchasers (such consent not to be unreasonably withheld, delayed or conditioned). |
Exhibit (C)(2)
Project Prism: Preliminary Valuation Analysis January 2026
Contents 1. Market Backdrop and Trading Performance 2. Review of Company Financials & Forecasts 3. Preliminary Valuation Perspectives 4. Appendix
Market Backdrop and Trading Performance
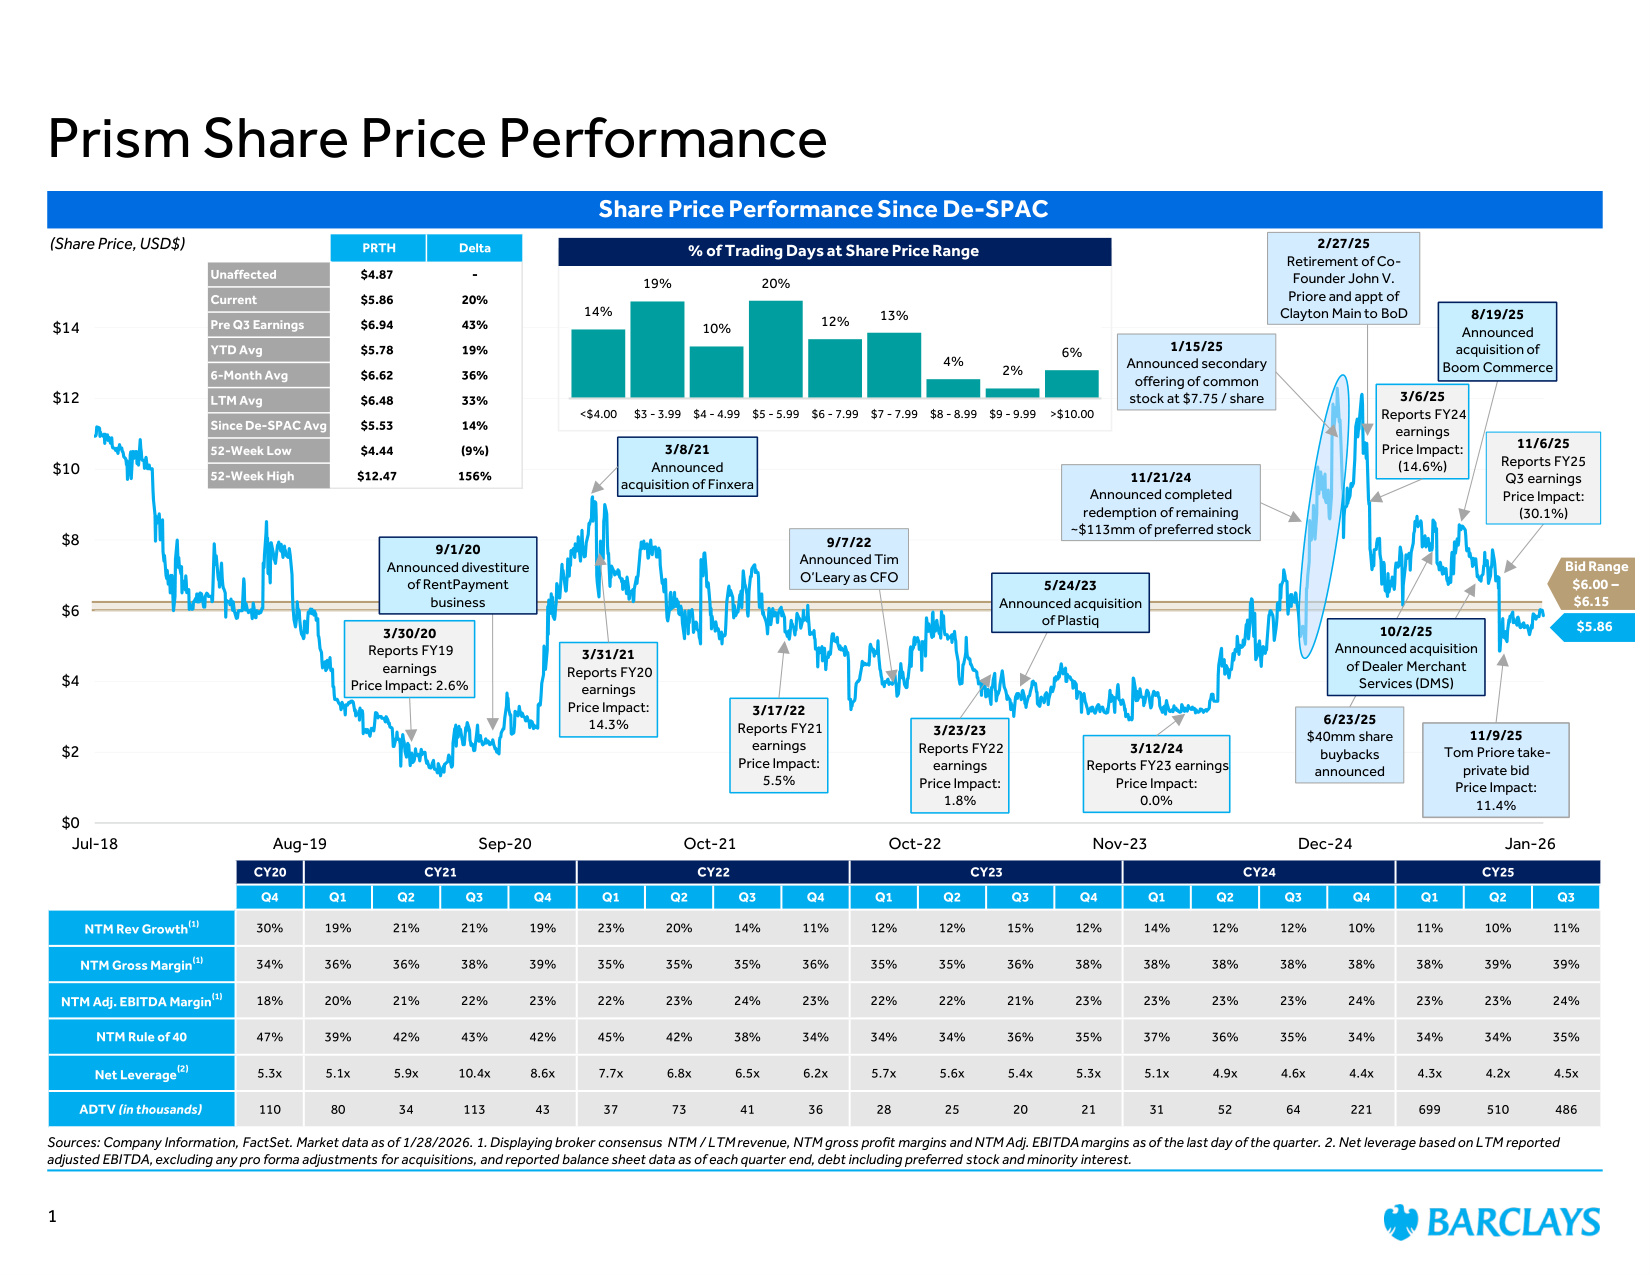
$0 $2 $4 $6 $8 $10 $12 $14 Jul-18 Aug-19 Sep-20 Oct-21 Oct-22 Nov-23 Dec-24 Jan-26 Sources: Company Information, FactSet. Market data as of 1/28/2026. 1. Displaying broker consensus NTM / LTM revenue, NTM gross profit margins and NTM Adj. EBITDA margins as of the last day of the quarter. 2. Net leverage based on LTM reported adjusted EBITDA, excluding any pro forma adjustments for acquisitions, and reported balance sheet data as of each quarter end, debt including preferred stock and minority interest. Prism Share Price Performance Share Price Performance Since De-SPAC (Share Price, USD$) 6/23/25 $40mm share buybacks announced 3/17/22 Reports FY21 earnings Price Impact: 5.5% $5.86 3/23/23 Reports FY22 earnings Price Impact: 1.8% 3/12/24 Reports FY23 earnings Price Impact: 0.0% 2/27/25 Retirement of Co- Founder John V. Priore and appt of Clayton Main to BoD 1/15/25 Announced secondary offering of common stock at $7.75 / share 11/9/25 Tom Priore take- private bid Price Impact: 11.4% Bid Range $6.00 – $6.15 CY20 CY21 CY22 CY23 CY24 CY25 Q4 Q1 Q2 Q3 Q4 Q1 Q2 Q3 Q4 Q1 Q2 Q3 Q4 Q1 Q2 Q3 Q4 Q1 Q2 Q3 NTM Rev Growth(1) 30% 19% 21% 21% 19% 23% 20% 14% 11% 12% 12% 15% 12% 14% 12% 12% 10% 11% 10% 11% NTM Gross Margin(1) 34% 36% 36% 38% 39% 35% 35% 35% 36% 35% 35% 36% 38% 38% 38% 38% 38% 38% 39% 39% NTM Adj. EBITDA Margin(1) 18% 20% 21% 22% 23% 22% 23% 24% 23% 22% 22% 21% 23% 23% 23% 23% 24% 23% 23% 24% NTM Rule of 40 47% 39% 42% 43% 42% 45% 42% 38% 34% 34% 34% 36% 35% 37% 36% 35% 34% 34% 34% 35% Net Leverage(2) 5.3x 5.1x 5.9x 10.4x 8.6x 7.7x 6.8x 6.5x 6.2x 5.7x 5.6x 5.4x 5.3x 5.1x 4.9x 4.6x 4.4x 4.3x 4.2x 4.5x ADTV (in thousands) 110 80 34 113 43 37 73 41 36 28 25 20 21 31 52 64 221 699 510 486 PRTH Delta Unaffected $4.87 - Current $5.86 20% Pre Q3 Earnings $6.94 43% YTD Avg $5.78 19% 6-Month Avg $6.62 36% LTM Avg $6.48 33% Since De-SPAC Avg $5.53 14% 52-Week Low $4.44 (9%) 52-Week High $12.47 156% 11/21/24 Announced completed redemption of remaining ~$113mm of preferred stock 1 3/8/21 Announced acquisition of Finxera 9/7/22 Announced Tim O'Leary as CFO 5/24/23 Announced acquisition of Plastiq 8/19/25 Announced acquisition of Boom Commerce 10/2/25 Announced acquisition of Dealer Merchant Services (DMS) 3/31/21 Reports FY20 earnings Price Impact: 14.3% 3/30/20 Reports FY19 earnings Price Impact: 2.6% 9/1/20 Announced divestiture of RentPayment business 14% 19% 10% 20% 12% 13% 4% 2% 6% <$4.00 $3 - 3.99 $4 - 4.99 $5 - 5.99 $6 - 7.99 $7 - 7.99 $8 - 8.99 $9 - 9.99 >$10.00 % of Trading Days at Share Price Range 3/6/25 Reports FY24 earnings Price Impact: (14.6%) 11/6/25 Reports FY25 Q3 earnings Price Impact: (30.1%)
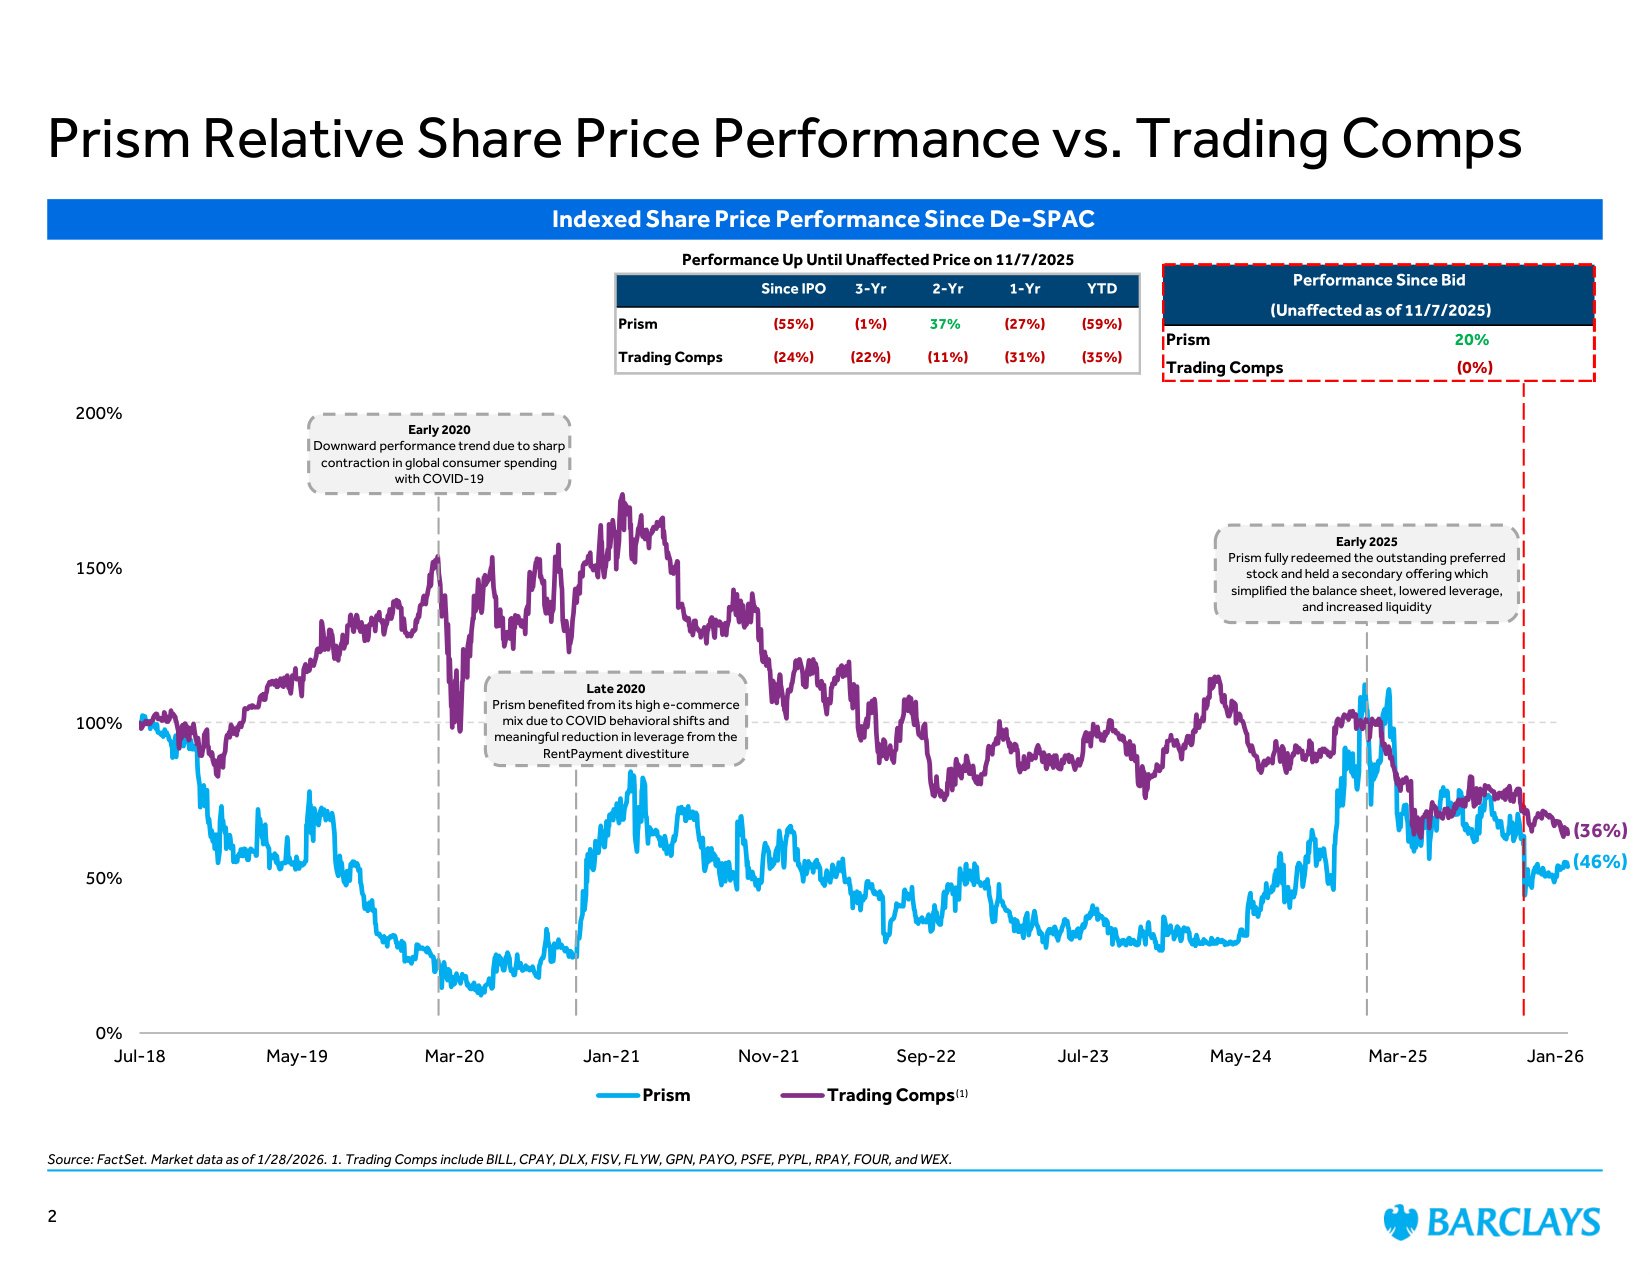
Indexed Share Price Performance Since De-SPAC 0% 50% 100% 150% 200% Jul-18 May-19 Mar-20 Jan-21 Nov-21 Sep-22 Jul-23 May-24 Mar-25 Jan-26 Prism Trading Comps (36%) (46%) (1) Performance Since Bid (Unaffected as of 11/7/2025) Prism 20% Trading Comps (0%) Performance Up Until Unaffected Price on 11/7/2025 Since IPO 3-Yr 2-Yr 1-Yr YTD Prism (55%) (1%) 37% (27%) (59%) Trading Comps (24%) (22%) (11%) (31%) (35%) Prism Relative Share Price Performance vs. Trading Comps Source: FactSet. Market data as of 1/28/2026. 1. Trading Comps include BILL, CPAY, DLX, FISV, FLYW, GPN, PAYO, PSFE, PYPL, RPAY, FOUR, and WEX. Early 2020 Downward performance trend due to sharp contraction in global consumer spending with COVID-19 2 Early 2025 Prism fully redeemed the outstanding preferred stock and held a secondary offering which simplified the balance sheet, lowered leverage, and increased liquidity Late 2020 Prism benefited from its high e-commerce mix due to COVID behavioral shifts and meaningful reduction in leverage from the RentPayment divestiture
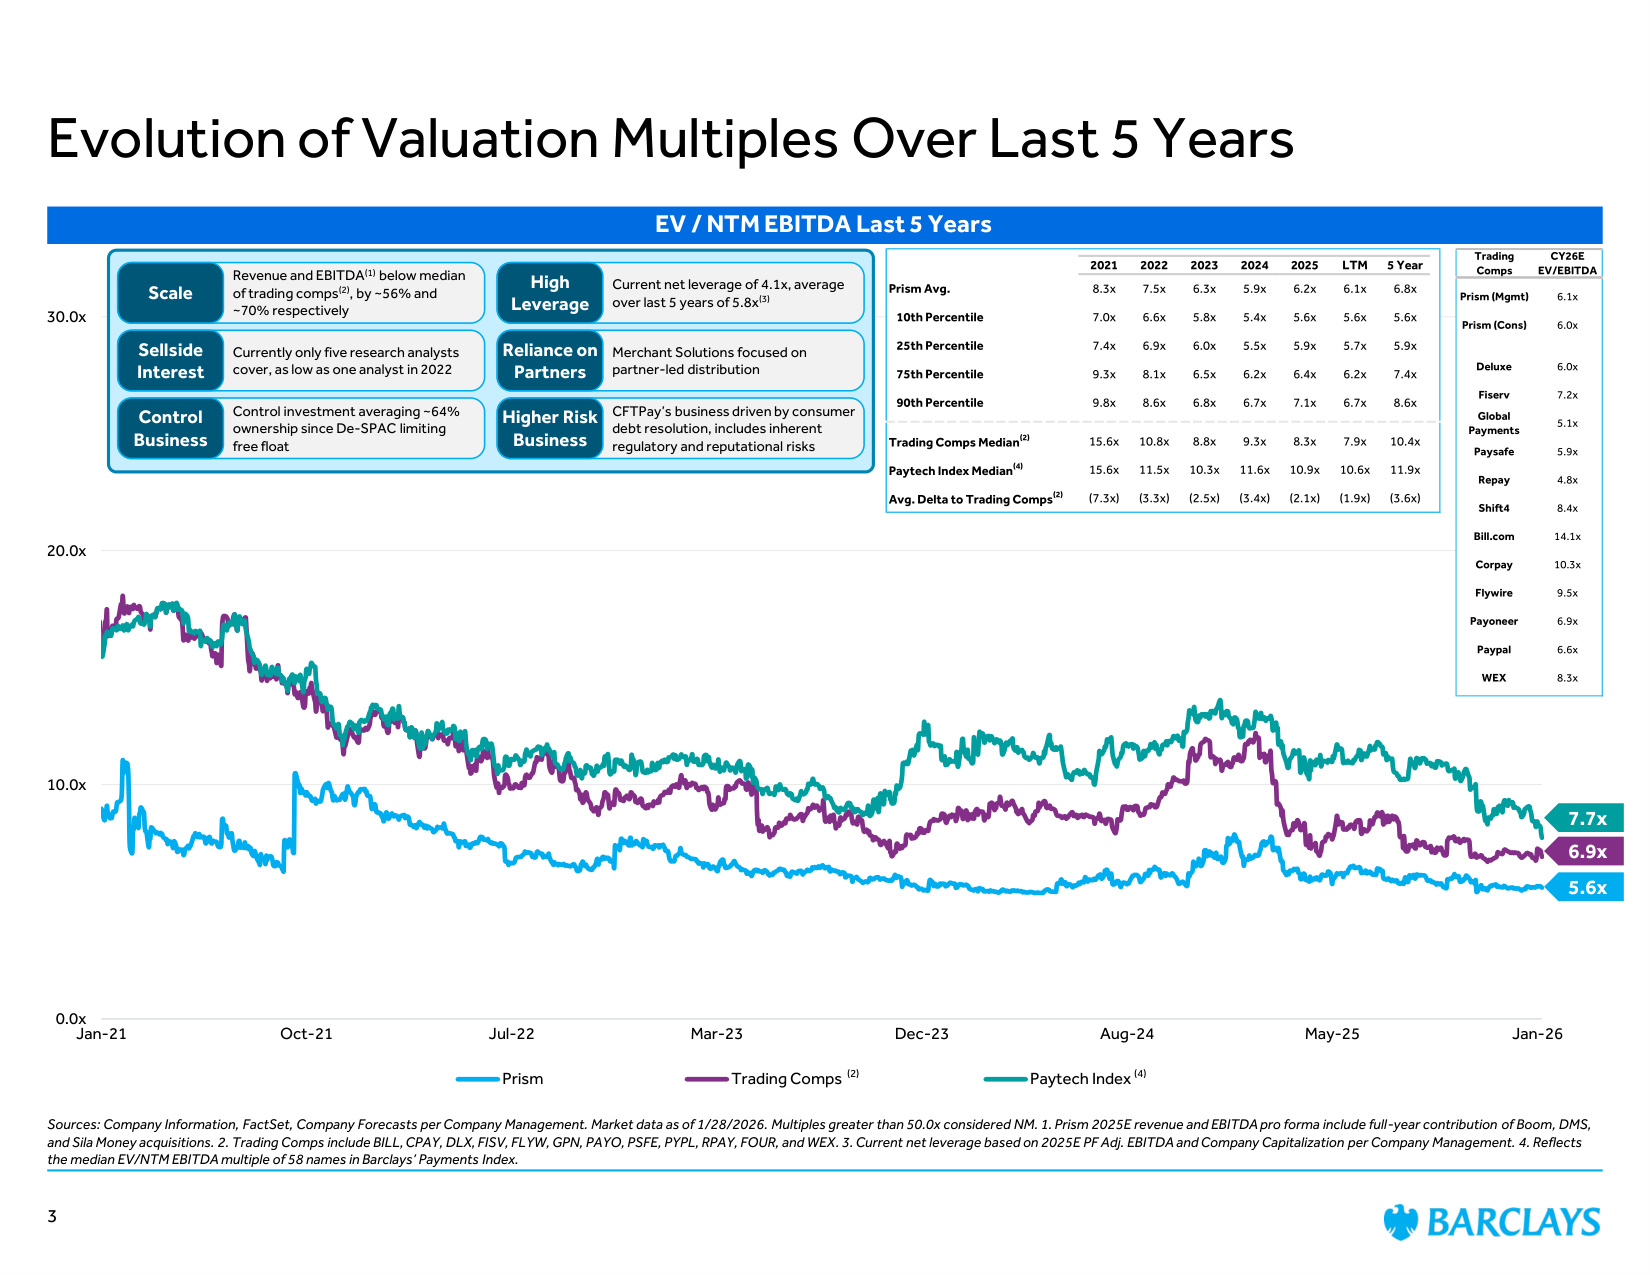
Sources: Company Information, FactSet, Company Forecasts per Company Management. Market data as of 1/28/2026. Multiples greater than 50.0x considered NM. 1. Prism 2025E revenue and EBITDA pro forma include full-year contribution of Boom, DMS, and Sila Money acquisitions. 2. Trading Comps include BILL, CPAY, DLX, FISV, FLYW, GPN, PAYO, PSFE, PYPL, RPAY, FOUR, and WEX. 3. Current net leverage based on 2025E PF Adj. EBITDA and Company Capitalization per Company Management. 4. Reflects the median EV/NTM EBITDA multiple of 58 names in Barclays' Payments Index. Evolution of Valuation Multiples Over Last 5 Years 0.0x 10.0x 20.0x 30.0x Jan-21 Oct-21 Jul-22 Mar-23 Dec-23 Aug-24 May-25 Jan-26 Prism Trading Comps Paytech Index 5.6x (2) EV / NTM EBITDA Last 5 Years 2021 2022 2023 2024 2025 LTM 5 Year Prism Avg. 8.3x 7.5x 6.3x 5.9x 6.2x 6.1x 6.8x 10th Percentile 7.0x 6.6x 5.8x 5.4x 5.6x 5.6x 5.6x 25th Percentile 7.4x 6.9x 6.0x 5.5x 5.9x 5.7x 5.9x 75th Percentile 9.3x 8.1x 6.5x 6.2x 6.4x 6.2x 7.4x 90th Percentile 9.8x 8.6x 6.8x 6.7x 7.1x 6.7x 8.6x Trading Comps Median(2) 15.6x 10.8x 8.8x 9.3x 8.3x 7.9x 10.4x Paytech Index Median(4) 15.6x 11.5x 10.3x 11.6x 10.9x 10.6x 11.9x Avg. Delta to Trading Comps(2) (7.3x) (3.3x) (2.5x) (3.4x) (2.1x) (1.9x) (3.6x) 6.9x Control investment averaging ~64% ownership since De-SPAC limiting free float Control Business Current net leverage of 4.1x, average over last 5 years of 5.8x(3) High Leverage Currently only five research analysts cover, as low as one analyst in 2022 Sellside Interest Merchant Solutions focused on partner-led distribution Reliance on Partners 7.7x (4) Revenue and EBITDA(1) below median of trading comps(2), by ~56% and ~70% respectively Scale CFTPay's business driven by consumer debt resolution, includes inherent regulatory and reputational risks Higher Risk Business 3 Trading CY26E Comps EV/EBITDA Prism (Mgmt) 6.1x Prism (Cons) 6.0x Deluxe 6.0x Fiserv 7.2x Global Payments 5.1x Paysafe 5.9x Repay 4.8x Shift4 8.4x Bill.com 14.1x Corpay 10.3x Flywire 9.5x Payoneer 6.9x Paypal 6.6x WEX 8.3x
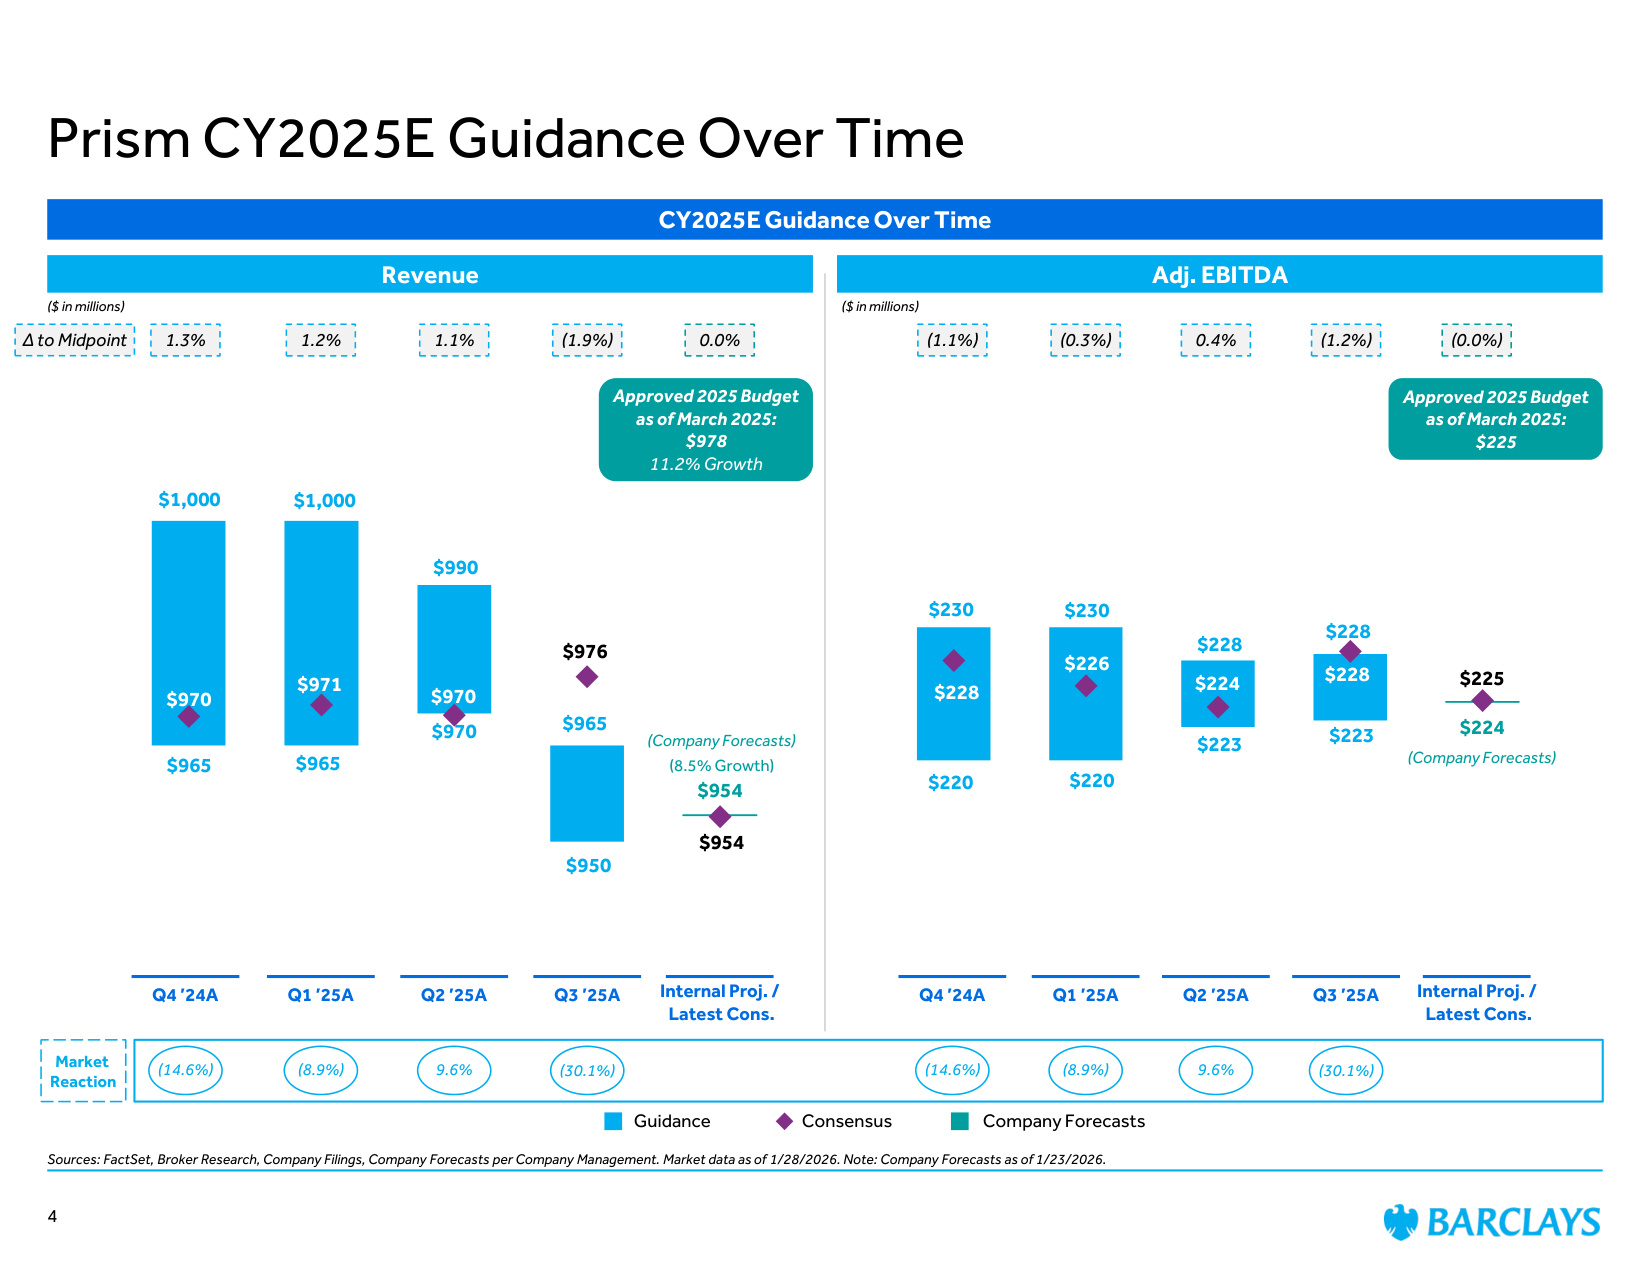
$220 $220 $223 $223 $228 $226 $224 $228 $225 $230 $230 $228 $228 $224 $965 $965 $970 $950 $970 $971 $970 $976 $954 $1,000 $1,000 $990 $965 $954 CY2025E Guidance Over Time Revenue Adj. EBITDA Consensus ($ in millions) ($ in millions) 1.1% 1.2% 1.3% ∆ to Midpoint (1.9%) Q4 '24A Q1 '25A Q3 '25A Q2 '25A Internal Proj. / Latest Cons. Market Reaction (14.6%) (8.9%) 9.6% (30.1%) Company Forecasts Guidance Prism CY2025E Guidance Over Time Sources: FactSet, Broker Research, Company Filings, Company Forecasts per Company Management. Market data as of 1/28/2026. Note: Company Forecasts as of 1/23/2026. 4 (1.1%) (0.3%) 0.4% (1.2%) 0.0% Q4 '24A Q1 '25A Q3 '25A Q2 '25A Internal Proj. / Latest Cons. (0.0%) (30.1%) 9.6% (8.9%) (14.6%) (Company Forecasts) (Company Forecasts) Approved 2025 Budget as of March 2025: $978 11.2% Growth Approved 2025 Budget as of March 2025: $225 (8.5% Growth)
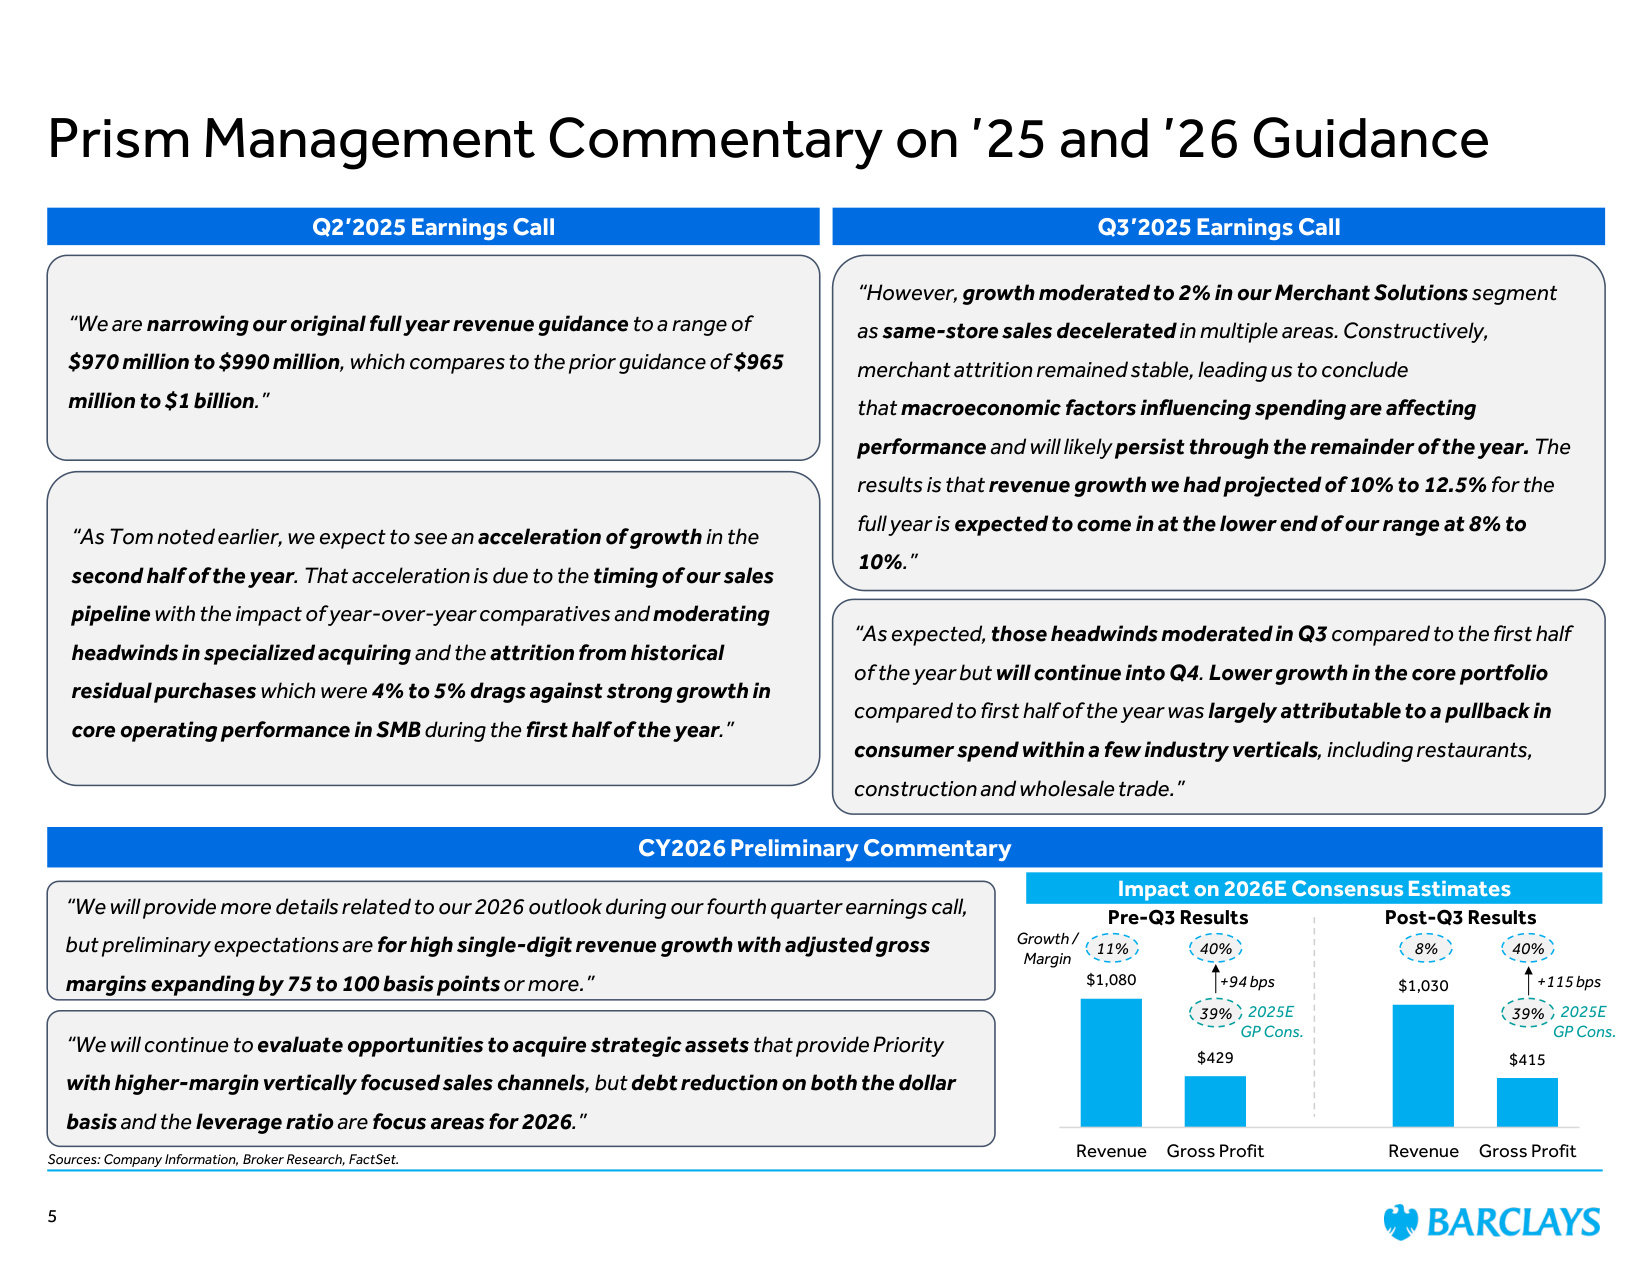
Prism Management Commentary on '25 and '26 Guidance 5 Q2'2025 Earnings Call Q3'2025 Earnings Call CY2026 Preliminary Commentary "We are narrowing our original full year revenue guidance to a range of $970 million to $990 million, which compares to the prior guidance of $965 million to $1 billion." "As Tom noted earlier, we expect to see an acceleration of growth in the second half of the year. That acceleration is due to the timing of our sales pipeline with the impact of year-over-year comparatives and moderating headwinds in specialized acquiring and the attrition from historical residual purchases which were 4% to 5% drags against strong growth in core operating performance in SMB during the first half of the year." "However,growth moderated to 2% in our Merchant Solutions segment as same-store sales decelerated in multiple areas. Constructively, merchant attrition remained stable, leading us to conclude that macroeconomic factors influencing spending are affecting performance and will likely persist through the remainder of the year. The results is that revenue growth we had projected of 10% to 12.5% for the full year is expected to come in at the lower end of our range at 8% to 10%." "As expected, those headwinds moderated in Q3 compared to the first half of the year but will continue into Q4. Lower growth in the core portfolio compared to first half of the year was largely attributable to a pullback in consumer spend within a few industry verticals, including restaurants, construction and wholesale trade." "We will continue to evaluate opportunities to acquire strategic assets that provide Priority with higher-margin vertically focused sales channels, but debt reduction on both the dollar basis and the leverage ratio are focus areas for 2026." Sources: Company Information, Broker Research, FactSet. "We will provide more details related to our 2026 outlook during our fourth quarter earnings call, but preliminary expectations are for high single-digit revenue growth with adjusted gross margins expanding by 75 to 100 basis points or more." $1,080 $429 $1,030 $415 Revenue Gross Profit Revenue Gross Profit Impact on 2026E Consensus Estimates Pre-Q3 Results Post-Q3 Results 11% 40% 8% 40% Growth / Margin 39% 39% 2025E GP Cons. +94 bps 2025E GP Cons. +115 bps
Review of Company Financials & Forecasts
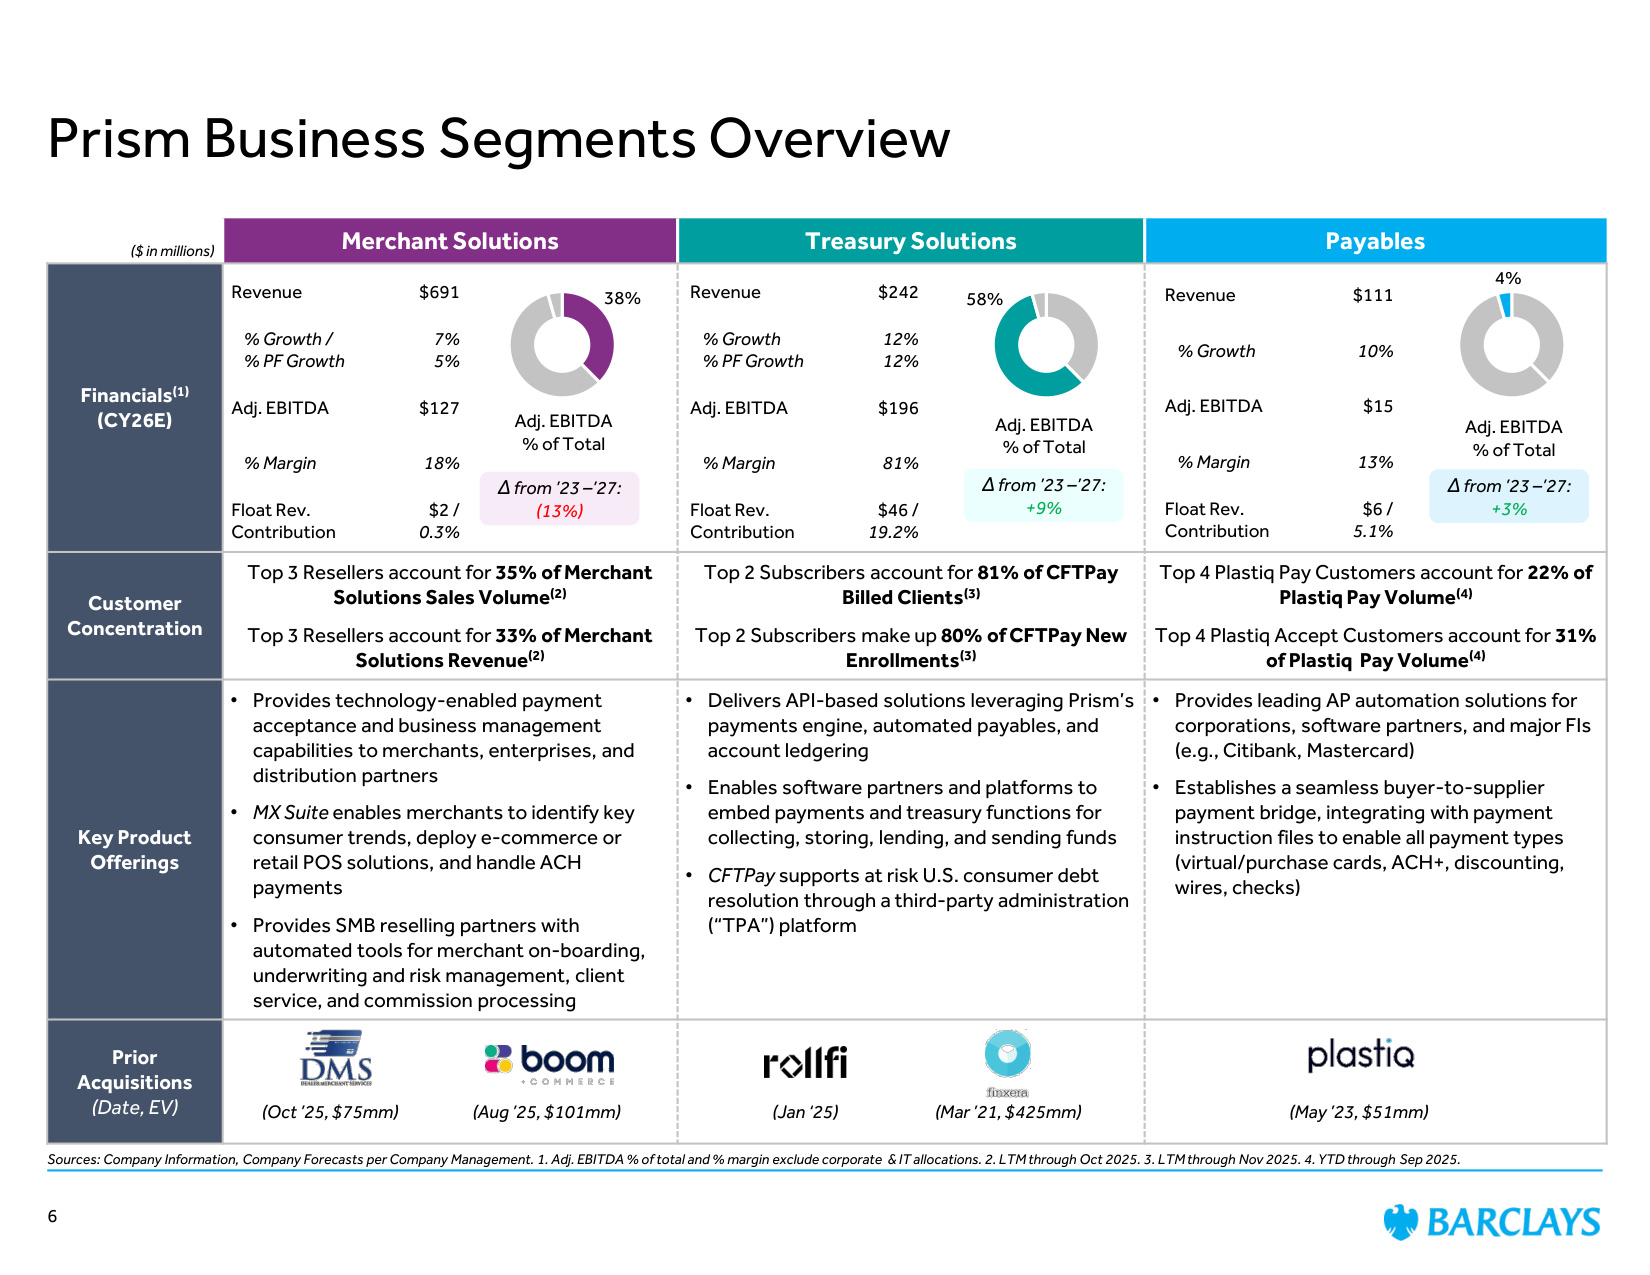
Prism Business Segments Overview Sources: Company Information, Company Forecasts per Company Management. 1. Adj. EBITDA % of total and % margin exclude corporate & IT allocations. 2. LTM through Oct 2025. 3. LTM through Nov 2025. 4. YTD through Sep 2025. Merchant Solutions Treasury Solutions Payables Financials(1) (CY26E) Customer Concentration Top 3 Resellers account for 35% of Merchant Solutions Sales Volume(2) Top 3 Resellers account for 33% of Merchant Solutions Revenue(2) Top 2 Subscribers account for 81% of CFTPay Billed Clients(3) Top 2 Subscribers make up 80% of CFTPay New Enrollments(3) Top 4 Plastiq Pay Customers account for 22% of Plastiq Pay Volume(4) Top 4 Plastiq Accept Customers account for 31% of Plastiq Pay Volume(4) Key Product Offerings • Provides technology-enabled payment acceptance and business management capabilities to merchants, enterprises, and distribution partners • MX Suite enables merchants to identify key consumer trends, deploy e-commerce or retail POS solutions, and handle ACH payments • Provides SMB reselling partners with automated tools for merchant on-boarding, underwriting and risk management, client service, and commission processing • Delivers API-based solutions leveraging Prism's payments engine, automated payables, and account ledgering • Enables software partners and platforms to embed payments and treasury functions for collecting, storing, lending, and sending funds • CFTPay supports at risk U.S. consumer debt resolution through a third-party administration ("TPA") platform • Provides leading AP automation solutions for corporations, software partners, and major FIs (e.g., Citibank, Mastercard) • Establishes a seamless buyer-to-supplier payment bridge, integrating with payment instruction files to enable all payment types (virtual/purchase cards, ACH+, discounting, wires, checks) Prior Acquisitions (Date, EV) ($ in millions) 6 (Oct '25, $75mm) (Aug '25, $101mm) (Jan '25) (Mar '21, $425mm) (May '23, $51mm) 38% 58% 4% Adj. EBITDA % of Total Adj. EBITDA % of Total Adj. EBITDA % of Total Revenue $691 % Growth / % PF Growth 7% 5% Adj. EBITDA $127 % Margin 18% Float Rev. Contribution $2 / 0.3% Revenue $242 % Growth % PF Growth 12% 12% Adj. EBITDA $196 % Margin 81% Float Rev. Contribution $46 / 19.2% Revenue $111 % Growth 10% Adj. EBITDA $15 % Margin 13% Float Rev. Contribution $6 / 5.1% Δ from '23 –'27: (13%) Δ from '23 –'27: +9% Δ from '23 –'27: +3%
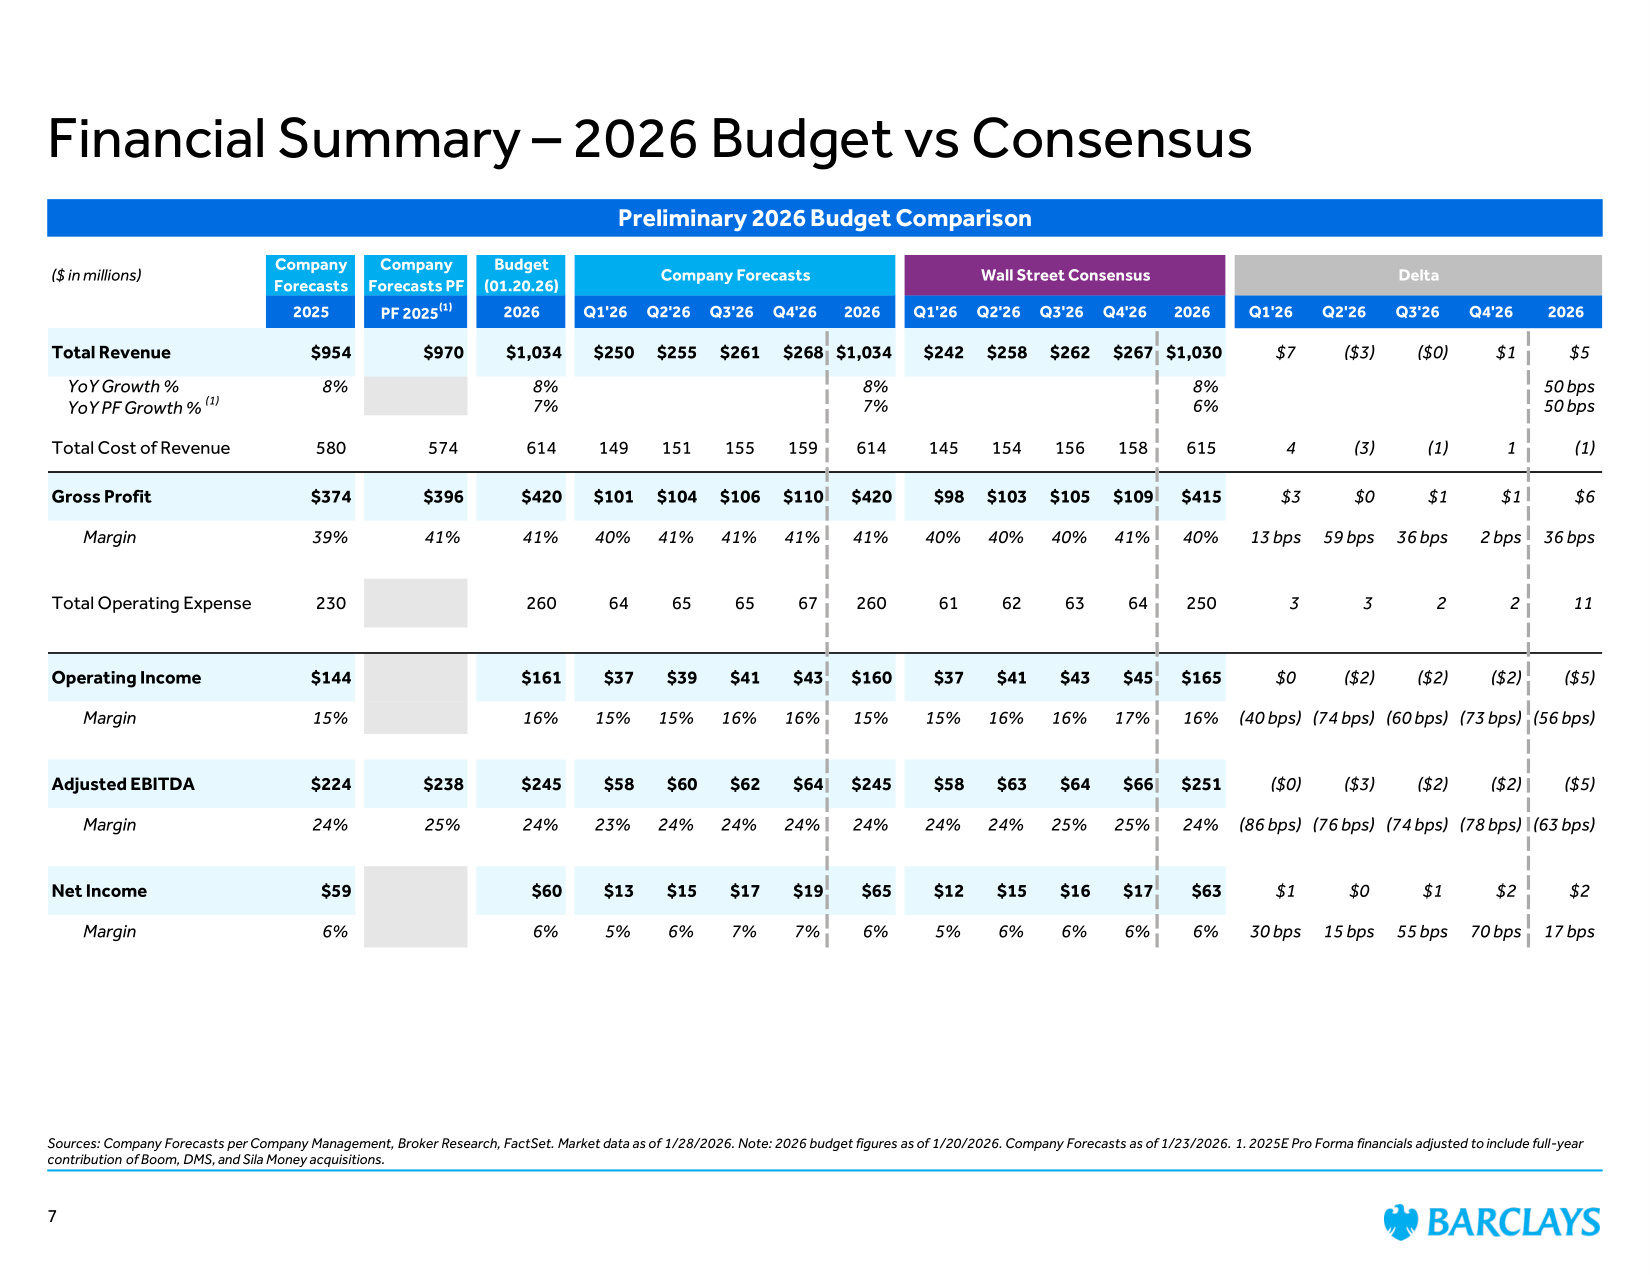
Preliminary 2026 Budget Comparison ($ in millions) Company Forecasts Company Forecasts PF Budget (01.20.26) Company Forecasts Wall Street Consensus Delta 2025 PF 2025(1) 2026 Q1'26 Q2'26 Q3'26 Q4'26 2026 Q1'26 Q2'26 Q3'26 Q4'26 2026 Q1'26 Q2'26 Q3'26 Q4'26 2026 Total Revenue $954 $970 $1,034 $250 $255 $261 $268 $1,034 $242 $258 $262 $267 $1,030 $7 ($3) ($0) $1 $5 YoY Growth % 8% 8% 8% 8% 50 bps YoY PF Growth % (1) 7% 7% 6% 50 bps Total Cost of Revenue 580 574 614 149 151 155 159 614 145 154 156 158 615 4 (3) (1) 1 (1) Gross Profit $374 $396 $420 $101 $104 $106 $110 $420 $98 $103 $105 $109 $415 $3 $0 $1 $1 $6 Margin 39% 41% 41% 40% 41% 41% 41% 41% 40% 40% 40% 41% 40% 13 bps 59 bps 36 bps 2 bps 36 bps Total Operating Expense 230 260 64 65 65 67 260 61 62 63 64 250 3 3 2 2 11 Operating Income $144 $161 $37 $39 $41 $43 $160 $37 $41 $43 $45 $165 $0 ($2) ($2) ($2) ($5) Margin 15% 16% 15% 15% 16% 16% 15% 15% 16% 16% 17% 16% (40 bps) (74 bps) (60 bps) (73 bps) (56 bps) Adjusted EBITDA $224 $238 $245 $58 $60 $62 $64 $245 $58 $63 $64 $66 $251 ($0) ($3) ($2) ($2) ($5) Margin 24% 25% 24% 23% 24% 24% 24% 24% 24% 24% 25% 25% 24% (86 bps) (76 bps) (74 bps) (78 bps) (63 bps) Net Income $59 $60 $13 $15 $17 $19 $65 $12 $15 $16 $17 $63 $1 $0 $1 $2 $2 Margin 6% 6% 5% 6% 7% 7% 6% 5% 6% 6% 6% 6% 30 bps 15 bps 55 bps 70 bps 17 bps Financial Summary – 2026 Budget vs Consensus Sources: Company Forecasts per Company Management, Broker Research, FactSet. Market data as of 1/28/2026. Note: 2026 budget figures as of 1/20/2026. Company Forecasts as of 1/23/2026. 1. 2025E Pro Forma financials adjusted to include full-year contribution of Boom, DMS, and Sila Money acquisitions. 7
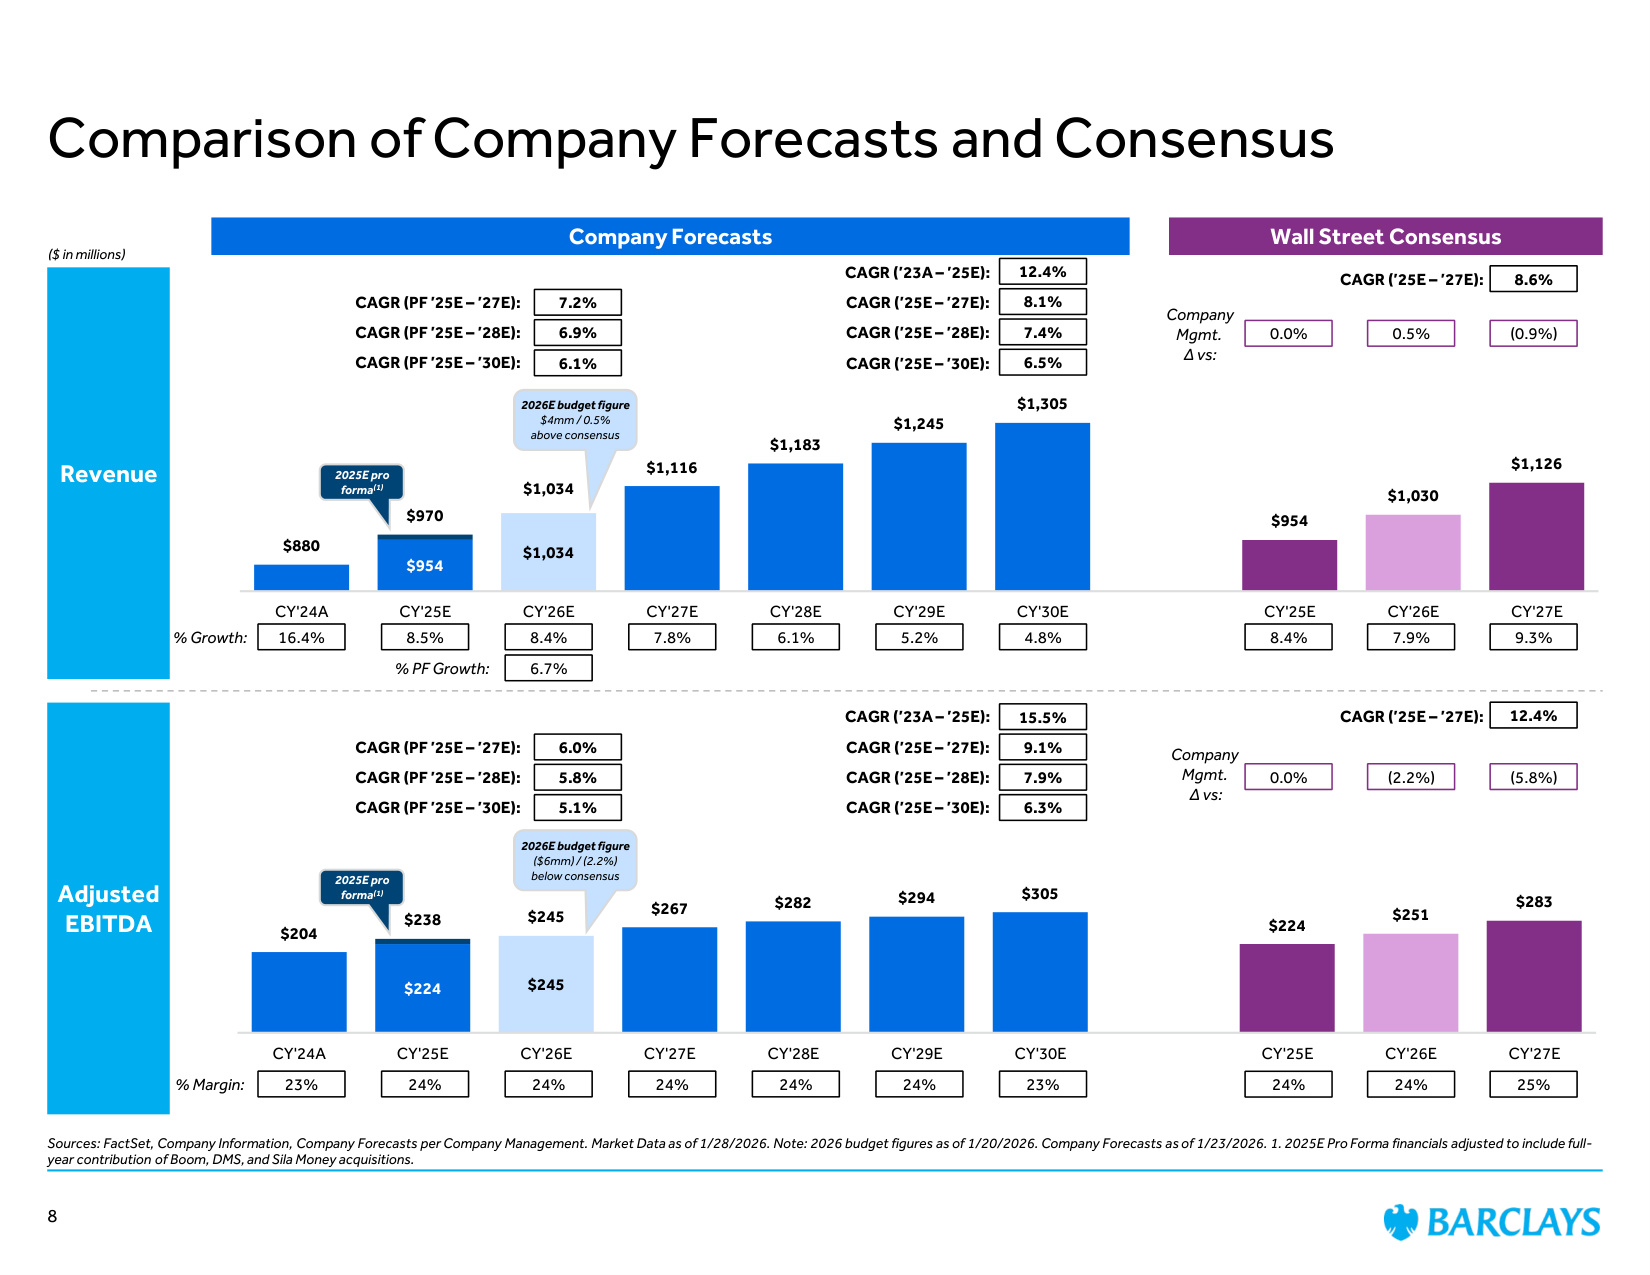
$954 $1,034 $880 $1,116 $1,183 $1,245 $1,305 $954 $1,030 $1,126 $970 $1,034 CY'24A CY'25E CY'26E CY'27E CY'28E CY'29E CY'30E CY'25E CY'26E CY'27E $224 $245 $204 $267 $282 $294 $305 $224 $251 $283 $238 $245 CY'24A CY'25E CY'26E CY'27E CY'28E CY'29E CY'30E CY'25E CY'26E CY'27E Revenue ($ in millions) Adjusted EBITDA % Growth: % Margin: 4.8% 24% 23% 24% 7.8% 6.1% 24% 24% 24% Company Forecasts Wall Street Consensus 8.6% CAGR ('25E – '27E): 25% 7.9% 9.3% 8.4% 8.4% 12.4% CAGR ('25E – '27E): 8.5% 23% 5.2% 24% Comparison of Company Forecasts and Consensus Sources: FactSet, Company Information, Company Forecasts per Company Management. Market Data as of 1/28/2026. Note: 2026 budget figures as of 1/20/2026. Company Forecasts as of 1/23/2026. 1. 2025E Pro Forma financials adjusted to include full- year contribution of Boom, DMS, and Sila Money acquisitions. 2026E budget figure $4mm / 0.5% above consensus 2026E budget figure ($6mm) / (2.2%) below consensus 16.4% 24% 12.4% 8.1% 7.4% 6.5% 15.5% 9.1% CAGR ('23A – '25E): CAGR ('25E – '27E): CAGR ('25E – '28E): CAGR ('25E – '30E): 7.9% 6.3% 0.0% 0.5% (0.9%) 0.0% (2.2%) (5.8%) Company Mgmt. Δ vs: Company Mgmt. Δ vs: 2025E pro forma(1) % PF Growth: 6.7% 7.2% CAGR (PF '25E – '27E): CAGR (PF '25E – '28E): CAGR (PF '25E – '30E): 6.9% 6.1% 6.0% CAGR (PF '25E – '27E): CAGR (PF '25E – '28E): CAGR (PF '25E – '30E): 5.8% 5.1% 2025E pro forma(1) CAGR ('23A – '25E): CAGR ('25E – '27E): CAGR ('25E – '28E): CAGR ('25E – '30E): 8
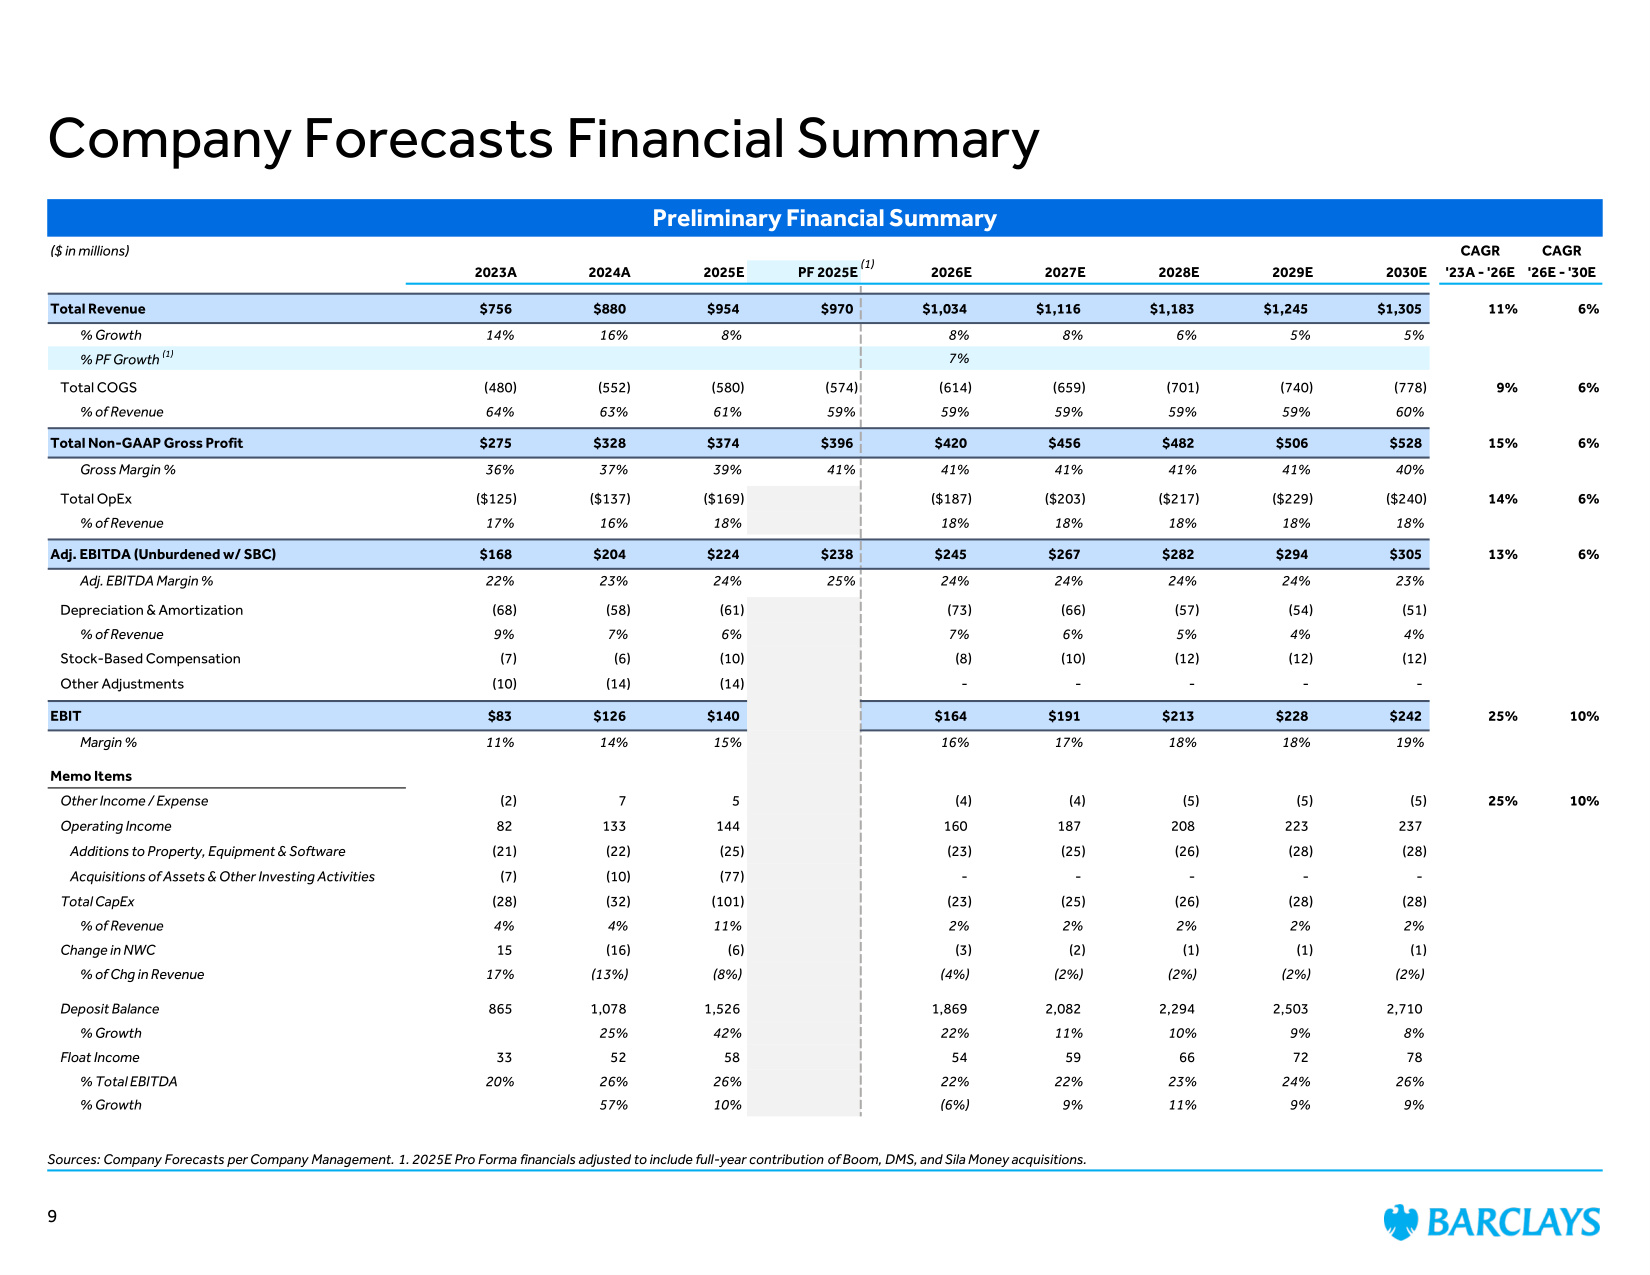
Preliminary Financial Summary ($ in millions) CAGR CAGR 2023A 2024A 2025E PF 2025E 2026E 2027E 2028E 2029E 2030E '23A - '26E '26E - '30E Total Revenue $756 $880 $954 $970 $1,034 $1,116 $1,183 $1,245 $1,305 11% 6% % Growth 14% 16% 8% 8% 8% 6% 5% 5% % PF Growth (1) 7% Total COGS (480) (552) (580) (574) (614) (659) (701) (740) (778) 9% 6% % of Revenue 64% 63% 61% 59% 59% 59% 59% 59% 60% Total Non-GAAP Gross Profit $275 $328 $374 $396 $420 $456 $482 $506 $528 15% 6% Gross Margin % 36% 37% 39% 41% 41% 41% 41% 41% 40% Total OpEx ($125) ($137) ($169) ($187) ($203) ($217) ($229) ($240) 14% 6% % of Revenue 17% 16% 18% 18% 18% 18% 18% 18% Adj. EBITDA (Unburdened w/ SBC) $168 $204 $224 $238 $245 $267 $282 $294 $305 13% 6% Adj. EBITDA Margin % 22% 23% 24% 25% 24% 24% 24% 24% 23% Depreciation & Amortization (68) (58) (61) (73) (66) (57) (54) (51) % of Revenue 9% 7% 6% 7% 6% 5% 4% 4% Stock-Based Compensation (7) (6) (10) (8) (10) (12) (12) (12) Other Adjustments (10) (14) (14) - - - - - EBIT $83 $126 $140 $164 $191 $213 $228 $242 25% 10% Margin % 11% 14% 15% 16% 17% 18% 18% 19% Memo Items Other Income / Expense (2) 7 5 (4) (4) (5) (5) (5) 25% 10% Operating Income 82 133 144 160 187 208 223 237 Additions to Property, Equipment & Software (21) (22) (25) (23) (25) (26) (28) (28) Acquisitions of Assets & Other Investing Activities (7) (10) (77) - - - - - Total CapEx (28) (32) (101) (23) (25) (26) (28) (28) % of Revenue 4% 4% 11% 2% 2% 2% 2% 2% Change in NWC 15 (16) (6) (3) (2) (1) (1) (1) % of Chg in Revenue 17% (13%) (8%) (4%) (2%) (2%) (2%) (2%) Deposit Balance 865 1,078 1,526 1,869 2,082 2,294 2,503 2,710 % Growth 25% 42% 22% 11% 10% 9% 8% Float Income 33 52 58 54 59 66 72 78 % Total EBITDA 20% 26% 26% 22% 22% 23% 24% 26% % Growth 57% 10% (6%) 9% 11% 9% 9% Company Forecasts Financial Summary Sources: Company Forecasts per Company Management. 1. 2025E Pro Forma financials adjusted to include full-year contribution of Boom, DMS, and Sila Money acquisitions. 9 (1)
Preliminary Valuation Perspectives
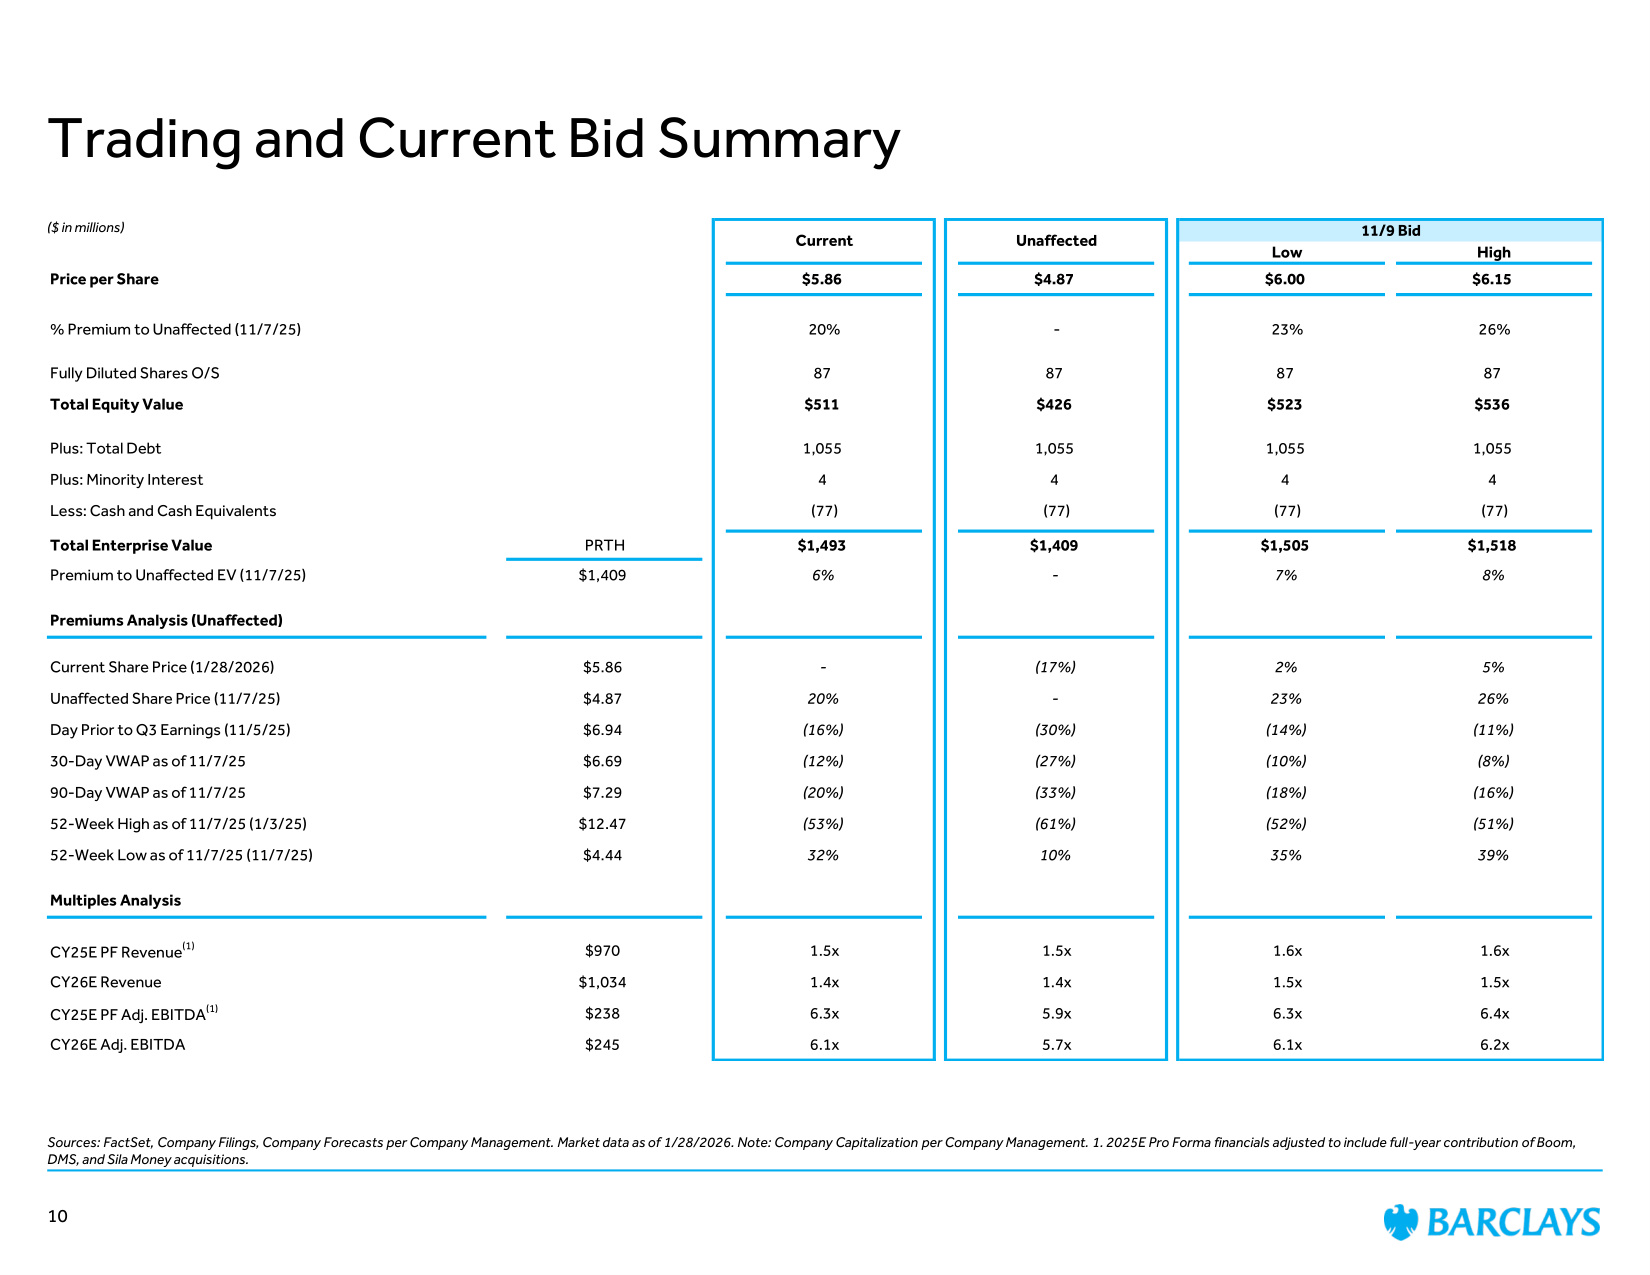
Trading and Current Bid Summary Sources: FactSet, Company Filings, Company Forecasts per Company Management. Market data as of 1/28/2026. Note: Company Capitalization per Company Management. 1. 2025E Pro Forma financials adjusted to include full-year contribution of Boom, DMS, and Sila Money acquisitions. 11/9 Bid Low High Price per Share $5.86 $4.87 $6.00 $6.15 % Premium to Unaffected (11/7/25) 20% - 23% 26% Fully Diluted Shares O/S 87 87 87 87 Total Equity Value $511 $426 $523 $536 Plus: Total Debt 1,055 1,055 1,055 1,055 Plus: Minority Interest 4 4 4 4 Less: Cash and Cash Equivalents (77) (77) (77) (77) Total Enterprise Value PRTH $1,493 $1,409 $1,505 $1,518 Premium to Unaffected EV (11/7/25) $1,409 6% - 7% 8% Premiums Analysis (Unaffected) Current Share Price (1/28/2026) $5.86 - (17%) 2% 5% Unaffected Share Price (11/7/25) $4.87 20% - 23% 26% Day Prior to Q3 Earnings (11/5/25) $6.94 (16%) (30%) (14%) (11%) 30-Day VWAP as of 11/7/25 $6.69 (12%) (27%) (10%) (8%) 90-Day VWAP as of 11/7/25 $7.29 (20%) (33%) (18%) (16%) 52-Week High as of 11/7/25 (1/3/25) $12.47 (53%) (61%) (52%) (51%) 52-Week Low as of 11/7/25 (11/7/25) $4.44 32% 10% 35% 39% Multiples Analysis CY25E PF Revenue(1) $970 1.5x 1.5x 1.6x 1.6x CY26E Revenue $1,034 1.4x 1.4x 1.5x 1.5x CY25E PF Adj. EBITDA(1) $238 6.3x 5.9x 6.3x 6.4x CY26E Adj. EBITDA $245 6.1x 5.7x 6.1x 6.2x Current Unaffected ($ in millions) 10
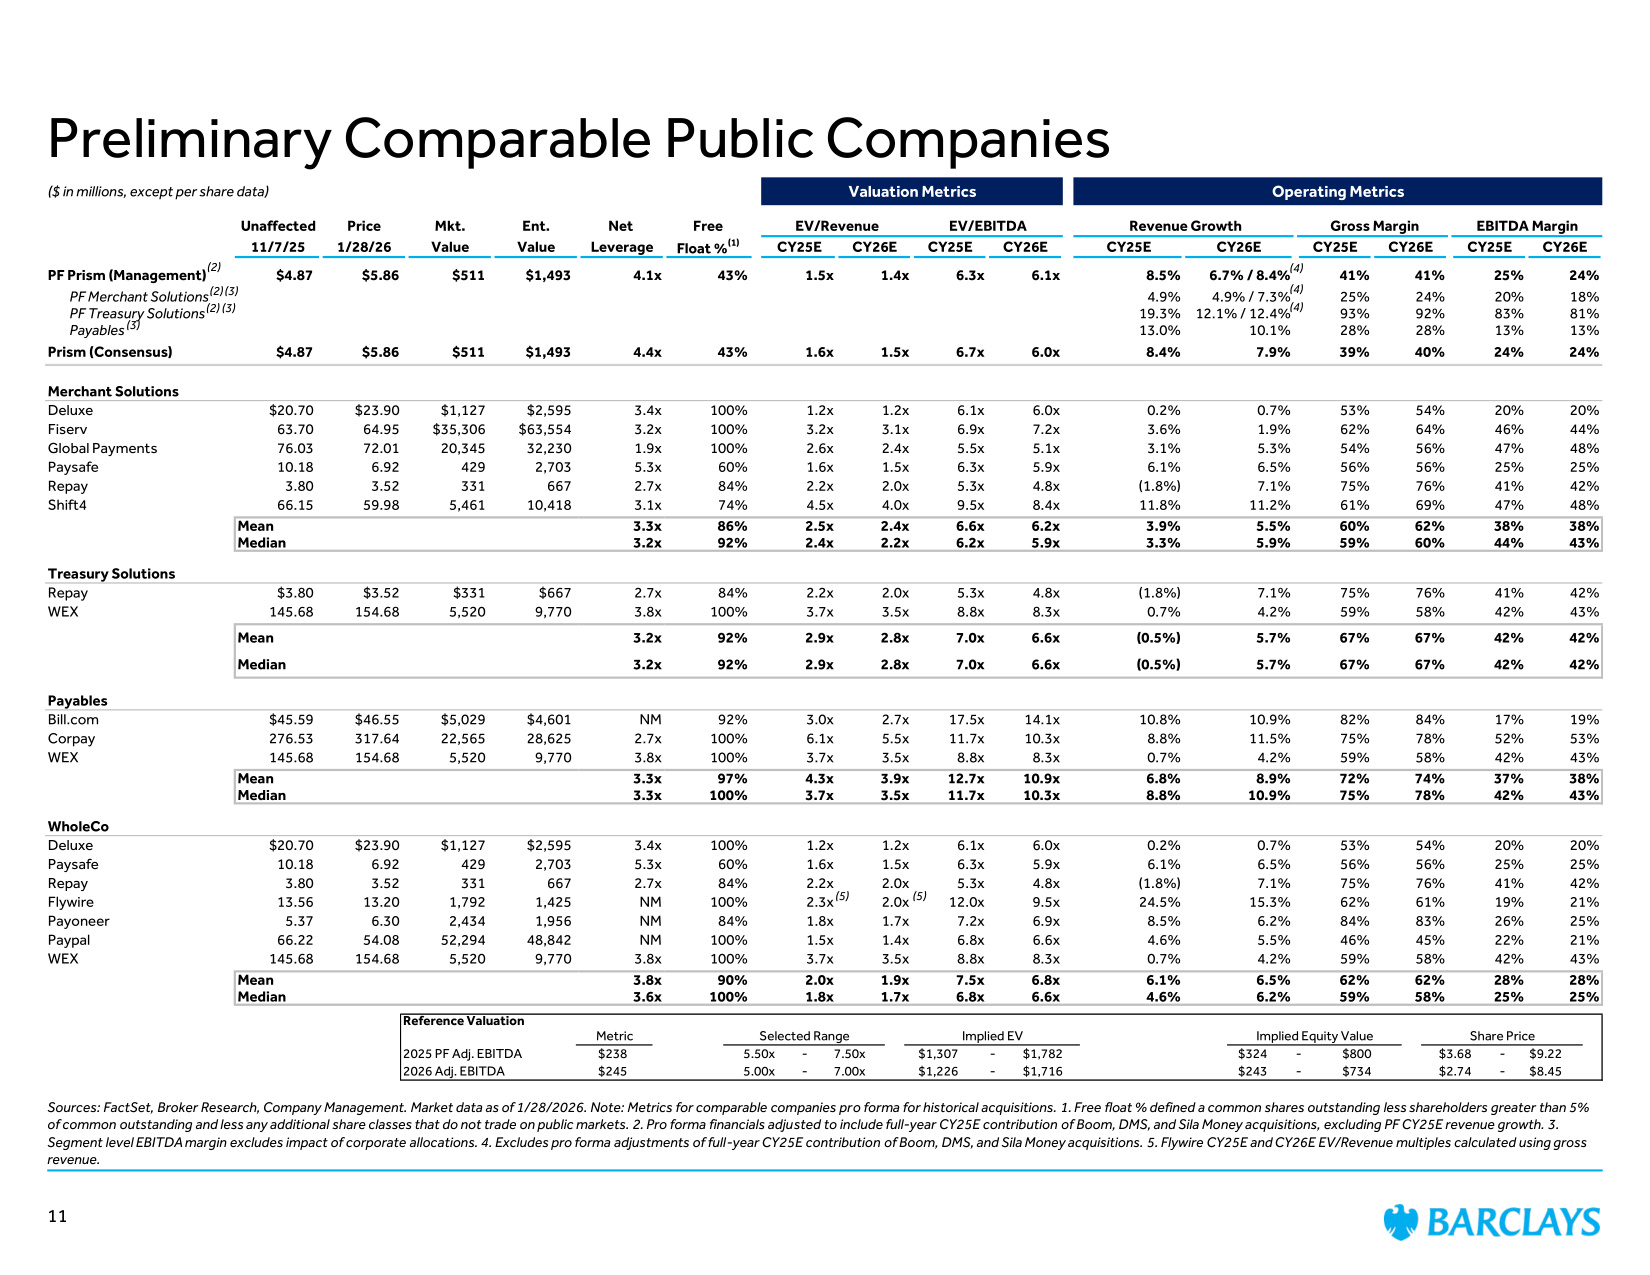
($ in millions, except per share data) Valuation Metrics Operating Metrics Unaffected Price Mkt. Ent. Net Free EV/Revenue EV/EBITDA Revenue Growth Gross Margin EBITDA Margin 11/7/25 1/28/26 Value Value Leverage Float %(1) CY25E CY26E CY25E CY26E CY25E CY26E CY25E CY26E CY25E CY26E PF Prism (Management) $4.87 $5.86 $511 $1,493 4.1x 43% 1.5x 1.4x 6.3x 6.1x 8.5% 6.7% / 8.4% 41% 41% 25% 24% PF Merchant Solutions 4.9% 4.9% / 7.3% 25% 24% 20% 18% PF Treasury Solutions 19.3% 12.1% / 12.4% 93% 92% 83% 81% Payables 13.0% 10.1% 28% 28% 13% 13% Prism (Consensus) $4.87 $5.86 $511 $1,493 4.4x 43% 1.6x 1.5x 6.7x 6.0x 8.4% 7.9% 39% 40% 24% 24% Merchant Solutions Deluxe $20.70 $23.90 $1,127 $2,595 3.4x 100% 1.2x 1.2x 6.1x 6.0x 0.2% 0.7% 53% 54% 20% 20% Fiserv 63.70 64.95 $35,306 $63,554 3.2x 100% 3.2x 3.1x 6.9x 7.2x 3.6% 1.9% 62% 64% 46% 44% Global Payments 76.03 72.01 20,345 32,230 1.9x 100% 2.6x 2.4x 5.5x 5.1x 3.1% 5.3% 54% 56% 47% 48% Paysafe 10.18 6.92 429 2,703 5.3x 60% 1.6x 1.5x 6.3x 5.9x 6.1% 6.5% 56% 56% 25% 25% Repay 3.80 3.52 331 667 2.7x 84% 2.2x 2.0x 5.3x 4.8x (1.8%) 7.1% 75% 76% 41% 42% Shift4 66.15 59.98 5,461 10,418 3.1x 74% 4.5x 4.0x 9.5x 8.4x 11.8% 11.2% 61% 69% 47% 48% Mean 3.3x 86% 2.5x 2.4x 6.6x 6.2x 3.9% 5.5% 60% 62% 38% 38% Median 3.2x 92% 2.4x 2.2x 6.2x 5.9x 3.3% 5.9% 59% 60% 44% 43% Treasury Solutions Repay $3.80 $3.52 $331 $667 2.7x 84% 2.2x 2.0x 5.3x 4.8x (1.8%) 7.1% 75% 76% 41% 42% WEX 145.68 154.68 5,520 9,770 3.8x 100% 3.7x 3.5x 8.8x 8.3x 0.7% 4.2% 59% 58% 42% 43% Mean 3.2x 92% 2.9x 2.8x 7.0x 6.6x (0.5%) 5.7% 67% 67% 42% 42% Median 3.2x 92% 2.9x 2.8x 7.0x 6.6x (0.5%) 5.7% 67% 67% 42% 42% Payables Bill.com $45.59 $46.55 $5,029 $4,601 NM 92% 3.0x 2.7x 17.5x 14.1x 10.8% 10.9% 82% 84% 17% 19% Corpay 276.53 317.64 22,565 28,625 2.7x 100% 6.1x 5.5x 11.7x 10.3x 8.8% 11.5% 75% 78% 52% 53% WEX 145.68 154.68 5,520 9,770 3.8x 100% 3.7x 3.5x 8.8x 8.3x 0.7% 4.2% 59% 58% 42% 43% Mean 3.3x 97% 4.3x 3.9x 12.7x 10.9x 6.8% 8.9% 72% 74% 37% 38% Median 3.3x 100% 3.7x 3.5x 11.7x 10.3x 8.8% 10.9% 75% 78% 42% 43% WholeCo Deluxe $20.70 $23.90 $1,127 $2,595 3.4x 100% 1.2x 1.2x 6.1x 6.0x 0.2% 0.7% 53% 54% 20% 20% Paysafe 10.18 6.92 429 2,703 5.3x 60% 1.6x 1.5x 6.3x 5.9x 6.1% 6.5% 56% 56% 25% 25% Repay 3.80 3.52 331 667 2.7x 84% 2.2x 2.0x 5.3x 4.8x (1.8%) 7.1% 75% 76% 41% 42% Flywire 13.56 13.20 1,792 1,425 NM 100% 2.3x 2.0x 12.0x 9.5x 24.5% 15.3% 62% 61% 19% 21% Payoneer 5.37 6.30 2,434 1,956 NM 84% 1.8x 1.7x 7.2x 6.9x 8.5% 6.2% 84% 83% 26% 25% Paypal 66.22 54.08 52,294 48,842 NM 100% 1.5x 1.4x 6.8x 6.6x 4.6% 5.5% 46% 45% 22% 21% WEX 145.68 154.68 5,520 9,770 3.8x 100% 3.7x 3.5x 8.8x 8.3x 0.7% 4.2% 59% 58% 42% 43% Mean 3.8x 90% 2.0x 1.9x 7.5x 6.8x 6.1% 6.5% 62% 62% 28% 28% Median 3.6x 100% 1.8x 1.7x 6.8x 6.6x 4.6% 6.2% 59% 58% 25% 25% Preliminary Comparable Public Companies Sources: FactSet, Broker Research, Company Management. Market data as of 1/28/2026. Note: Metrics for comparable companies pro forma for historical acquisitions. 1. Free float % defined a common shares outstanding less shareholders greater than 5% of common outstanding and less any additional share classes that do not trade on public markets. 2. Pro forma financials adjusted to include full-year CY25E contribution of Boom, DMS, and Sila Money acquisitions, excluding PF CY25E revenue growth. 3. Segment level EBITDA margin excludes impact of corporate allocations. 4. Excludes pro forma adjustments of full-year CY25E contribution of Boom, DMS, and Sila Money acquisitions. 5. Flywire CY25E and CY26E EV/Revenue multiples calculated using gross revenue. (5) (5) (2) (2) (2) (3) (3) (3) 11 Reference Valuation Metric Selected Range Implied EV Implied Equity Value Share Price 2025 PF Adj. EBITDA $238 5.50x - 7.50x $1,307 - $1,782 $324 - $800 $3.68 - $9.22 2026 Adj. EBITDA $245 5.00x - 7.00x $1,226 - $1,716 $243 - $734 $2.74 - $8.45 (4) (4) (4)
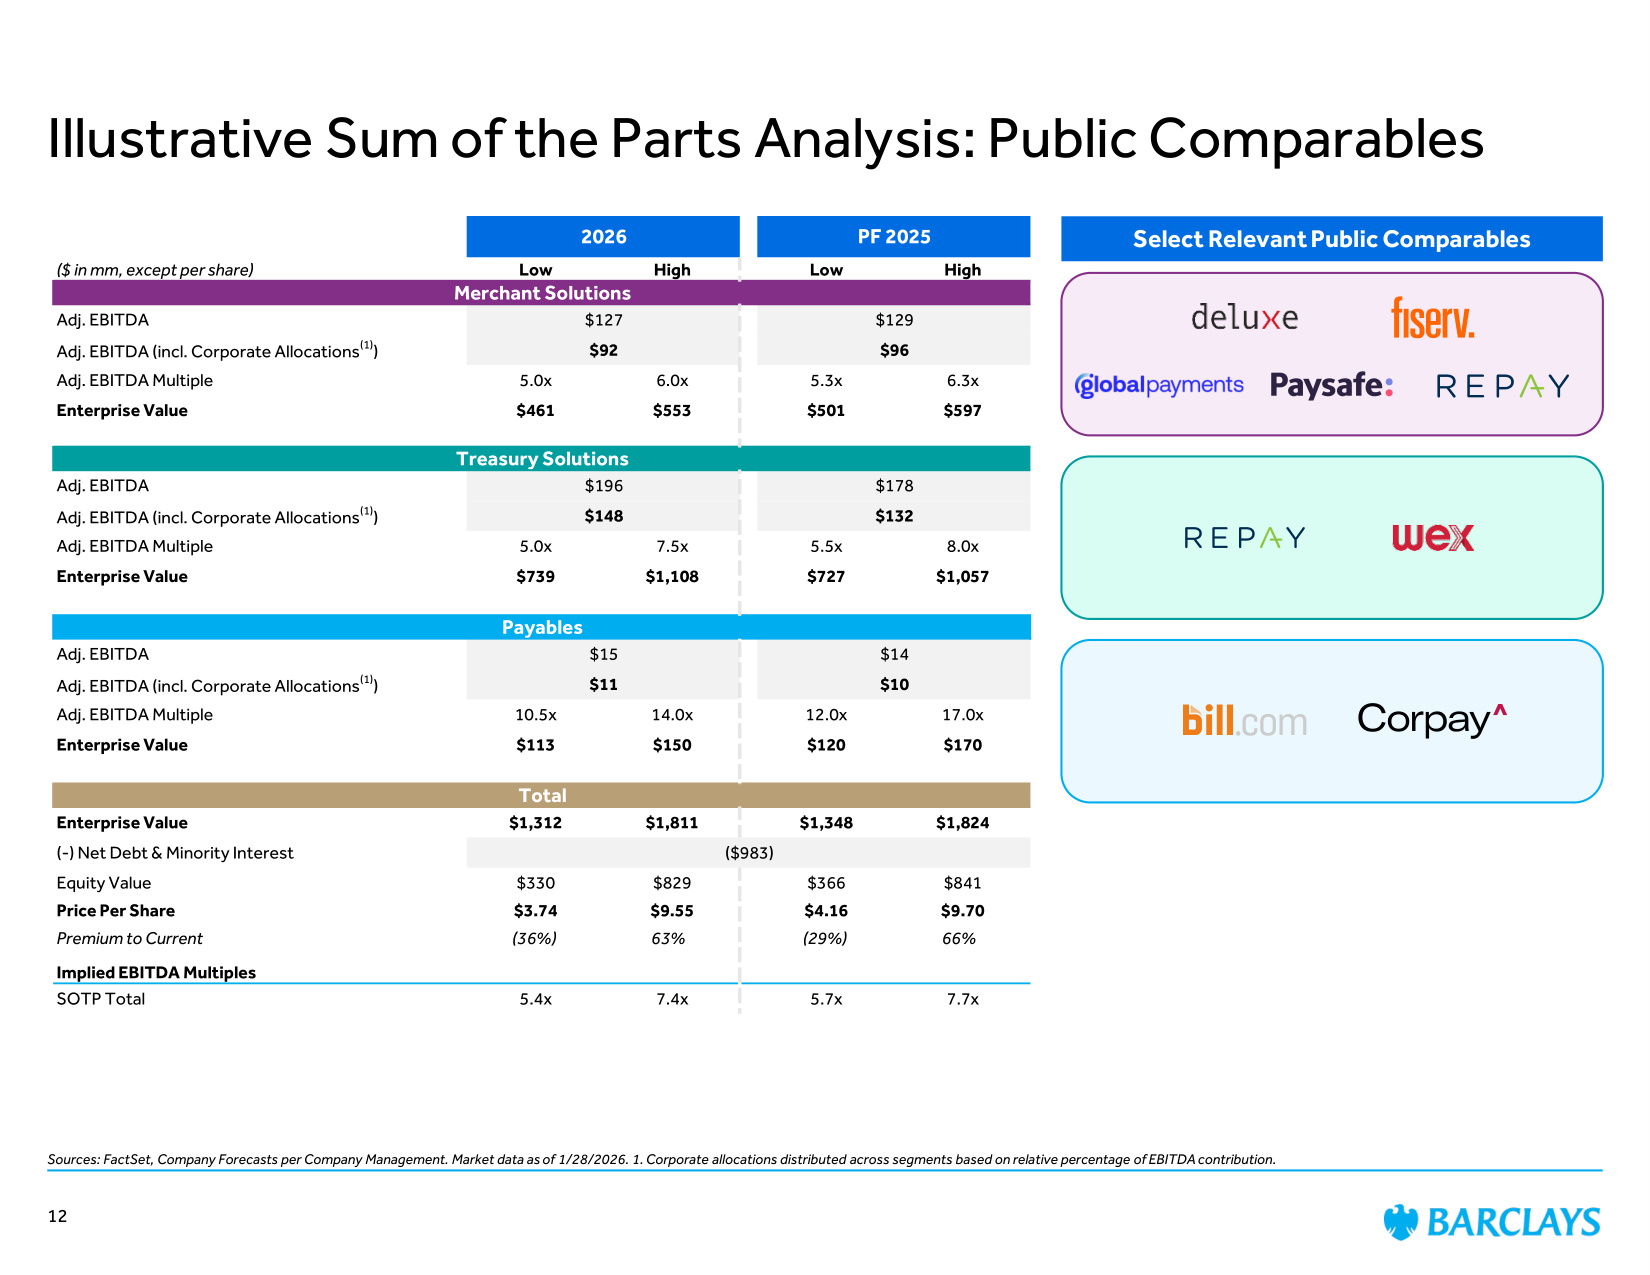
Illustrative Sum of the Parts Analysis: Public Comparables Sources: FactSet, Company Forecasts per Company Management. Market data as of 1/28/2026. 1. Corporate allocations distributed across segments based on relative percentage of EBITDA contribution. Select Relevant Public Comparables 2026 PF 2025 ($ in mm, except per share) Low High Low High Merchant Solutions Adj. EBITDA $127 $129 Adj. EBITDA (incl. Corporate Allocations(1)) $92 $96 Adj. EBITDA Multiple 5.0x 6.0x 5.3x 6.3x Enterprise Value $461 $553 $501 $597 Treasury Solutions Adj. EBITDA $196 $178 Adj. EBITDA (incl. Corporate Allocations(1)) $148 $132 Adj. EBITDA Multiple 5.0x 7.5x 5.5x 8.0x Enterprise Value $739 $1,108 $727 $1,057 Payables Adj. EBITDA $15 $14 Adj. EBITDA (incl. Corporate Allocations(1)) $11 $10 Adj. EBITDA Multiple 10.5x 14.0x 12.0x 17.0x Enterprise Value $113 $150 $120 $170 Total Enterprise Value $1,312 $1,811 $1,348 $1,824 (-) Net Debt & Minority Interest ($983) Equity Value $330 $829 $366 $841 Price Per Share $3.74 $9.55 $4.16 $9.70 Premium to Current (36%) 63% (29%) 66% Implied EBITDA Multiples SOTP Total 5.4x 7.4x 5.7x 7.7x 12
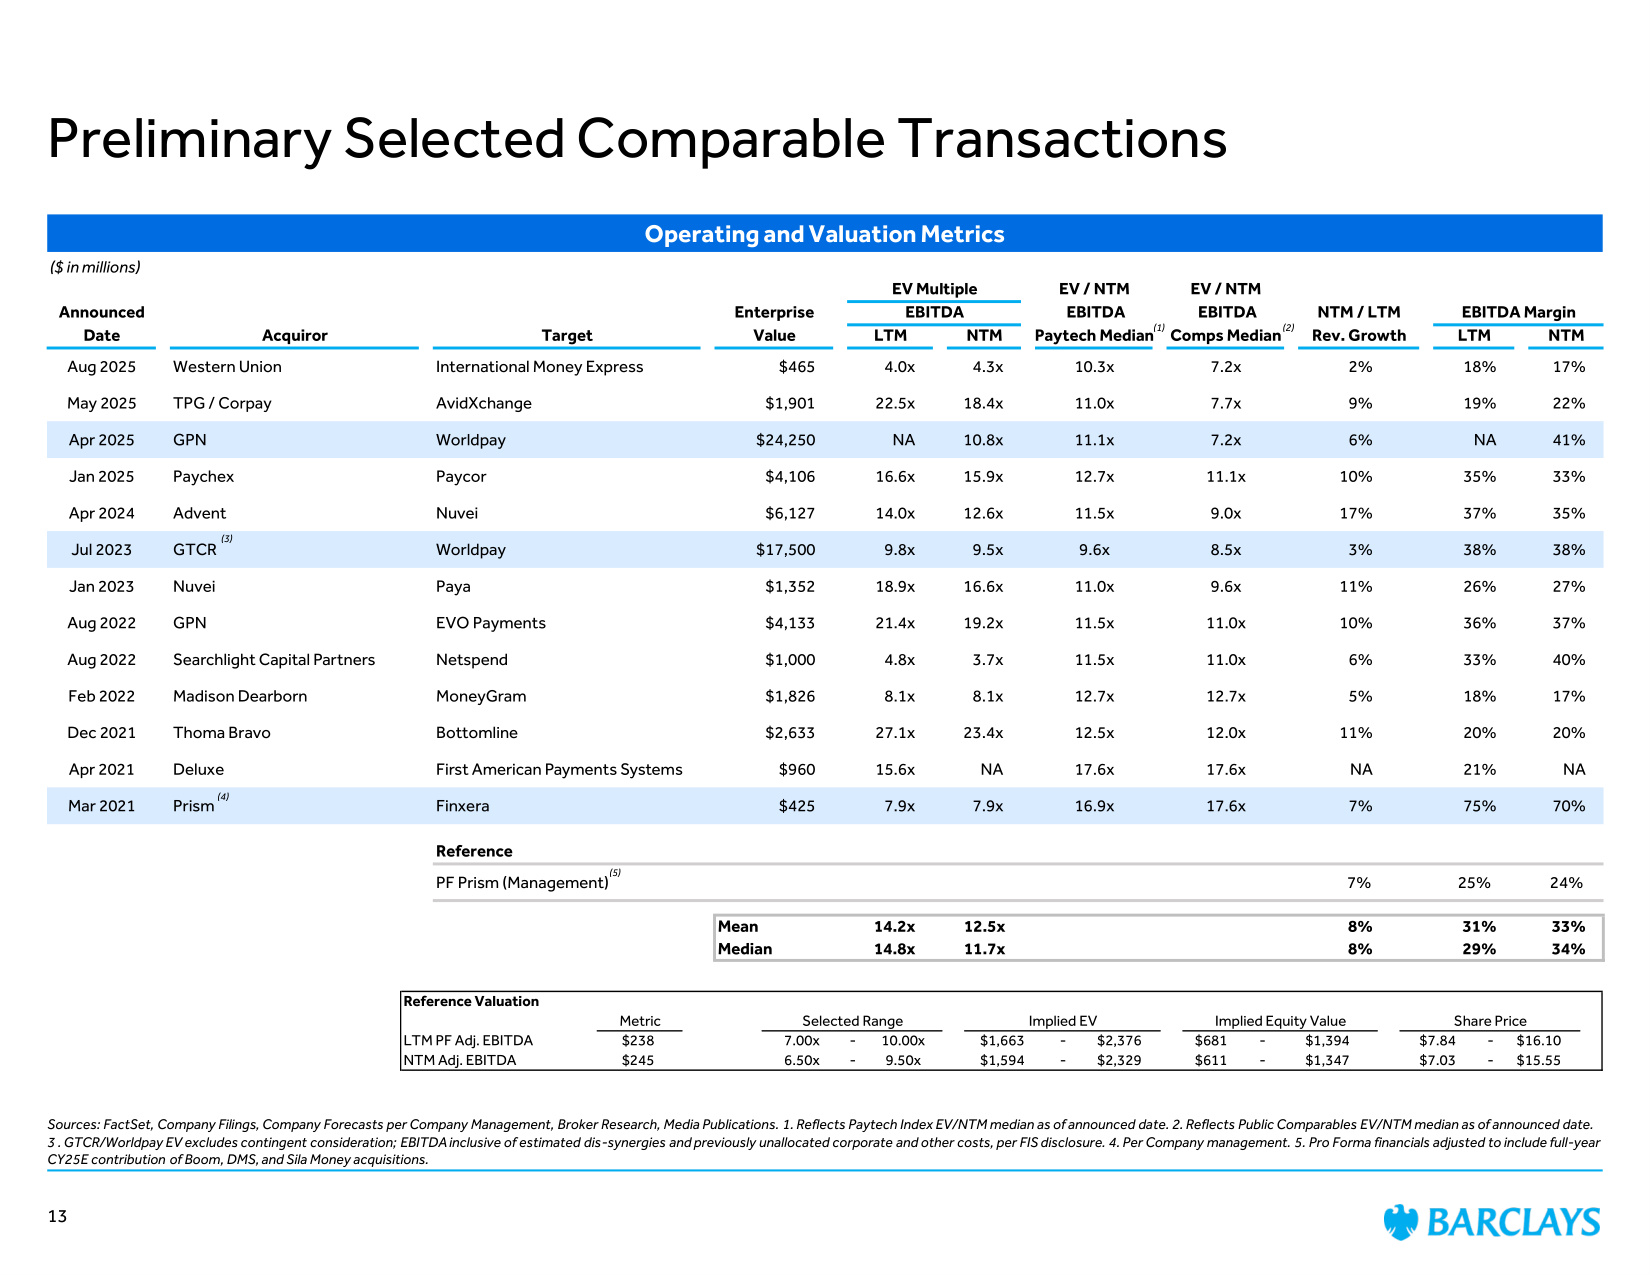
Preliminary Selected Comparable Transactions Sources: FactSet, Company Filings, Company Forecasts per Company Management, Broker Research, Media Publications. 1. Reflects Paytech Index EV/NTM median as of announced date. 2. Reflects Public Comparables EV/NTM median as of announced date. 3 . GTCR/Worldpay EV excludes contingent consideration; EBITDA inclusive of estimated dis-synergies and previously unallocated corporate and other costs, per FIS disclosure. 4. Per Company management. 5. Pro Forma financials adjusted to include full-year CY25E contribution of Boom, DMS, and Sila Money acquisitions. ($ in millions) EV Multiple EV / NTM EV / NTM Announced Enterprise EBITDA EBITDA EBITDA NTM / LTM EBITDA Margin Date Acquiror Target Value LTM NTM Paytech Median Comps Median Rev. Growth LTM NTM Aug 2025 Western Union International Money Express $465 4.0x 4.3x 10.3x 7.2x 2% 18% 17% May 2025 TPG / Corpay AvidXchange $1,901 22.5x 18.4x 11.0x 7.7x 9% 19% 22% Apr 2025 GPN Worldpay $24,250 NA 10.8x 11.1x 7.2x 6% NA 41% Jan 2025 Paychex Paycor $4,106 16.6x 15.9x 12.7x 11.1x 10% 35% 33% Apr 2024 Advent Nuvei $6,127 14.0x 12.6x 11.5x 9.0x 17% 37% 35% Jul 2023 GTCR Worldpay $17,500 9.8x 9.5x 9.6x 8.5x 3% 38% 38% Jan 2023 Nuvei Paya $1,352 18.9x 16.6x 11.0x 9.6x 11% 26% 27% Aug 2022 GPN EVO Payments $4,133 21.4x 19.2x 11.5x 11.0x 10% 36% 37% Aug 2022 Searchlight Capital Partners Netspend $1,000 4.8x 3.7x 11.5x 11.0x 6% 33% 40% Feb 2022 Madison Dearborn MoneyGram $1,826 8.1x 8.1x 12.7x 12.7x 5% 18% 17% Dec 2021 Thoma Bravo Bottomline $2,633 27.1x 23.4x 12.5x 12.0x 11% 20% 20% Apr 2021 Deluxe First American Payments Systems $960 15.6x NA 17.6x 17.6x NA 21% NA Mar 2021 Prism Finxera $425 7.9x 7.9x 16.9x 17.6x 7% 75% 70% Reference PF Prism (Management) 7% 25% 24% Mean 14.2x 12.5x 8% 31% 33% Median 14.8x 11.7x 8% 29% 34% Operating and Valuation Metrics 13 (3) (4) (1) (5) Reference Valuation Metric Selected Range Implied EV Implied Equity Value Share Price LTM PF Adj. EBITDA $238 7.00x - 10.00x $1,663 - $2,376 $681 - $1,394 $7.84 - $16.10 NTM Adj. EBITDA $245 6.50x - 9.50x $1,594 - $2,329 $611 - $1,347 $7.03 - $15.55 (2)
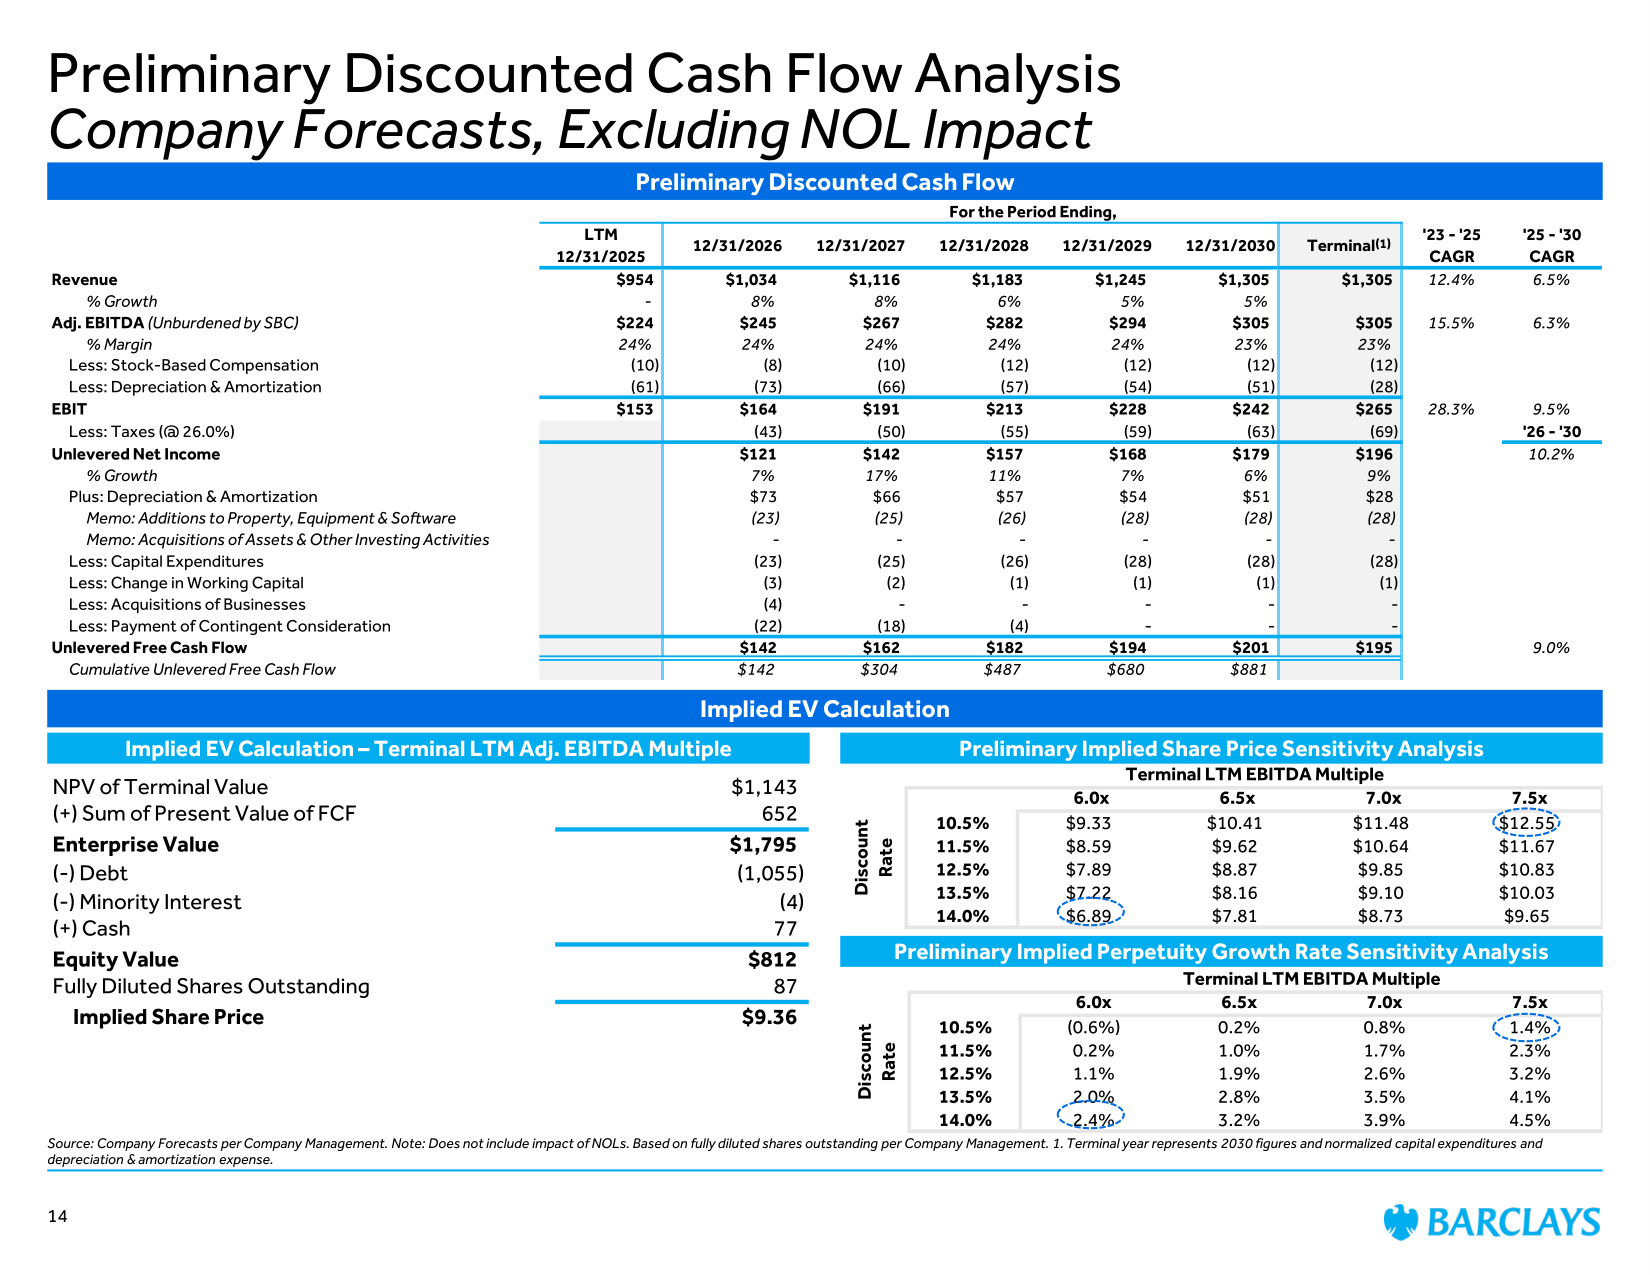
For the Period Ending, LTM 12/31/2025 12/31/2026 12/31/2027 12/31/2028 12/31/2029 12/31/2030 Terminal '23 - '25 CAGR '25 - '30 CAGR Revenue $954 $1,034 $1,116 $1,183 $1,245 $1,305 $1,305 12.4% 6.5% % Growth - 8% 8% 6% 5% 5% Adj. EBITDA (Unburdened by SBC) $224 $245 $267 $282 $294 $305 $305 15.5% 6.3% % Margin 24% 24% 24% 24% 24% 23% 23% Less: Stock-Based Compensation (10) (8) (10) (12) (12) (12) (12) Less: Depreciation & Amortization (61) (73) (66) (57) (54) (51) (28) EBIT $153 $164 $191 $213 $228 $242 $265 28.3% 9.5% Less: Taxes (@ 26.0%) (43) (50) (55) (59) (63) (69) '26 - '30 Unlevered Net Income $121 $142 $157 $168 $179 $196 10.2% % Growth 7% 17% 11% 7% 6% 9% Plus: Depreciation & Amortization $73 $66 $57 $54 $51 $28 Memo: Additions to Property, Equipment & Software (23) (25) (26) (28) (28) (28) Memo: Acquisitions of Assets & Other Investing Activities - - - - - - Less: Capital Expenditures (23) (25) (26) (28) (28) (28) Less: Change in Working Capital (3) (2) (1) (1) (1) (1) Less: Acquisitions of Businesses (4) - - - - - Less: Payment of Contingent Consideration (22) (18) (4) - - - Unlevered Free Cash Flow $142 $162 $182 $194 $201 $195 9.0% Cumulative Unlevered Free Cash Flow $142 $304 $487 $680 $881 Implied EV Calculation Implied EV Calculation – Terminal LTM Adj. EBITDA Multiple Preliminary Implied Share Price Sensitivity Analysis NPV of Terminal Value $1,143 (+) Sum of Present Value of FCF 652 Enterprise Value $1,795 (-) Debt (1,055) (-) Minority Interest (4) (+) Cash 77 Equity Value $812 Fully Diluted Shares Outstanding 87 Implied Share Price $9.36 Preliminary Implied Perpetuity Growth Rate Sensitivity Analysis Preliminary Discounted Cash Flow Terminal LTM EBITDA Multiple 6.0x 6.5x 7.0x 7.5x 10.5% $9.33 $10.41 $11.48 $12.55 11.5% $8.59 $9.62 $10.64 $11.67 12.5% $7.89 $8.87 $9.85 $10.83 13.5% $7.22 $8.16 $9.10 $10.03 14.0% $6.89 $7.81 $8.73 $9.65 Discount Rate Preliminary Discounted Cash Flow Analysis Company Forecasts, Excluding NOL Impact Source: Company Forecasts per Company Management. Note: Does not include impact of NOLs. Based on fully diluted shares outstanding per Company Management. 1. Terminal year represents 2030 figures and normalized capital expenditures and depreciation & amortization expense. 14 (1) Terminal LTM EBITDA Multiple 6.0x 6.5x 7.0x 7.5x 10.5% (0.6%) 0.2% 0.8% 1.4% 11.5% 0.2% 1.0% 1.7% 2.3% 12.5% 1.1% 1.9% 2.6% 3.2% 13.5% 2.0% 2.8% 3.5% 4.1% 14.0% 2.4% 3.2% 3.9% 4.5% Discount Rate
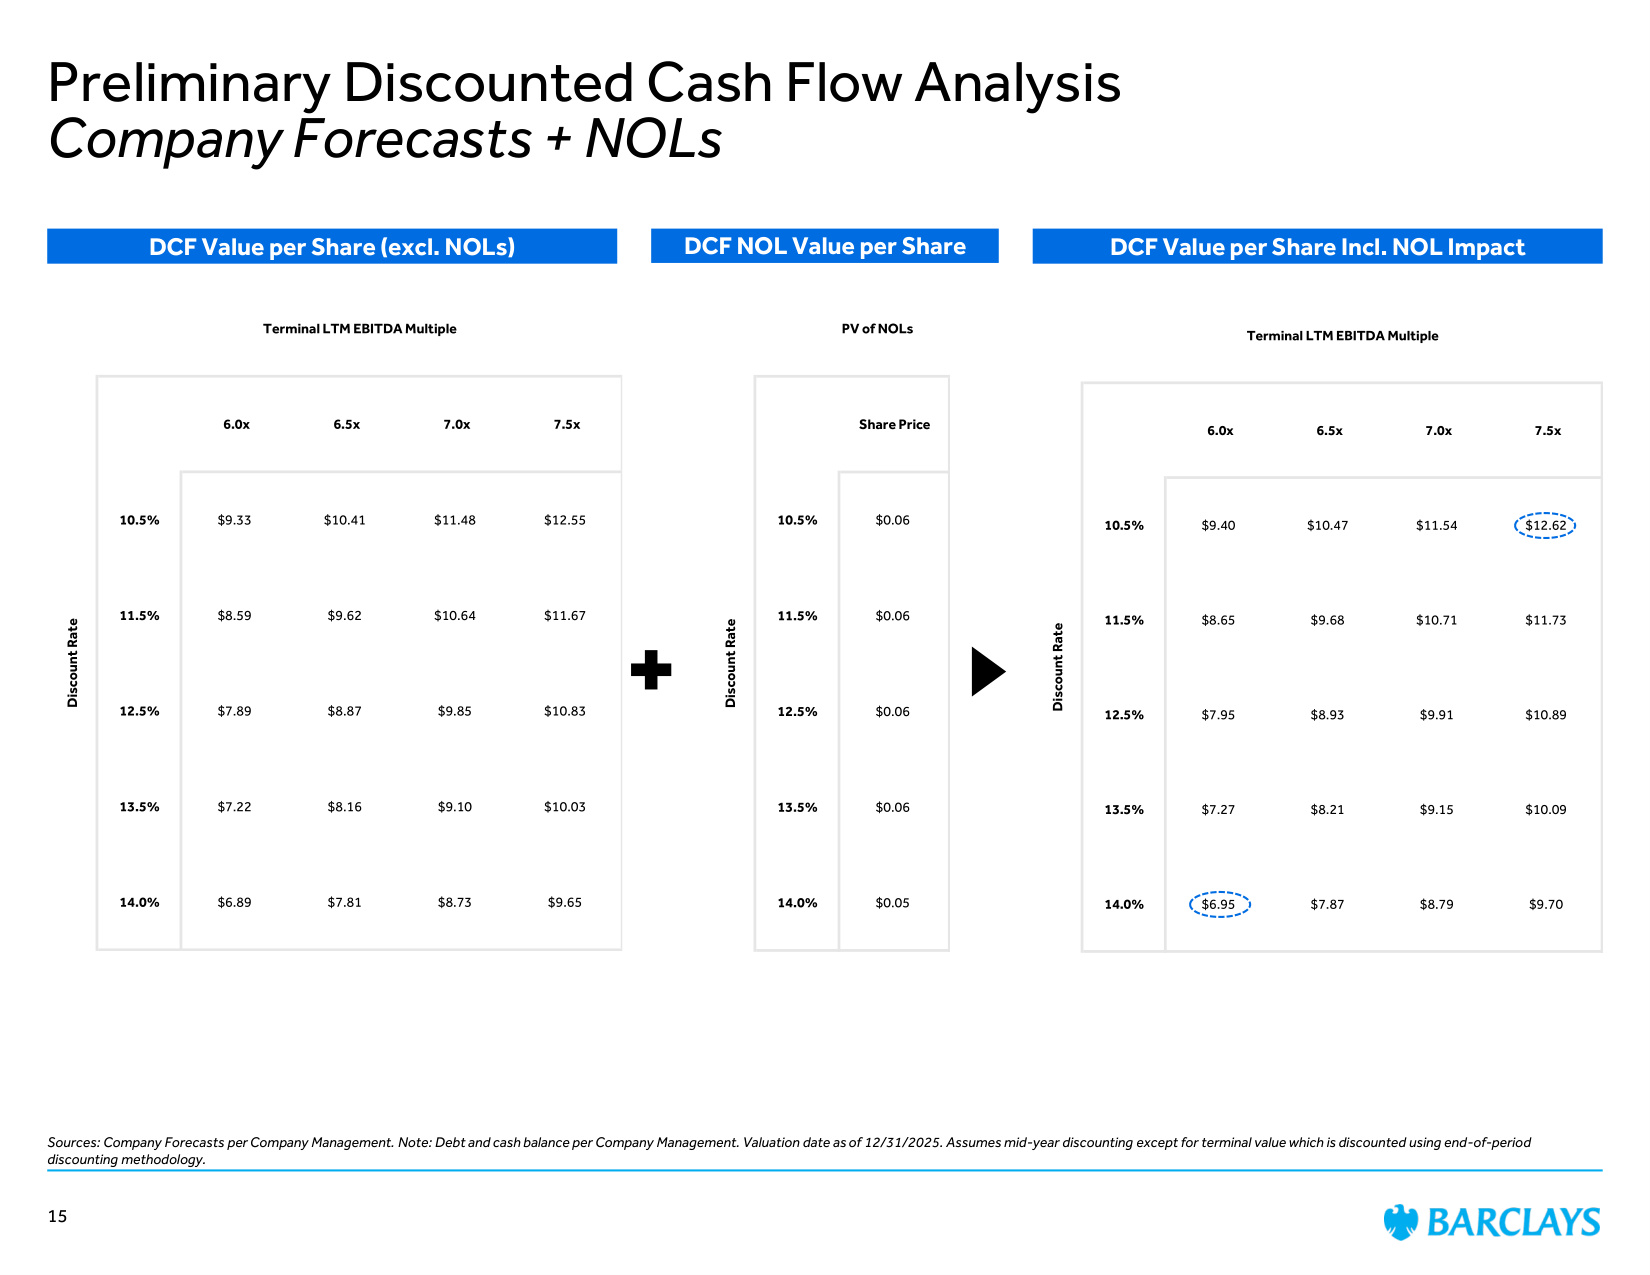
Terminal LTM EBITDA Multiple 6.0x 6.5x 7.0x 7.5x 10.5% $9.40 $10.47 $11.54 $12.62 11.5% $8.65 $9.68 $10.71 $11.73 12.5% $7.95 $8.93 $9.91 $10.89 13.5% $7.27 $8.21 $9.15 $10.09 14.0% $6.95 $7.87 $8.79 $9.70 Discount Rate Preliminary Discounted Cash Flow Analysis Company Forecasts + NOLs Sources: Company Forecasts per Company Management. Note: Debt and cash balance per Company Management. Valuation date as of 12/31/2025. Assumes mid-year discounting except for terminal value which is discounted using end-of-period discounting methodology. 15 DCF Value per Share (excl. NOLs) DCF NOL Value per Share DCF Value per Share Incl. NOL Impact Terminal LTM EBITDA Multiple 6.0x 6.5x 7.0x 7.5x 10.5% $9.33 $10.41 $11.48 $12.55 11.5% $8.59 $9.62 $10.64 $11.67 12.5% $7.89 $8.87 $9.85 $10.83 13.5% $7.22 $8.16 $9.10 $10.03 14.0% $6.89 $7.81 $8.73 $9.65 Discount Rate PV of NOLs Share Price 10.5% $0.06 11.5% $0.06 12.5% $0.06 13.5% $0.06 14.0% $0.05 Discount Rate
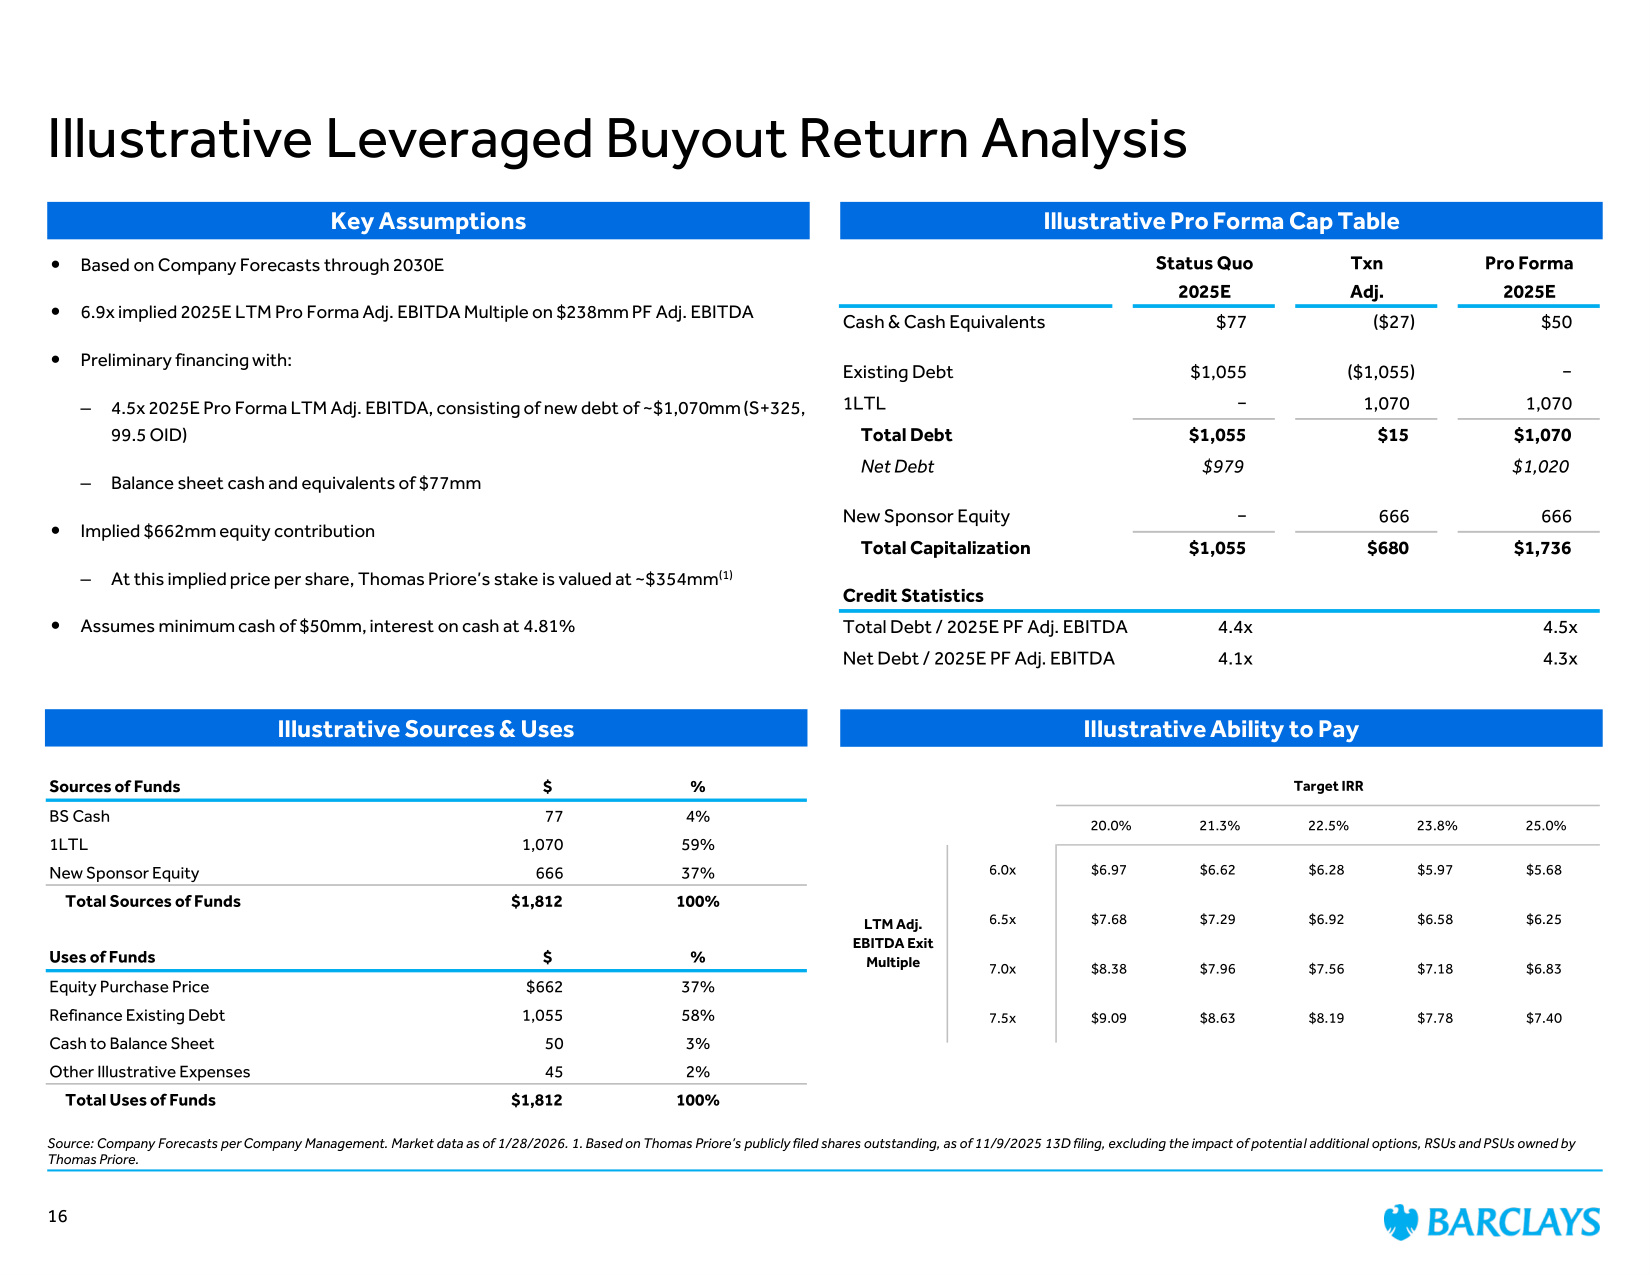
Illustrative Pro Forma Cap Table Illustrative Ability to Pay Key Assumptions Sources of Funds $ % BS Cash 77 4% 1LTL 1,070 59% New Sponsor Equity 666 37% Total Sources of Funds $1,812 100% Uses of Funds $ % Equity Purchase Price $662 37% Refinance Existing Debt 1,055 58% Cash to Balance Sheet 50 3% Other Illustrative Expenses 45 2% Total Uses of Funds $1,812 100% Status Quo Txn Pro Forma 2025E Adj. 2025E Cash & Cash Equivalents $77 ($27) $50 Existing Debt $1,055 ($1,055) − 1LTL − 1,070 1,070 Total Debt $1,055 $15 $1,070 Net Debt $979 $1,020 New Sponsor Equity − 666 666 Total Capitalization $1,055 $680 $1,736 Credit Statistics Total Debt / 2025E PF Adj. EBITDA 4.4x 4.5x Net Debt / 2025E PF Adj. EBITDA 4.1x 4.3x Target IRR 20.0% 21.3% 22.5% 23.8% 25.0% 6.0x $6.97 $6.62 $6.28 $5.97 $5.68 6.5x $7.68 $7.29 $6.92 $6.58 $6.25 7.0x $8.38 $7.96 $7.56 $7.18 $6.83 7.5x $9.09 $8.63 $8.19 $7.78 $7.40 LTM Adj. EBITDA Exit Multiple Illustrative Sources & Uses Based on Company Forecasts through 2030E 6.9x implied 2025E LTM Pro Forma Adj. EBITDA Multiple on $238mm PF Adj. EBITDA Preliminary financing with: – 4.5x 2025E Pro Forma LTM Adj. EBITDA, consisting of new debt of ~$1,070mm (S+325, 99.5 OID) – Balance sheet cash and equivalents of $77mm Implied $662mm equity contribution – At this implied price per share, Thomas Priore's stake is valued at ~$354mm(1) Assumes minimum cash of $50mm, interest on cash at 4.81% Illustrative Leveraged Buyout Return Analysis Source: Company Forecasts per Company Management. Market data as of 1/28/2026. 1. Based on Thomas Priore's publicly filed shares outstanding, as of 11/9/2025 13D filing, excluding the impact of potential additional options, RSUs and PSUs owned by Thomas Priore. 16
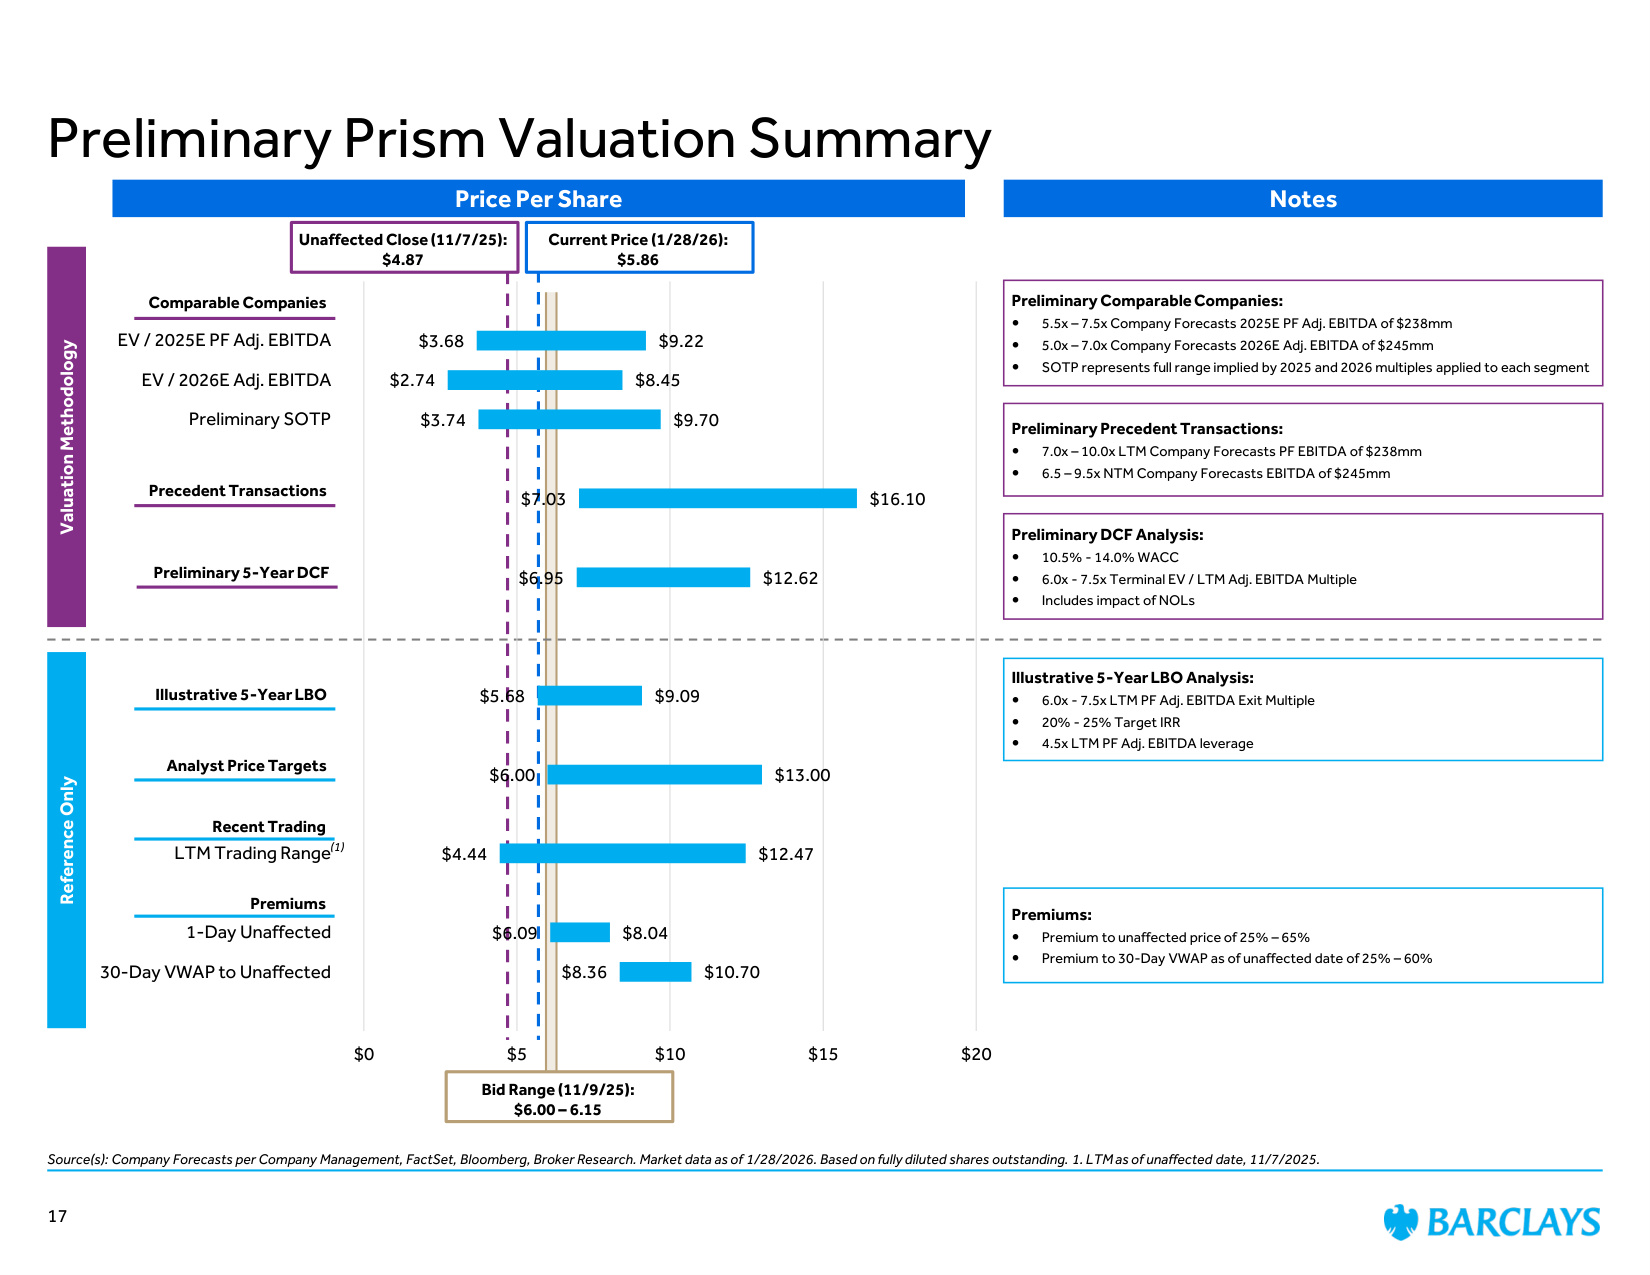
Price Per Share Notes Preliminary Comparable Companies: 5.5x – 7.5x Company Forecasts 2025E PF Adj. EBITDA of $238mm 5.0x – 7.0x Company Forecasts 2026E Adj. EBITDA of $245mm SOTP represents full range implied by 2025 and 2026 multiples applied to each segment Premiums: Premium to unaffected price of 25% – 65% Premium to 30-Day VWAP as of unaffected date of 25% – 60% Preliminary Precedent Transactions: 7.0x – 10.0x LTM Company Forecasts PF EBITDA of $238mm 6.5 – 9.5x NTM Company Forecasts EBITDA of $245mm Valuation Methodology Reference Only Preliminary Prism Valuation Summary Preliminary DCF Analysis: 10.5% - 14.0% WACC 6.0x - 7.5x Terminal EV / LTM Adj. EBITDA Multiple Includes impact of NOLs Premiums Recent Trading Precedent Transactions Comparable Companies Source(s): Company Forecasts per Company Management, FactSet, Bloomberg, Broker Research. Market data as of 1/28/2026. Based on fully diluted shares outstanding. 1. LTM as of unaffected date, 11/7/2025. Illustrative 5-Year LBO Analysis: 6.0x - 7.5x LTM PF Adj. EBITDA Exit Multiple 20% - 25% Target IRR 4.5x LTM PF Adj. EBITDA leverage Illustrative 5-Year LBO Current Price (1/28/26): $5.86 Unaffected Close (11/7/25): $4.87 Preliminary 5-Year DCF 17 Analyst Price Targets Bid Range (11/9/25): $6.00 – 6.15 (1) $3.68 $2.74 $3.74 $7.03 $6.95 $5.68 $6.00 $4.44 $6.09 $8.36 $9.22 $8.45 $9.70 $16.10 $12.62 $9.09 $13.00 $12.47 $8.04 $10.70 $0 $5 $10 $15 $20 EV / 2025E PF Adj. EBITDA EV / 2026E Adj. EBITDA Preliminary SOTP LTM Trading Range 1-Day Unaffected 30-Day VWAP to Unaffected
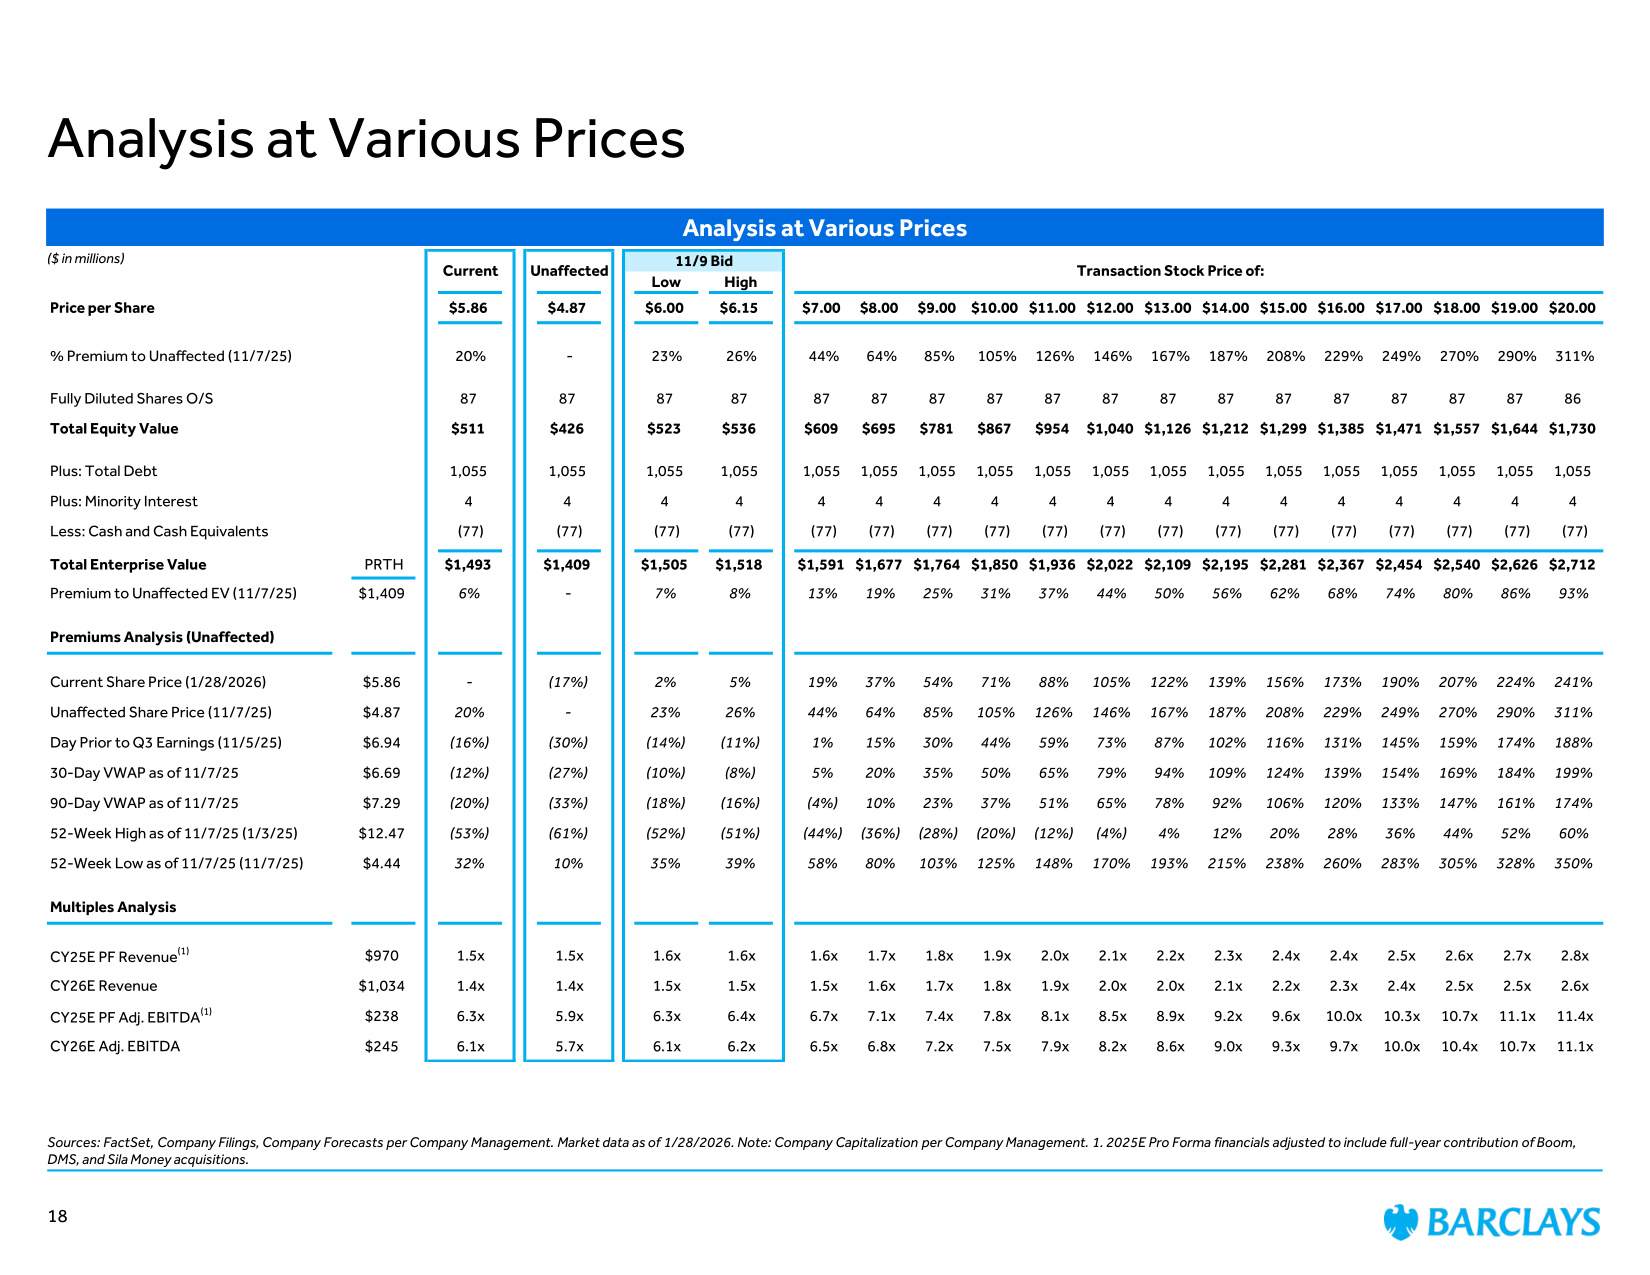
Analysis at Various Prices Sources: FactSet, Company Filings, Company Forecasts per Company Management. Market data as of 1/28/2026. Note: Company Capitalization per Company Management. 1. 2025E Pro Forma financials adjusted to include full-year contribution of Boom, DMS, and Sila Money acquisitions. Analysis at Various Prices 11/9 Bid Low High Price per Share $5.86 $4.87 $6.00 $6.15 $7.00 $8.00 $9.00 $10.00 $11.00 $12.00 $13.00 $14.00 $15.00 $16.00 $17.00 $18.00 $19.00 $20.00 % Premium to Unaffected (11/7/25) 20% - 23% 26% 44% 64% 85% 105% 126% 146% 167% 187% 208% 229% 249% 270% 290% 311% Fully Diluted Shares O/S 87 87 87 87 87 87 87 87 87 87 87 87 87 87 87 87 87 86 Total Equity Value $511 $426 $523 $536 $609 $695 $781 $867 $954 $1,040 $1,126 $1,212 $1,299 $1,385 $1,471 $1,557 $1,644 $1,730 Plus: Total Debt 1,055 1,055 1,055 1,055 1,055 1,055 1,055 1,055 1,055 1,055 1,055 1,055 1,055 1,055 1,055 1,055 1,055 1,055 Plus: Minority Interest 4 4 4 4 4 4 4 4 4 4 4 4 4 4 4 4 4 4 Less: Cash and Cash Equivalents (77) (77) (77) (77) (77) (77) (77) (77) (77) (77) (77) (77) (77) (77) (77) (77) (77) (77) Total Enterprise Value PRTH $1,493 $1,409 $1,505 $1,518 $1,591 $1,677 $1,764 $1,850 $1,936 $2,022 $2,109 $2,195 $2,281 $2,367 $2,454 $2,540 $2,626 $2,712 Premium to Unaffected EV (11/7/25) $1,409 6% - 7% 8% 13% 19% 25% 31% 37% 44% 50% 56% 62% 68% 74% 80% 86% 93% Premiums Analysis (Unaffected) Current Share Price (1/28/2026) $5.86 - (17%) 2% 5% 19% 37% 54% 71% 88% 105% 122% 139% 156% 173% 190% 207% 224% 241% Unaffected Share Price (11/7/25) $4.87 20% - 23% 26% 44% 64% 85% 105% 126% 146% 167% 187% 208% 229% 249% 270% 290% 311% Day Prior to Q3 Earnings (11/5/25) $6.94 (16%) (30%) (14%) (11%) 1% 15% 30% 44% 59% 73% 87% 102% 116% 131% 145% 159% 174% 188% 30-Day VWAP as of 11/7/25 $6.69 (12%) (27%) (10%) (8%) 5% 20% 35% 50% 65% 79% 94% 109% 124% 139% 154% 169% 184% 199% 90-Day VWAP as of 11/7/25 $7.29 (20%) (33%) (18%) (16%) (4%) 10% 23% 37% 51% 65% 78% 92% 106% 120% 133% 147% 161% 174% 52-Week High as of 11/7/25 (1/3/25) $12.47 (53%) (61%) (52%) (51%) (44%) (36%) (28%) (20%) (12%) (4%) 4% 12% 20% 28% 36% 44% 52% 60% 52-Week Low as of 11/7/25 (11/7/25) $4.44 32% 10% 35% 39% 58% 80% 103% 125% 148% 170% 193% 215% 238% 260% 283% 305% 328% 350% Multiples Analysis CY25E PF Revenue(1) $970 1.5x 1.5x 1.6x 1.6x 1.6x 1.7x 1.8x 1.9x 2.0x 2.1x 2.2x 2.3x 2.4x 2.4x 2.5x 2.6x 2.7x 2.8x CY26E Revenue $1,034 1.4x 1.4x 1.5x 1.5x 1.5x 1.6x 1.7x 1.8x 1.9x 2.0x 2.0x 2.1x 2.2x 2.3x 2.4x 2.5x 2.5x 2.6x CY25E PF Adj. EBITDA(1) $238 6.3x 5.9x 6.3x 6.4x 6.7x 7.1x 7.4x 7.8x 8.1x 8.5x 8.9x 9.2x 9.6x 10.0x 10.3x 10.7x 11.1x 11.4x CY26E Adj. EBITDA $245 6.1x 5.7x 6.1x 6.2x 6.5x 6.8x 7.2x 7.5x 7.9x 8.2x 8.6x 9.0x 9.3x 9.7x 10.0x 10.4x 10.7x 11.1x Current Unaffected Transaction Stock Price of: ($ in millions) 18
Appendix
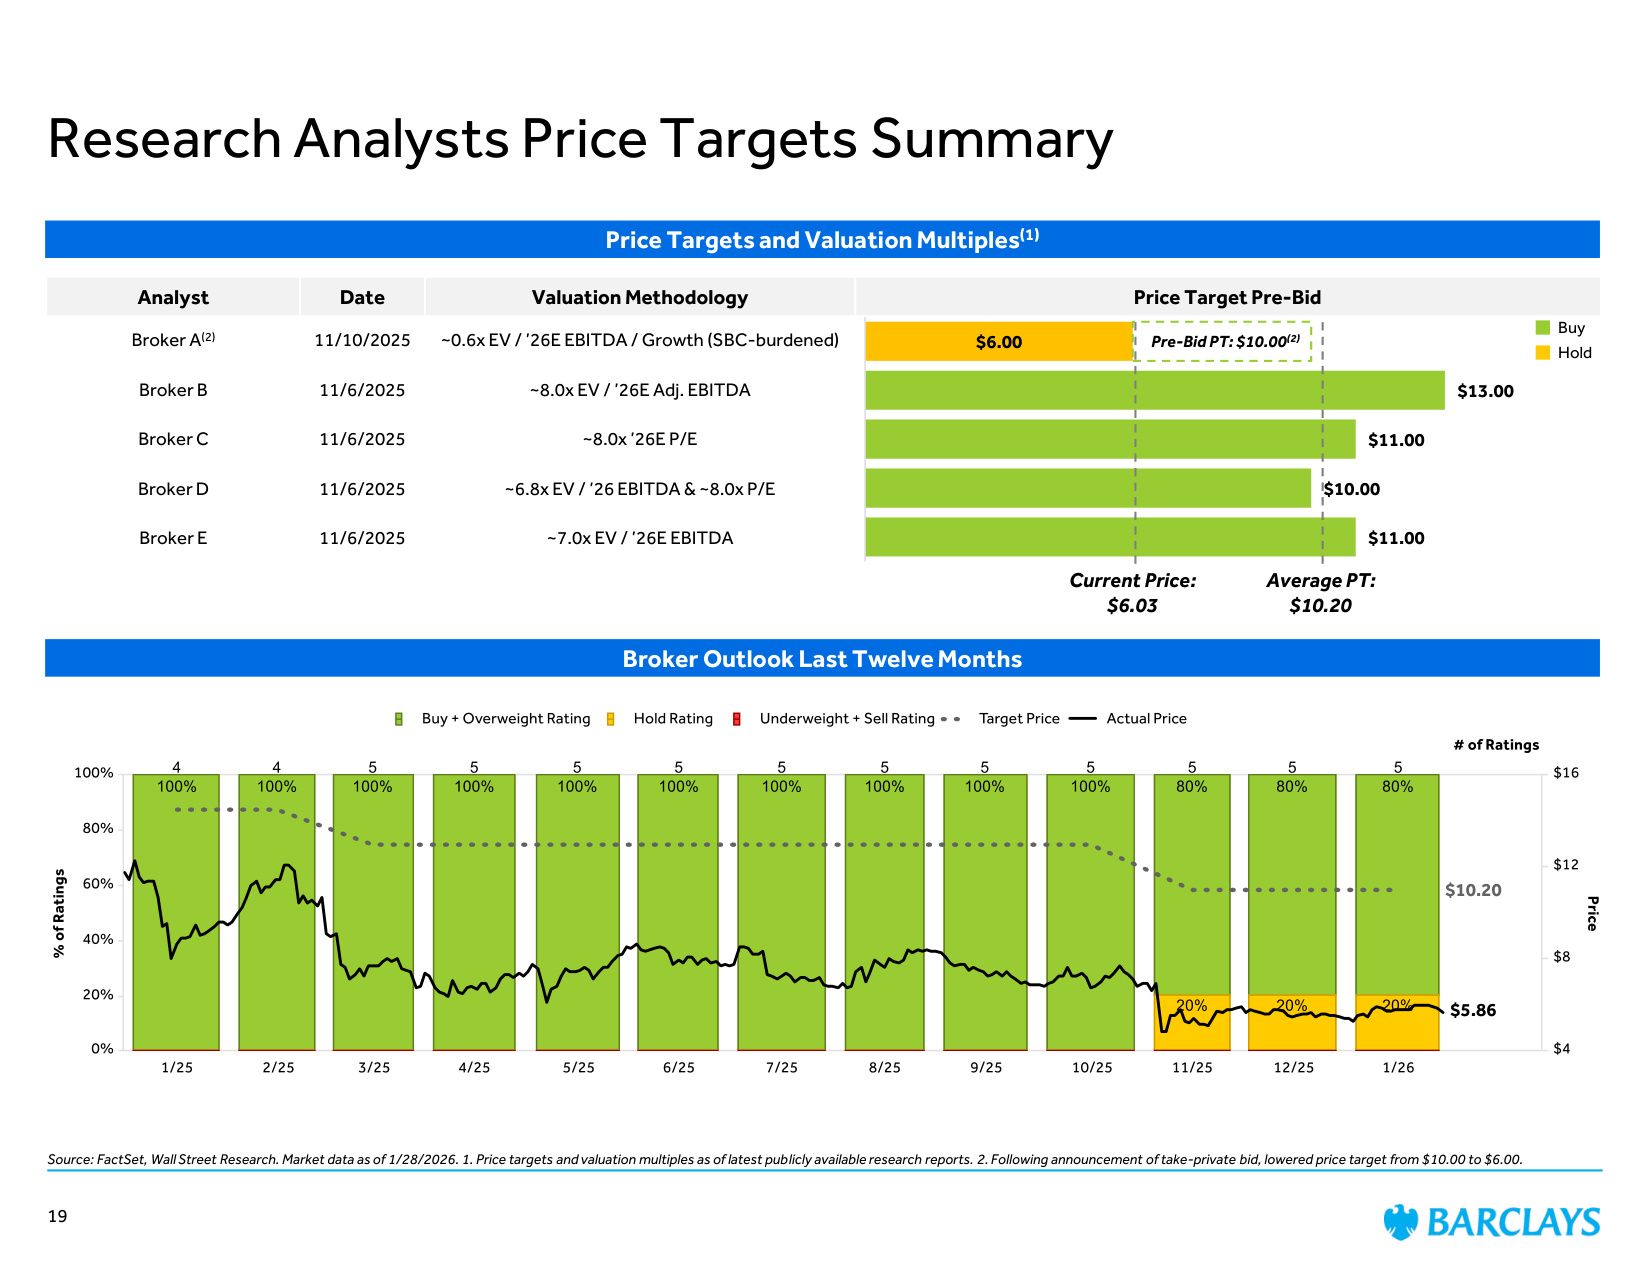
Research Analysts Price Targets Summary Source: FactSet, Wall Street Research. Market data as of 1/28/2026. 1. Price targets and valuation multiples as of latest publicly available research reports. 2. Following announcement of take-private bid, lowered price target from $10.00 to $6.00. Price Targets and Valuation Multiples(1) Broker Outlook Last Twelve Months Analyst Date Valuation Methodology Price Target Pre-Bid Broker A(2) 11/10/2025 ~0.6x EV / '26E EBITDA / Growth (SBC-burdened) Broker B 11/6/2025 ~8.0x EV / '26E Adj. EBITDA Broker C 11/6/2025 ~8.0x '26E P/E Broker D 11/6/2025 ~6.8x EV / '26 EBITDA & ~8.0x P/E Broker E 11/6/2025 ~7.0x EV / '26E EBITDA $6.00 $13.00 $11.00 $10.00 $11.00 Average PT: $10.20 Buy Hold Current Price: $6.03 Pre-Bid PT: $10.00(2) 19 $10.20 $5.86
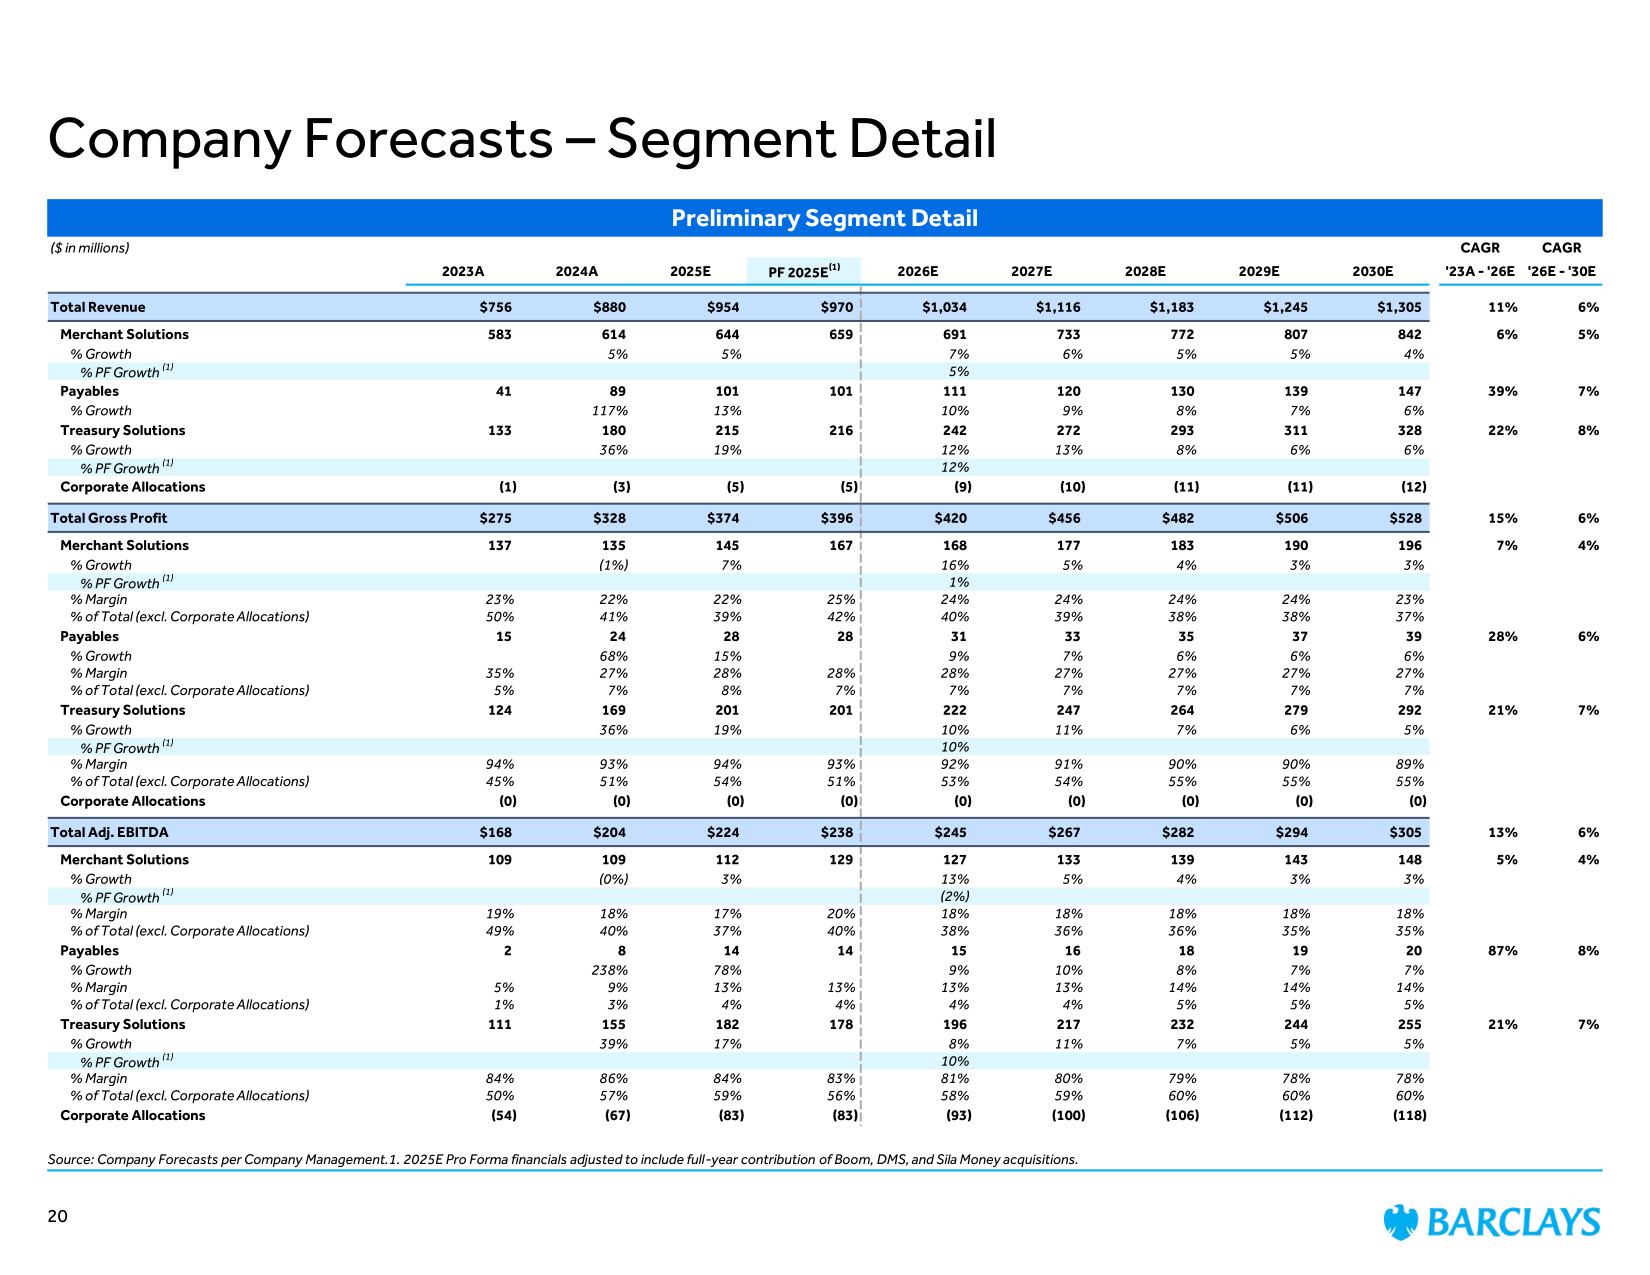
Preliminary Segment Detail ($ in millions) CAGR CAGR 2023A 2024A 2025E PF 2025E(1) 2026E 2027E 2028E 2029E 2030E '23A - '26E '26E - '30E Total Revenue $756 $880 $954 $970 $1,034 $1,116 $1,183 $1,245 $1,305 11% 6% Merchant Solutions 583 614 644 659 691 733 772 807 842 6% 5% % Growth 5% 5% 7% 6% 5% 5% 4% % PF Growth (1) 5% Payables 41 89 101 101 111 120 130 139 147 39% 7% % Growth 117% 13% 10% 9% 8% 7% 6% Treasury Solutions 133 180 215 216 242 272 293 311 328 22% 8% % Growth 36% 19% 12% 13% 8% 6% 6% % PF Growth (1) 12% Corporate Allocations (1) (3) (5) (5) (9) (10) (11) (11) (12) Total Gross Profit $275 $328 $374 $396 $420 $456 $482 $506 $528 15% 6% Merchant Solutions 137 135 145 167 168 177 183 190 196 7% 4% % Growth (1%) 7% 16% 5% 4% 3% 3% % PF Growth (1) 1% % Margin 23% 22% 22% 25% 24% 24% 24% 24% 23% % of Total (excl. Corporate Allocations) 50% 41% 39% 42% 40% 39% 38% 38% 37% Payables 15 24 28 28 31 33 35 37 39 28% 6% % Growth 68% 15% 9% 7% 6% 6% 6% % Margin 35% 27% 28% 28% 28% 27% 27% 27% 27% % of Total (excl. Corporate Allocations) 5% 7% 8% 7% 7% 7% 7% 7% 7% Treasury Solutions 124 169 201 201 222 247 264 279 292 21% 7% % Growth 36% 19% 10% 11% 7% 6% 5% % PF Growth (1) 10% % Margin 94% 93% 94% 93% 92% 91% 90% 90% 89% % of Total (excl. Corporate Allocations) 45% 51% 54% 51% 53% 54% 55% 55% 55% Corporate Allocations (0) (0) (0) (0) (0) (0) (0) (0) (0) Total Adj. EBITDA $168 $204 $224 $238 $245 $267 $282 $294 $305 13% 6% Merchant Solutions 109 109 112 129 127 133 139 143 148 5% 4% % Growth (0%) 3% 13% 5% 4% 3% 3% % PF Growth (1) (2%) % Margin 19% 18% 17% 20% 18% 18% 18% 18% 18% % of Total (excl. Corporate Allocations) 49% 40% 37% 40% 38% 36% 36% 35% 35% Payables 2 8 14 14 15 16 18 19 20 87% 8% % Growth 238% 78% 9% 10% 8% 7% 7% % Margin 5% 9% 13% 13% 13% 13% 14% 14% 14% % of Total (excl. Corporate Allocations) 1% 3% 4% 4% 4% 4% 5% 5% 5% Treasury Solutions 111 155 182 178 196 217 232 244 255 21% 7% % Growth 39% 17% 8% 11% 7% 5% 5% % PF Growth (1) 10% % Margin 84% 86% 84% 83% 81% 80% 79% 78% 78% % of Total (excl. Corporate Allocations) 50% 57% 59% 56% 58% 59% 60% 60% 60% Corporate Allocations (54) (67) (83) (83) (93) (100) (106) (112) (118) Company Forecasts – Segment Detail Source: Company Forecasts per Company Management.1. 2025E Pro Forma financials adjusted to include full-year contribution of Boom, DMS, and Sila Money acquisitions. 20
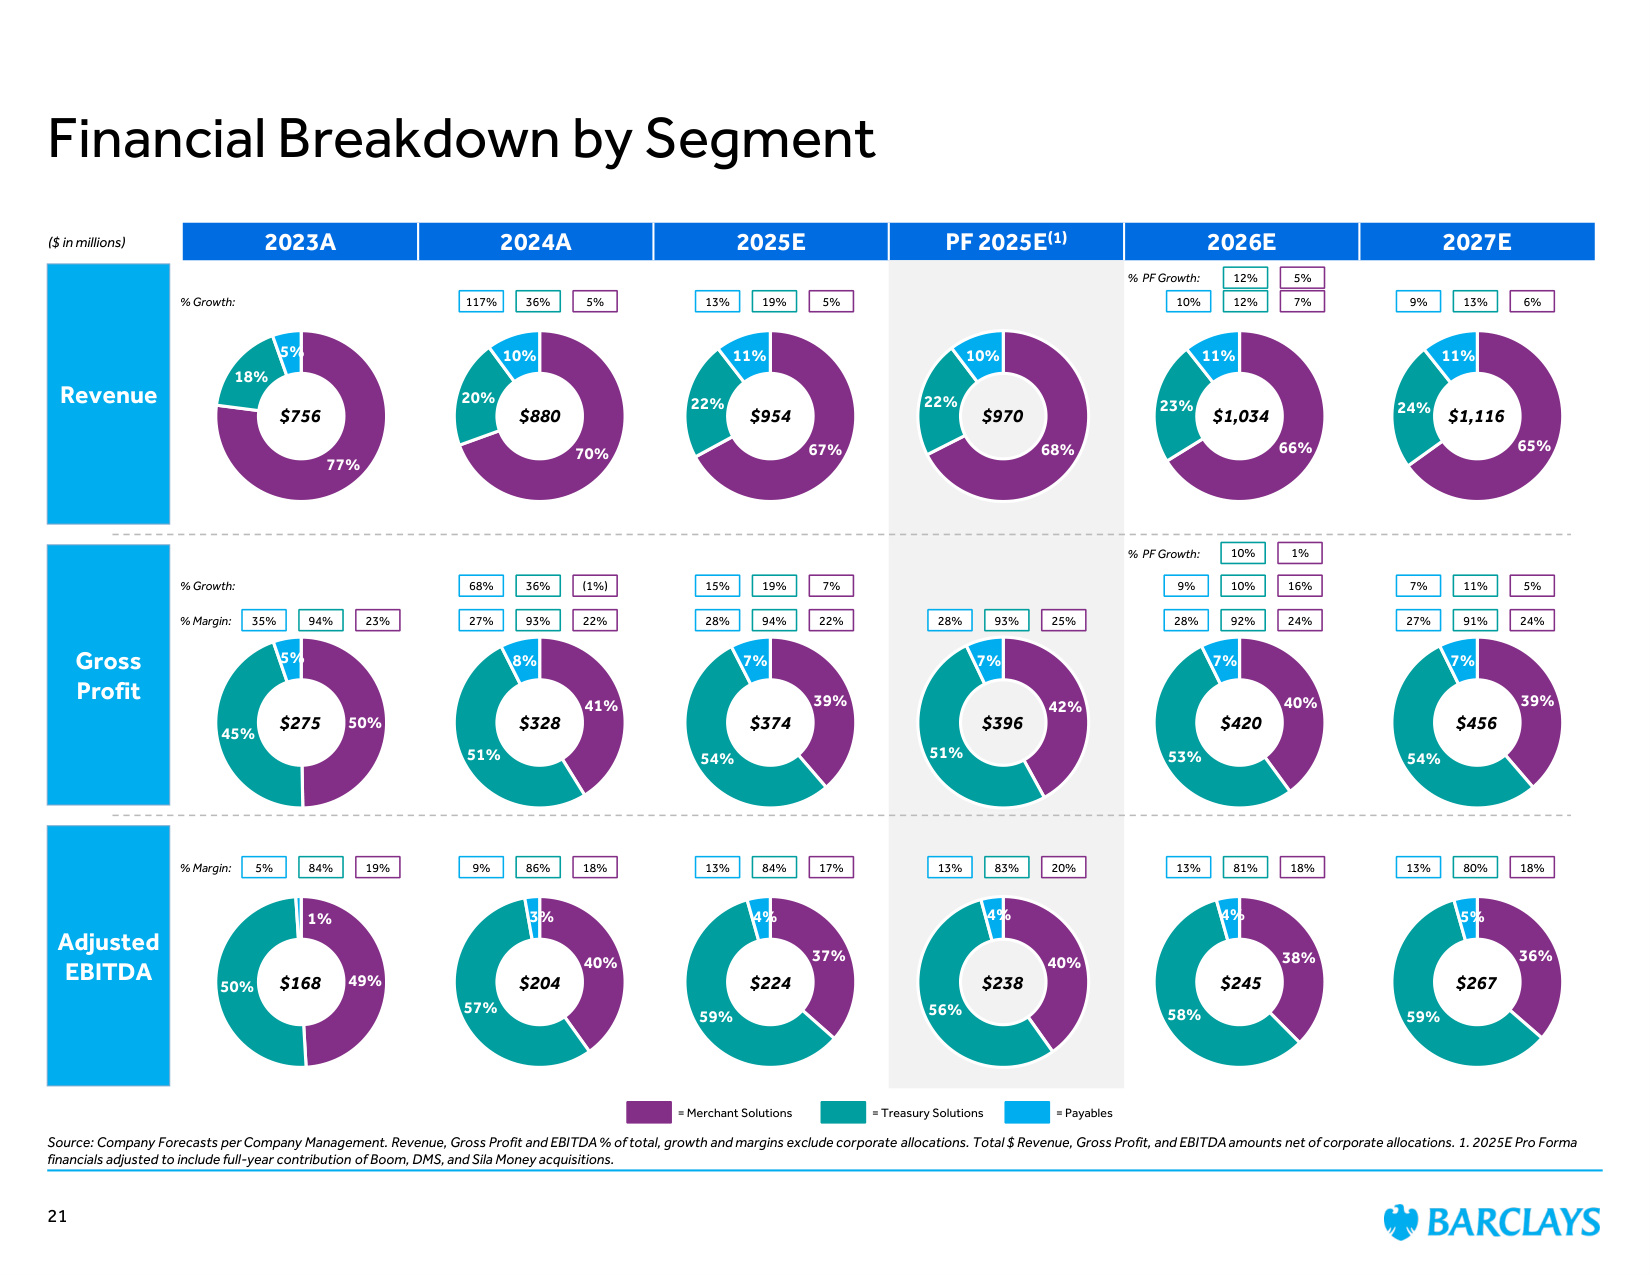
Source: Company Forecasts per Company Management. Revenue, Gross Profit and EBITDA % of total, growth and margins exclude corporate allocations. Total $ Revenue, Gross Profit, and EBITDA amounts net of corporate allocations. 1. 2025E Pro Forma financials adjusted to include full-year contribution of Boom, DMS, and Sila Money acquisitions. Financial Breakdown by Segment Revenue ($ in millions) Adjusted EBITDA 21 Gross Profit 2023A 2024A 2025E PF 2025E(1) 2026E 2027E 77% 18% 5% 70% 20% 10% 67% 22% 11% 68% 22% 10% 66% 23% 11% 50% 45% 5% 41% 51% 8% 39% 54% 7% 42% 51% 7% 40% 53% 7% 49% 50% 1% 40% 57% 3% 37% 59% 4% 40% 56% 4% 38% 58% 4% % Margin: % Margin: % Growth: 5% 117% 36% 5% 13% 19% 7% 10% 12% 6% 9% 13% 22% 27% 93% 22% 28% 94% 25% 28% 93% 24% 27% 91% 18% 9% 86% 17% 13% 84% 20% 13% 83% 18% 13% 81% 23% 35% 94% 19% 5% 84% $954 $970 $1,034 $756 $880 $374 $396 $420 $275 $328 $224 $238 $245 $168 $204 = Merchant Solutions = Payables = Treasury Solutions % Growth: (1%) 68% 36% 7% 15% 19% 5% 7% 11% 24% 28% 92% 16% 9% 10% 65% 24% 11% 39% 54% 7% 36% 59% 5% $1,116 $456 $267 18% 13% 80% 5% 12% % PF Growth: 1% 10% % PF Growth:
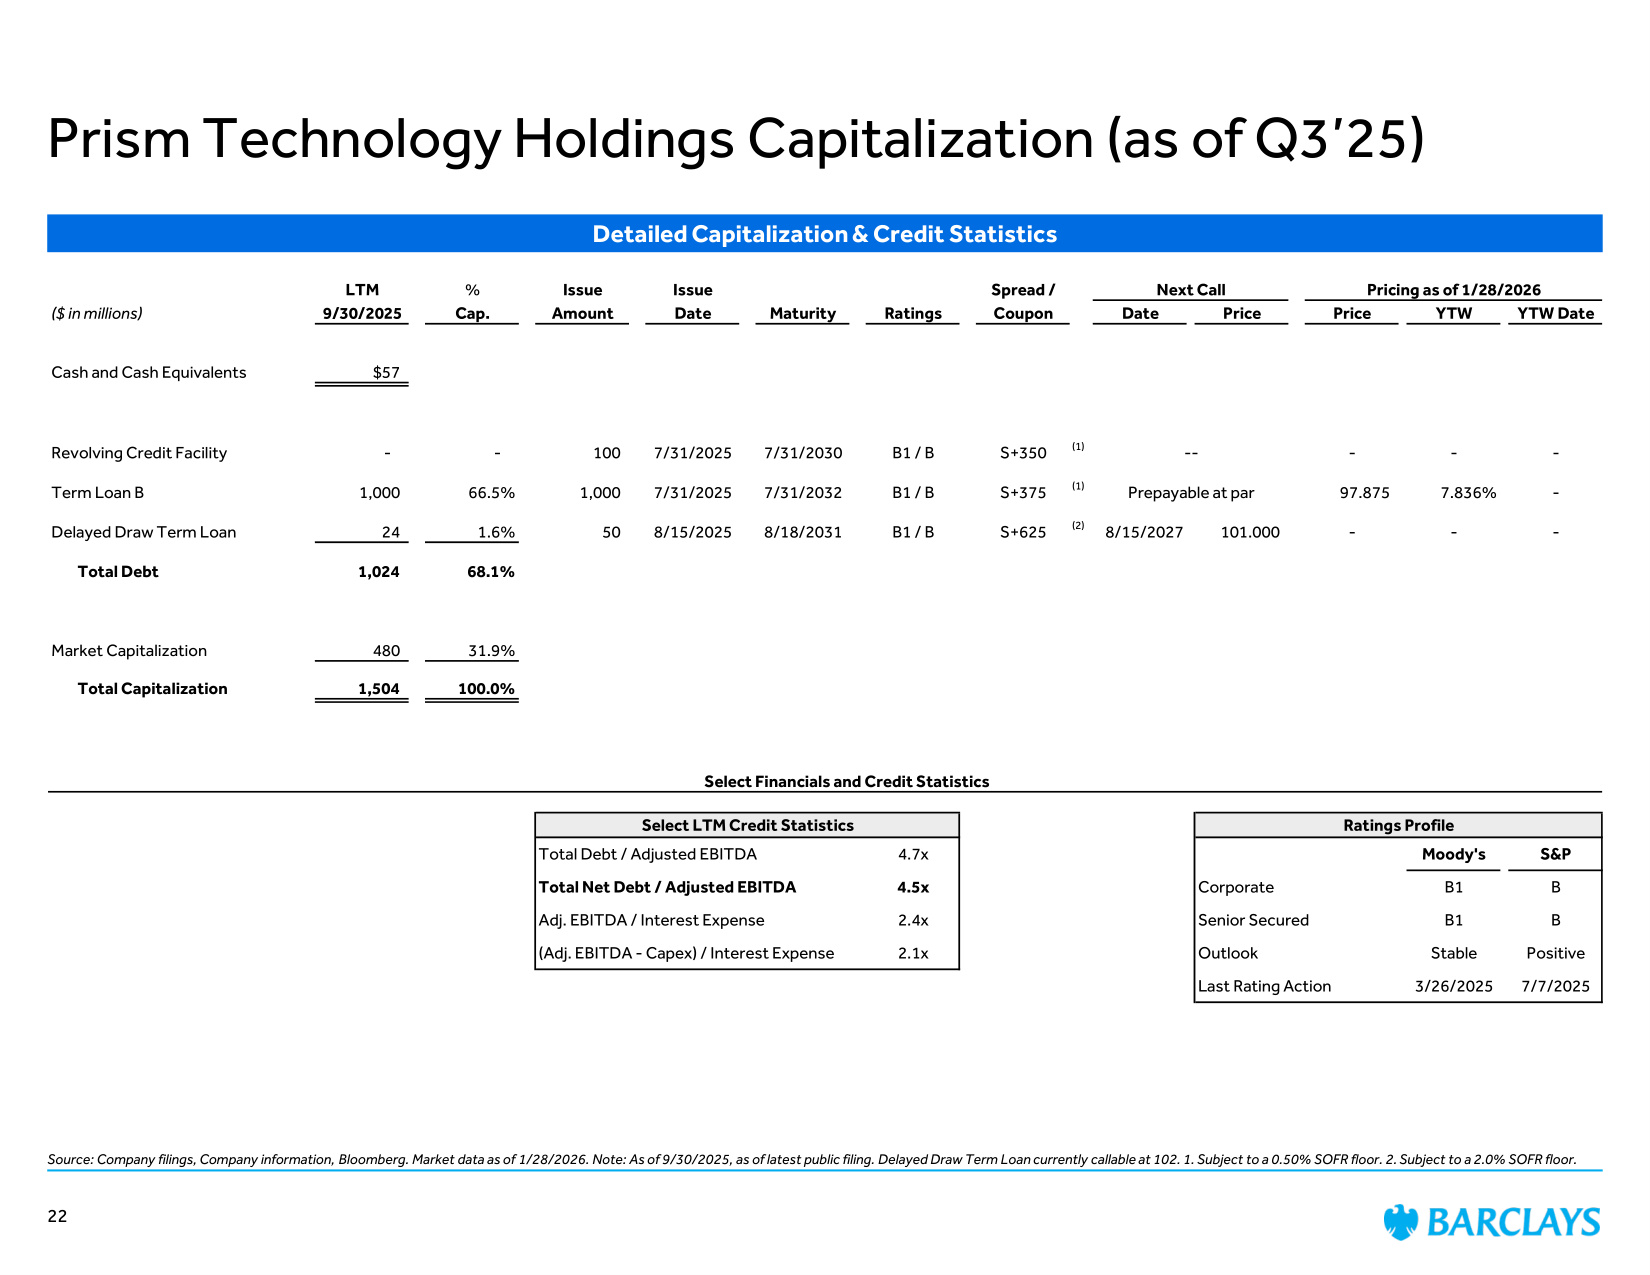
Source: Company filings, Company information, Bloomberg. Market data as of 1/28/2026. Note: As of 9/30/2025, as of latest public filing. Delayed Draw Term Loan currently callable at 102. 1. Subject to a 0.50% SOFR floor. 2. Subject to a 2.0% SOFR floor. Prism Technology Holdings Capitalization (as of Q3'25) Detailed Capitalization & Credit Statistics LTM % Issue Issue Spread / Next Call Pricing as of 1/28/2026 ($ in millions) 9/30/2025 Cap. Amount Date Maturity Ratings Coupon Date Price Price YTW YTW Date Cash and Cash Equivalents $57 Revolving Credit Facility - - 100 7/31/2025 7/31/2030 B1 / B S+350 (1) -- - - - Term Loan B 1,000 66.5% 1,000 7/31/2025 7/31/2032 B1 / B S+375 (1) Prepayable at par 97.875 7.836% - Delayed Draw Term Loan 24 1.6% 50 8/15/2025 8/18/2031 B1 / B S+625 (2) 8/15/2027 101.000 - - - Total Debt 1,024 68.1% Market Capitalization 480 31.9% Total Capitalization 1,504 100.0% Select Financials and Credit Statistics Select LTM Credit Statistics Ratings Profile Total Debt / Adjusted EBITDA 4.7x Moody's S&P Total Net Debt / Adjusted EBITDA 4.5x Corporate B1 B Adj. EBITDA / Interest Expense 2.4x Senior Secured B1 B (Adj. EBITDA - Capex) / Interest Expense 2.1x Outlook Stable Positive Last Rating Action 3/26/2025 7/7/2025 22
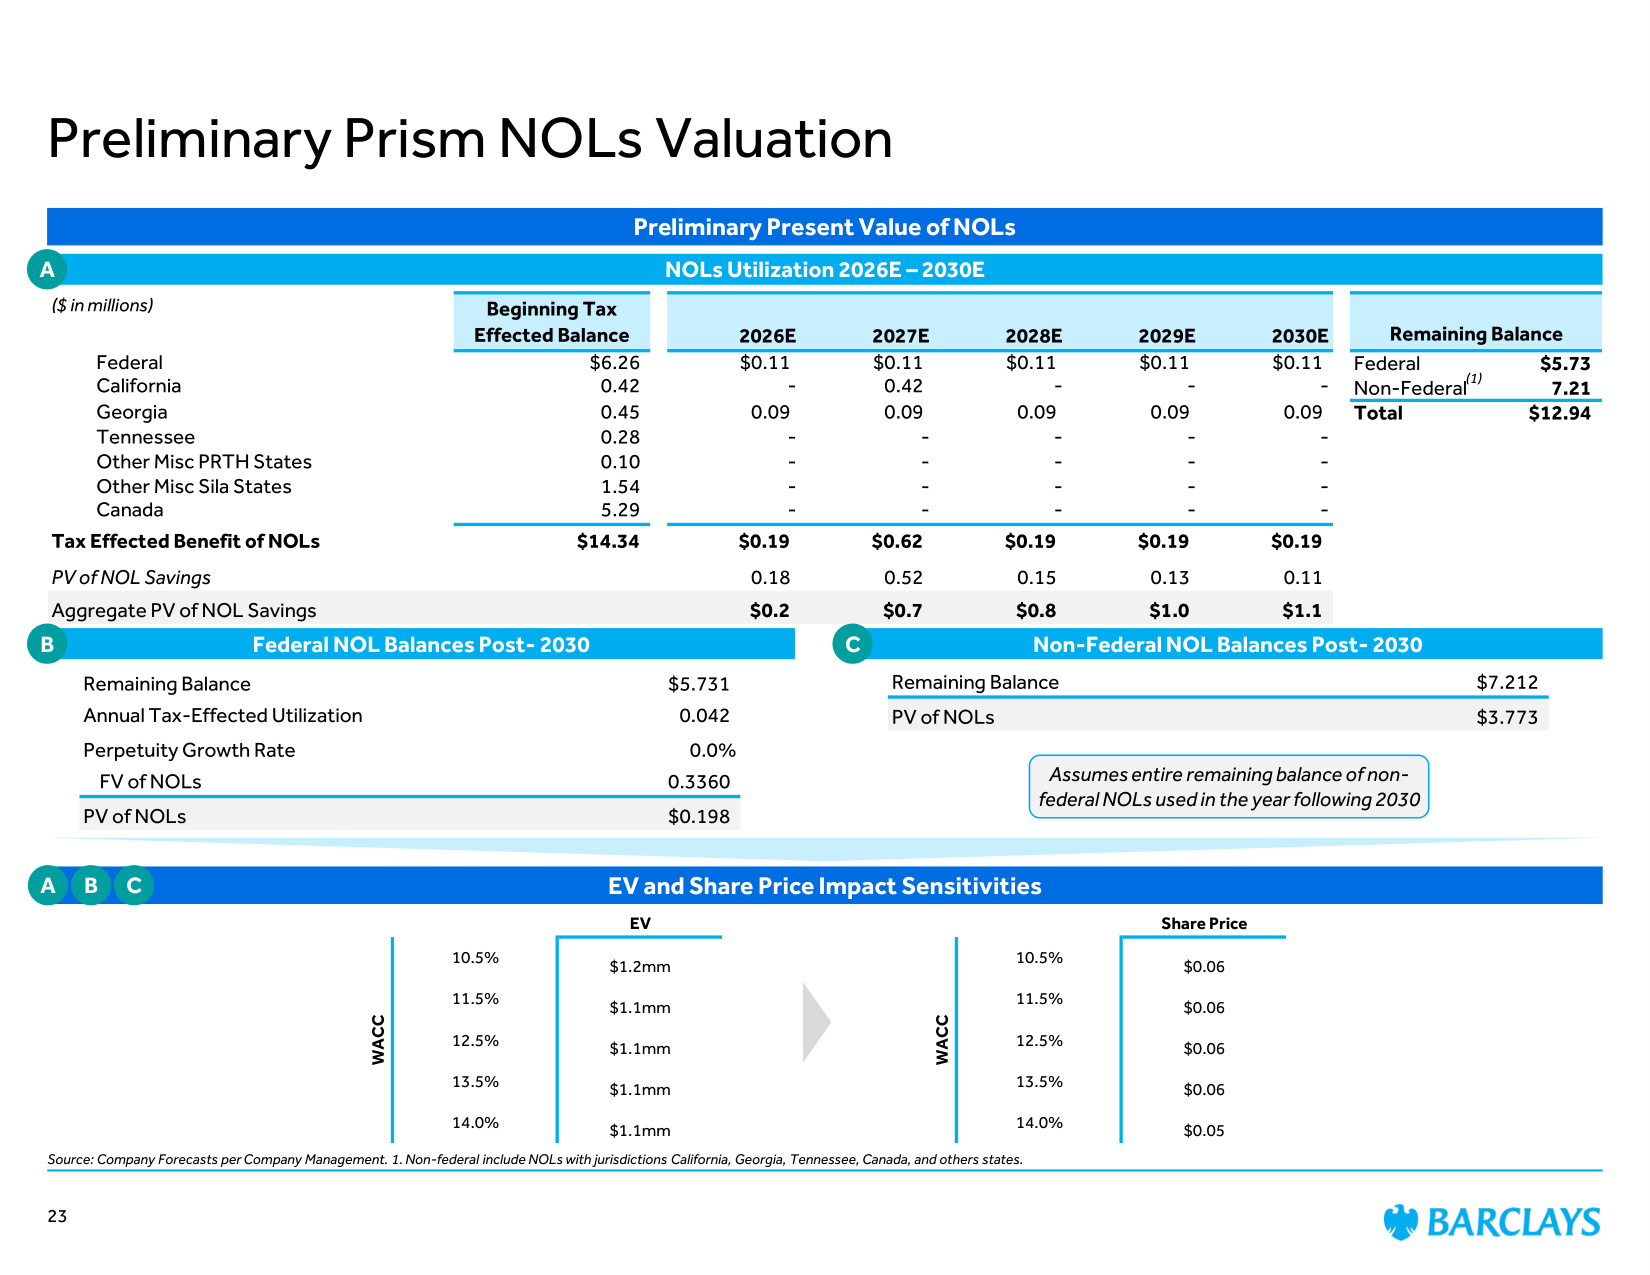
($ in millions) Beginning Tax Effected Balance 2026E 2027E 2028E 2029E 2030E Remaining Balance Federal $6.26 $0.11 $0.11 $0.11 $0.11 $0.11 Federal $5.73 California 0.42 - 0.42 - - - Non-Federal 7.21 Georgia 0.45 0.09 0.09 0.09 0.09 0.09 Total $12.94 Tennessee 0.28 - - - - - Other Misc PRTH States 0.10 - - - - - Other Misc Sila States 1.54 - - - - - Canada 5.29 - - - - - Tax Effected Benefit of NOLs $14.34 $0.19 $0.62 $0.19 $0.19 $0.19 PV of NOL Savings 0.18 0.52 0.15 0.13 0.11 Aggregate PV of NOL Savings $0.2 $0.7 $0.8 $1.0 $1.1 Preliminary Present Value of NOLs EV and Share Price Impact Sensitivities Preliminary Prism NOLs Valuation Source: Company Forecasts per Company Management. 1. Non-federal include NOLs with jurisdictions California, Georgia, Tennessee, Canada, and others states. 23 Remaining Balance $5.731 Annual Tax-Effected Utilization 0.042 Perpetuity Growth Rate 0.0% FV of NOLs 0.3360 PV of NOLs $0.198 NOLs Utilization 2026E – 2030E Federal NOL Balances Post- 2030 Non-Federal NOL Balances Post- 2030 Remaining Balance $7.212 PV of NOLs $3.773 EV Share Price 10.5% $1.2mm 10.5% $0.06 11.5% $1.1mm 11.5% $0.06 12.5% $1.1mm 12.5% $0.06 13.5% $1.1mm 13.5% $0.06 14.0% $1.1mm 14.0% $0.05 WACC WACC Assumes entire remaining balance of non- federal NOLs used in the year following 2030 A B C A B C (1)
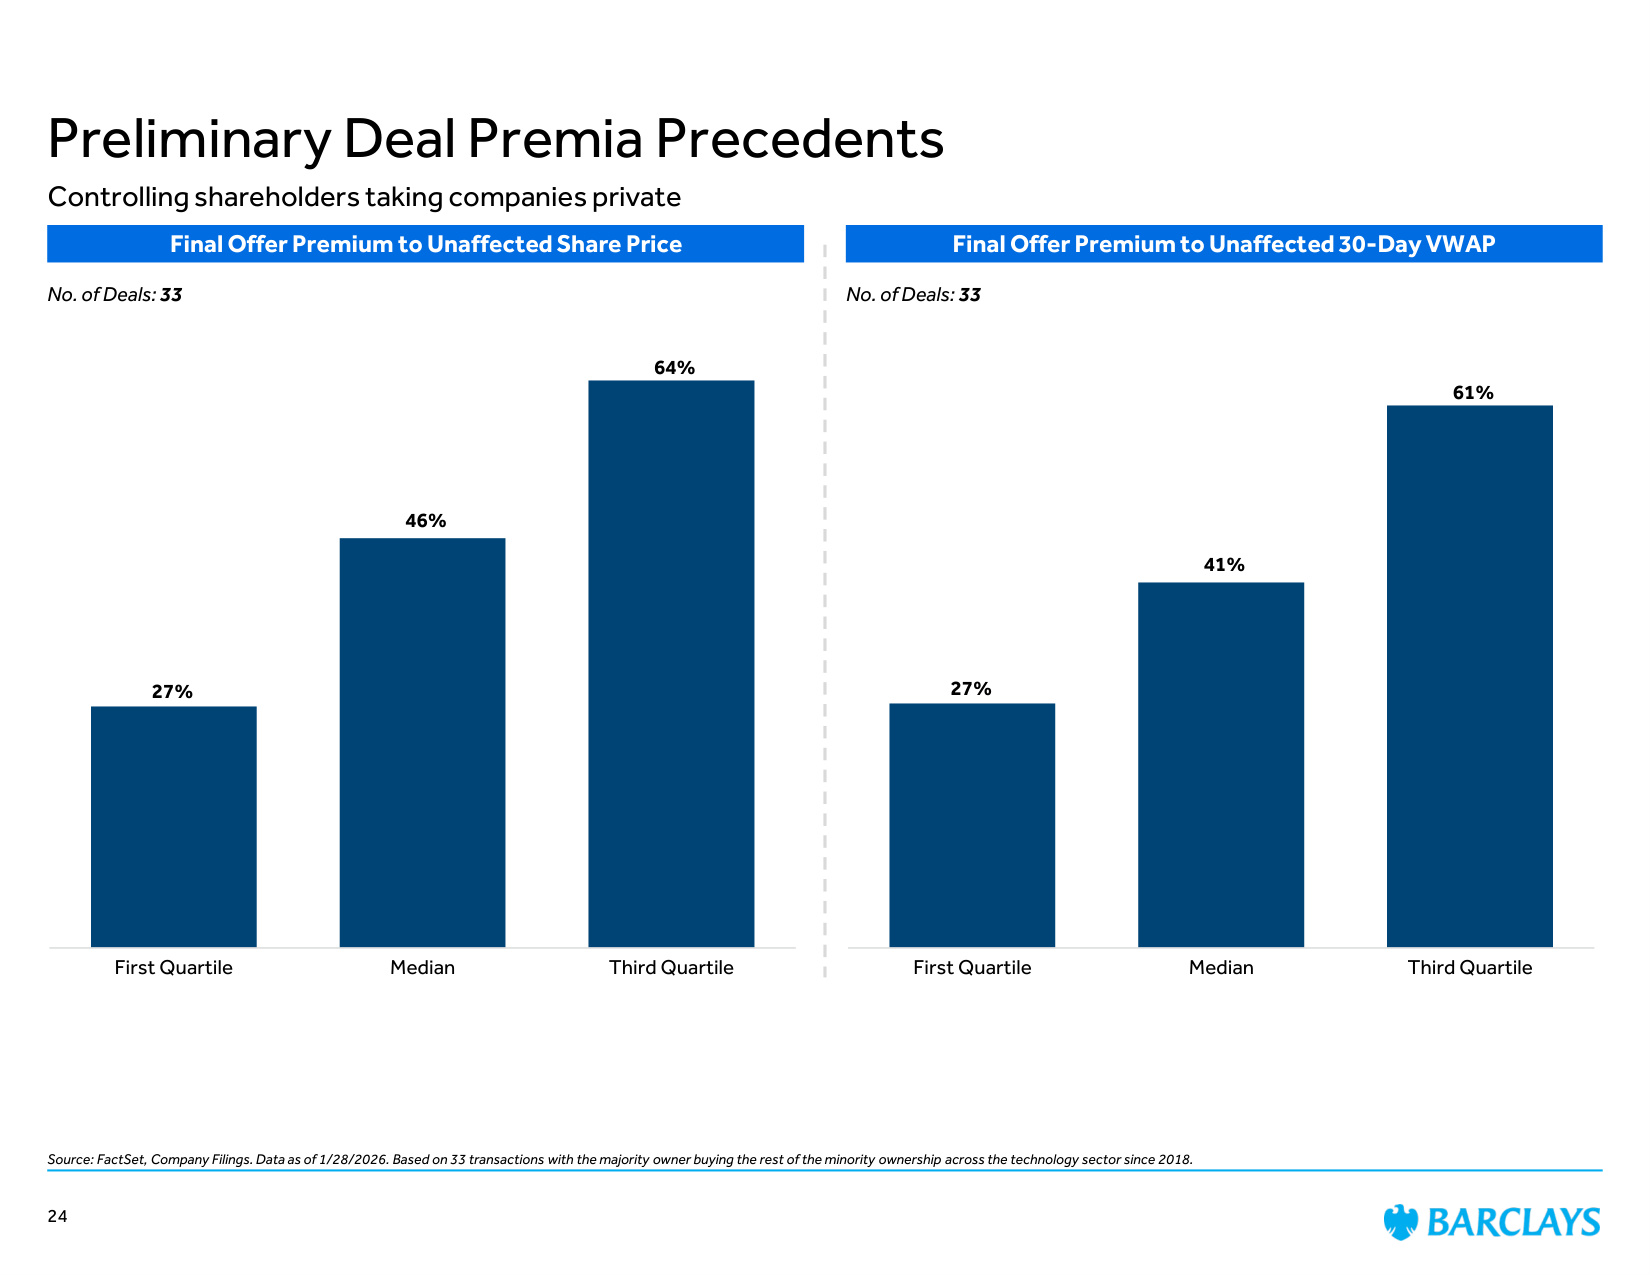
Source: FactSet, Company Filings. Data as of 1/28/2026. Based on 33 transactions with the majority owner buying the rest of the minority ownership across the technology sector since 2018. Controlling shareholders taking companies private 24 Preliminary Deal Premia Precedents 27% 46% 64% First Quartile Median Third Quartile Final Offer Premium to Unaffected Share Price No. of Deals: 33 Final Offer Premium to Unaffected 30-Day VWAP 27% 41% 61% First Quartile Median Third Quartile No. of Deals: 33
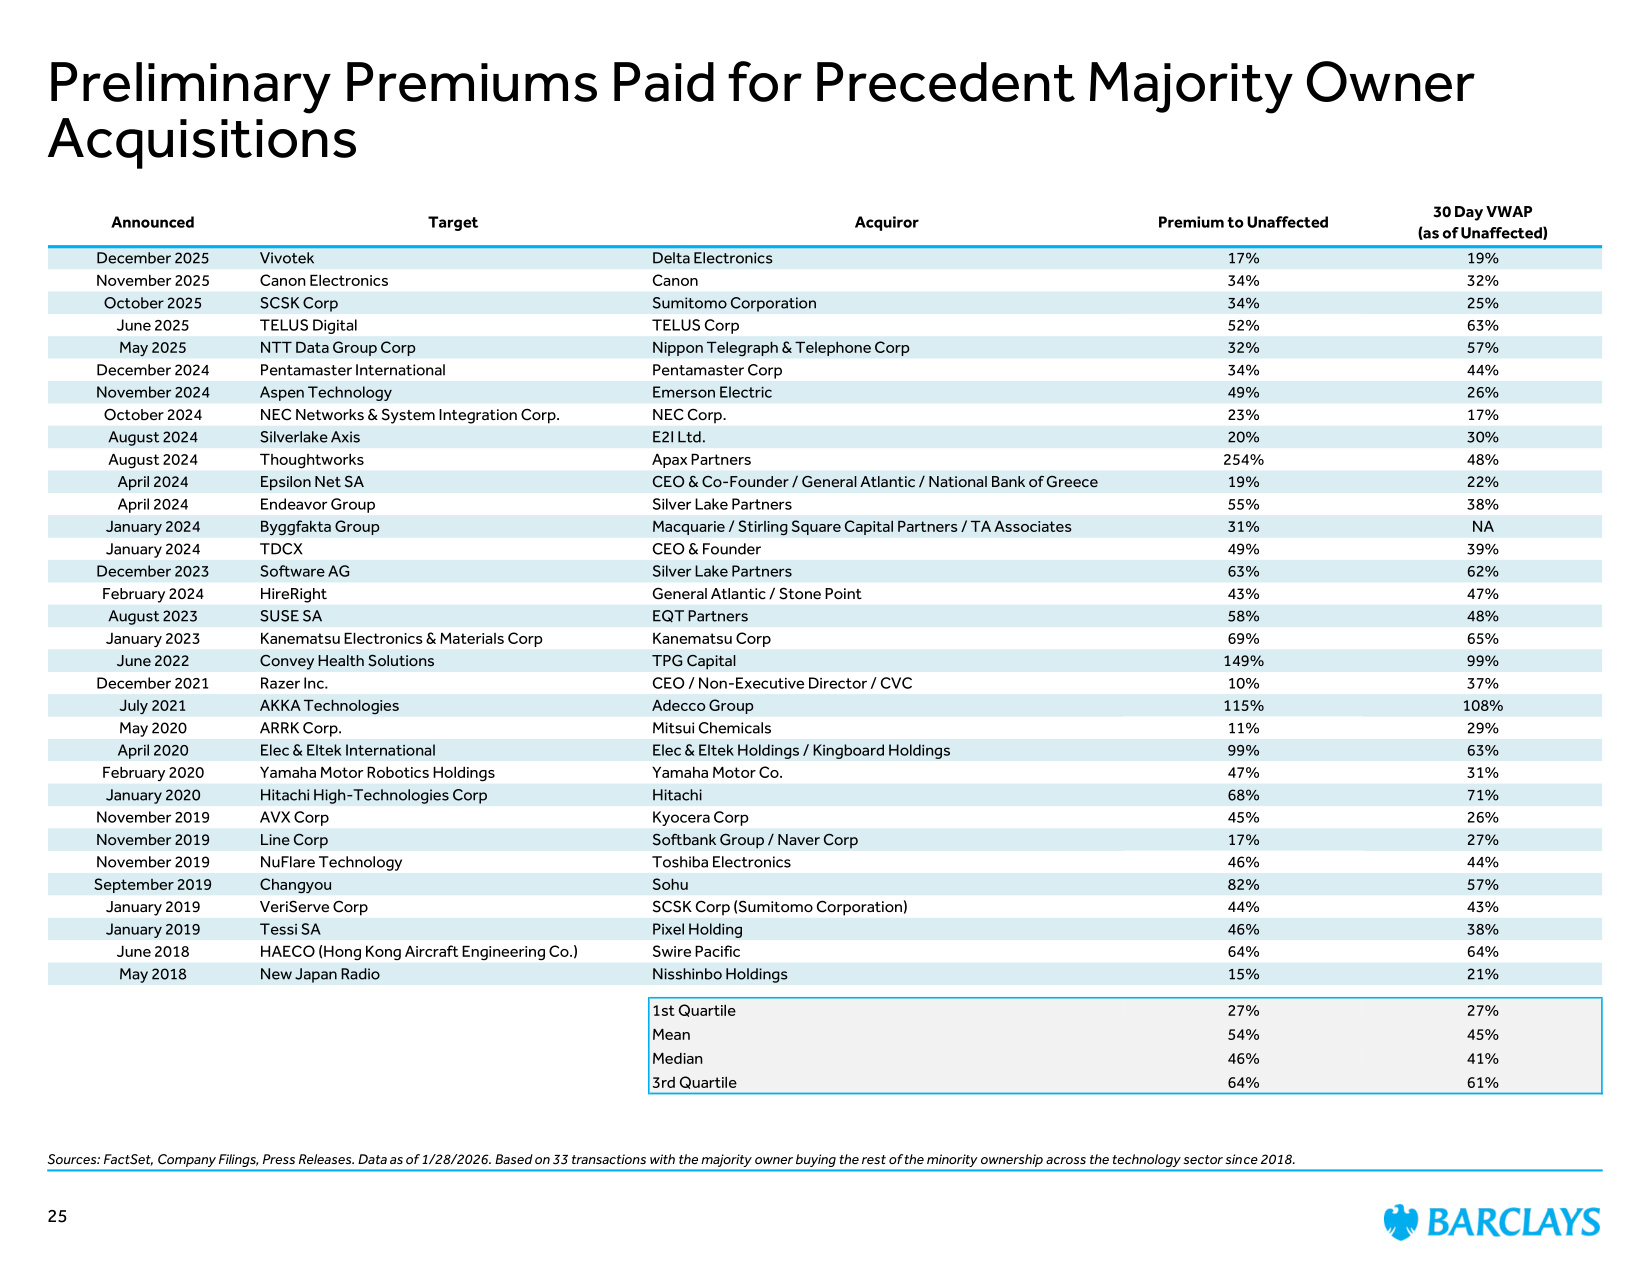
Sources: FactSet, Company Filings, Press Releases. Data as of 1/28/2026. Based on 33 transactions with the majority owner buying the rest of the minority ownership across the technology sector since 2018. Preliminary Premiums Paid for Precedent Majority Owner Acquisitions 25 Announced Target Acquiror Premium to Unaffected 30 Day VWAP (as of Unaffected) December 2025 Vivotek Delta Electronics 17% 19% November 2025 Canon Electronics Canon 34% 32% October 2025 SCSK Corp Sumitomo Corporation 34% 25% June 2025 TELUS Digital TELUS Corp 52% 63% May 2025 NTT Data Group Corp Nippon Telegraph & Telephone Corp 32% 57% December 2024 Pentamaster International Pentamaster Corp 34% 44% November 2024 Aspen Technology Emerson Electric 49% 26% October 2024 NEC Networks & System Integration Corp. NEC Corp. 23% 17% August 2024 Silverlake Axis E2I Ltd. 20% 30% August 2024 Thoughtworks Apax Partners 254% 48% April 2024 Epsilon Net SA CEO & Co-Founder / General Atlantic / National Bank of Greece 19% 22% April 2024 Endeavor Group Silver Lake Partners 55% 38% January 2024 Byggfakta Group Macquarie / Stirling Square Capital Partners / TA Associates 31% NA January 2024 TDCX CEO & Founder 49% 39% December 2023 Software AG Silver Lake Partners 63% 62% February 2024 HireRight General Atlantic / Stone Point 43% 47% August 2023 SUSE SA EQT Partners 58% 48% January 2023 Kanematsu Electronics & Materials Corp Kanematsu Corp 69% 65% June 2022 Convey Health Solutions TPG Capital 149% 99% December 2021 Razer Inc. CEO / Non-Executive Director / CVC 10% 37% July 2021 AKKA Technologies Adecco Group 115% 108% May 2020 ARRK Corp. Mitsui Chemicals 11% 29% April 2020 Elec & Eltek International Elec & Eltek Holdings / Kingboard Holdings 99% 63% February 2020 Yamaha Motor Robotics Holdings Yamaha Motor Co. 47% 31% January 2020 Hitachi High-Technologies Corp Hitachi 68% 71% November 2019 AVX Corp Kyocera Corp 45% 26% November 2019 Line Corp Softbank Group / Naver Corp 17% 27% November 2019 NuFlare Technology Toshiba Electronics 46% 44% September 2019 Changyou Sohu 82% 57% January 2019 VeriServe Corp SCSK Corp (Sumitomo Corporation) 44% 43% January 2019 Tessi SA Pixel Holding 46% 38% June 2018 HAECO (Hong Kong Aircraft Engineering Co.) Swire Pacific 64% 64% May 2018 New Japan Radio Nisshinbo Holdings 15% 21% 1st Quartile 27% 27% Mean 54% 45% Median 46% 41% 3rd Quartile 64% 61%
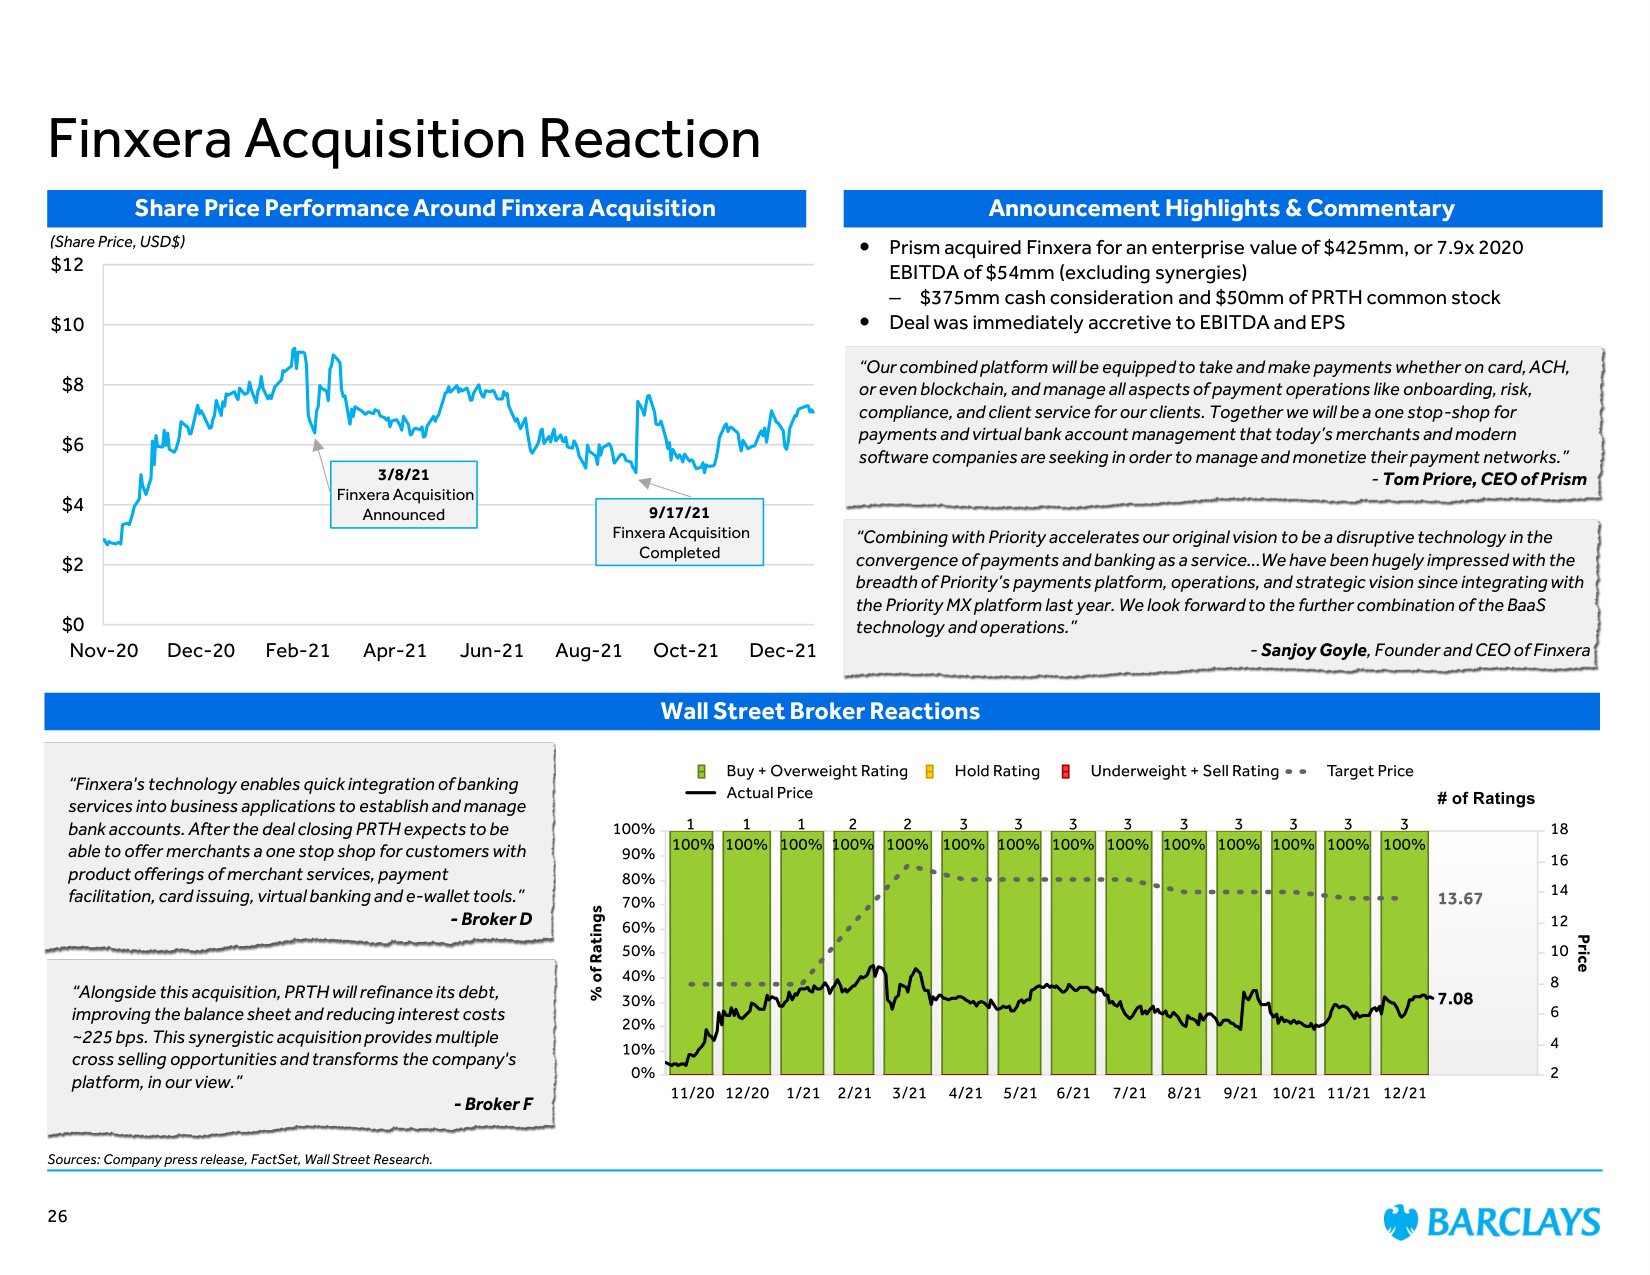
Sources: Company press release, FactSet, Wall Street Research. Finxera Acquisition Reaction Share Price Performance Around Finxera Acquisition (Share Price, USD$) Announcement Highlights & Commentary Wall Street Broker Reactions $0 $2 $4 $6 $8 $10 $12 Nov-20 Dec-20 Feb-21 Apr-21 Jun-21 Aug-21 Oct-21 Dec-21 3/8/21 Finxera Acquisition Announced 9/17/21 Finxera Acquisition Completed "Our combined platform will be equipped to take and make payments whether on card, ACH, or even blockchain, and manage all aspects of payment operations like onboarding, risk, compliance, and client service for our clients. Together we will be a one stop-shop for payments and virtual bank account management that today's merchants and modern software companies are seeking in order to manage and monetize their payment networks." - Tom Priore, CEO of Prism Prism acquired Finxera for an enterprise value of $425mm, or 7.9x 2020 EBITDA of $54mm (excluding synergies) – $375mm cash consideration and $50mm of PRTH common stock Deal was immediately accretive to EBITDA and EPS "Combining with Priority accelerates our original vision to be a disruptive technology in the convergence of payments and banking as a service...We have been hugely impressed with the breadth of Priority's payments platform, operations, and strategic vision since integrating with the Priority MX platform last year. We look forward to the further combination of the BaaS technology and operations." - Sanjoy Goyle, Founder and CEO of Finxera "Finxera's technology enables quick integration of banking services into business applications to establish and manage bank accounts. After the deal closing PRTH expects to be able to offer merchants a one stop shop for customers with product offerings of merchant services, payment facilitation, card issuing, virtual banking and e-wallet tools." - Broker D "Alongside this acquisition, PRTH will refinance its debt, improving the balance sheet and reducing interest costs ~225 bps. This synergistic acquisition provides multiple cross selling opportunities and transforms the company's platform, in our view." - Broker F 26
The following pages contain material that was provided to the Board of Directors (the "Board") of Prism (the "Company") by Barclays Capital Inc. ("Barclays"). The accompanying material and any Barclays presentation related to the material was compiled or prepared on a confidential basis solely for consideration by the Board and no part of it may be reproduced, distributed or transmitted without the prior written consent of Barclays. The information contained in this material was obtained from the Company and/or publicly available sources, and Barclays has relied upon such information without independent verification thereof and does not assume any liability for any such information. These materials are being provided in connection with an actual corporate engagement and may not be used or relied upon for any purpose other than as specifically contemplated by a written agreement with Barclays. Moreover, any information provided herein was not prepared for or intended for use by any individual for personal, family or household purposes. Any estimates, historical financial information, projections and other information contained herein have been prepared by management of the Company or were obtained from publicly available sources (approved for Barclays' use by the Company) or are based upon such estimates and projections. With respect to such estimates and projections, Barclays has assumed that they have been reasonably prepared on a basis reflecting the best currently available estimates, projections and judgment of the management of the Company. The projections contained herein may or may not be achieved and differences between projected results and those actually achieved may be material. No representation or warranty, expressed or implied, is made as to the accuracy or completeness of such information and nothing contained herein is, or shall be relied upon as, a promise or representation, whether as to the past or the future. The analysis contained herein is based on current market conditions which are subject to change and Barclays assumes no obligation to update or otherwise revise these materials. Nothing in these materials shall be deemed to constitute a recommendation or investment, legal, tax, financial, accounting or other advice. Because these materials were prepared for use in the context of a presentation to the Board, these materials are incomplete without reference to, and should be assessed solely in conjunction with, the oral briefing provided by Barclays to the Board (in their capacity as directors and not in any individual capacity and is not for the benefit of any individual, including any individual officer, director, shareholder or any other person). These materials were not prepared for or intended for use by any individual for personal, family or household purposes nor were they prepared to comply with the disclosure standards under state and federal securities laws or any other applicable laws and, to the extent the material may be considered by readers not as familiar with the business and affairs of the Company as the Board, none of the Company, Barclays, their respective affiliates or any of their respective legal or financial advisors or accountants takes any responsibility for the accuracy or completeness of any of the material if used by persons other than the Board. These materials are not intended to provide the sole basis for evaluation of the proposed corporate transaction and do not purport to contain all information that may be required and should not be considered a recommendation with respect to the proposed corporate transaction. Barclays has not made or obtained any evaluations or appraisals of the assets or liabilities of the Company or any other party to any corporate transaction or any of their respective affiliates and has no obligation to evaluate the solvency of the Company or any other party to any transaction under any state or federal laws relating to bankruptcy, insolvency or similar matters. The analyses contained herein do not purport to be appraisals nor do they necessarily reflect the prices at which businesses or securities actually may be sold or purchased. Barclays' role in any due diligence review is limited solely to performing such a review as it shall deem necessary to support its own advice and analysis and shall not be on behalf of the Company, the Board or any individual officer, director, shareholder or any other person. Barclays, its subsidiaries and affiliates engage in a wide range of businesses from investment and commercial banking, lending, asset management and other financial and non-financial services. In the ordinary course of its business, Barclays and its affiliates may actively trade and effect transactions in the equity, debt and/or other securities (and any derivatives thereof) and financial instruments (including loans and other obligations) of the Company for its own account and for the accounts of its customers and, accordingly, may at any time hold long or short positions and investments in such securities and financial instruments or in other financial products and instruments. Unless otherwise expressly agreed or provided for in other applicable Barclays disclosures governing such corporate transactions or required by law or regulation, Barclays conducts these activities as principal and executes its principal transactions as an arm's length counterparty. Barclays does not act as a fiduciary in relation to these corporate transactions. These materials do not constitute investment advice nor do they form part of an offer to sell or purchase, or the solicitation of an offer to sell or purchase, any securities or any of the businesses or assets described herein or an offer of financing or an offer or recommendation to enter into any corporate transaction described herein. Barclays Capital Inc. is the United States investment bank of Barclays Bank PLC. Barclays Bank PLC is authorised by the Prudential Regulation Authority and regulated by the Financial Conduct Authority and the Prudential Regulation Authority (Financial Services Register No. 122702). Registered in England. Registered No. 1026167. Registered office: 1 Churchill Place, London E14 5HP. Neither Barclays Bank PLC, New York Branch nor Barclays Bank Delaware is responsible for the obligations of its affiliates. Copyright Barclays Bank PLC, 2026 (all rights reserved). Disclaimer 27
Exhibit (C)(3)
Project Prism: Preliminary Valuation Analysis February 2026
Contents 1. Market Backdrop and Trading Performance 2. Review of Company Financials & Forecasts 3. Preliminary Valuation Perspectives 4. Appendix
Market Backdrop and Trading Performance
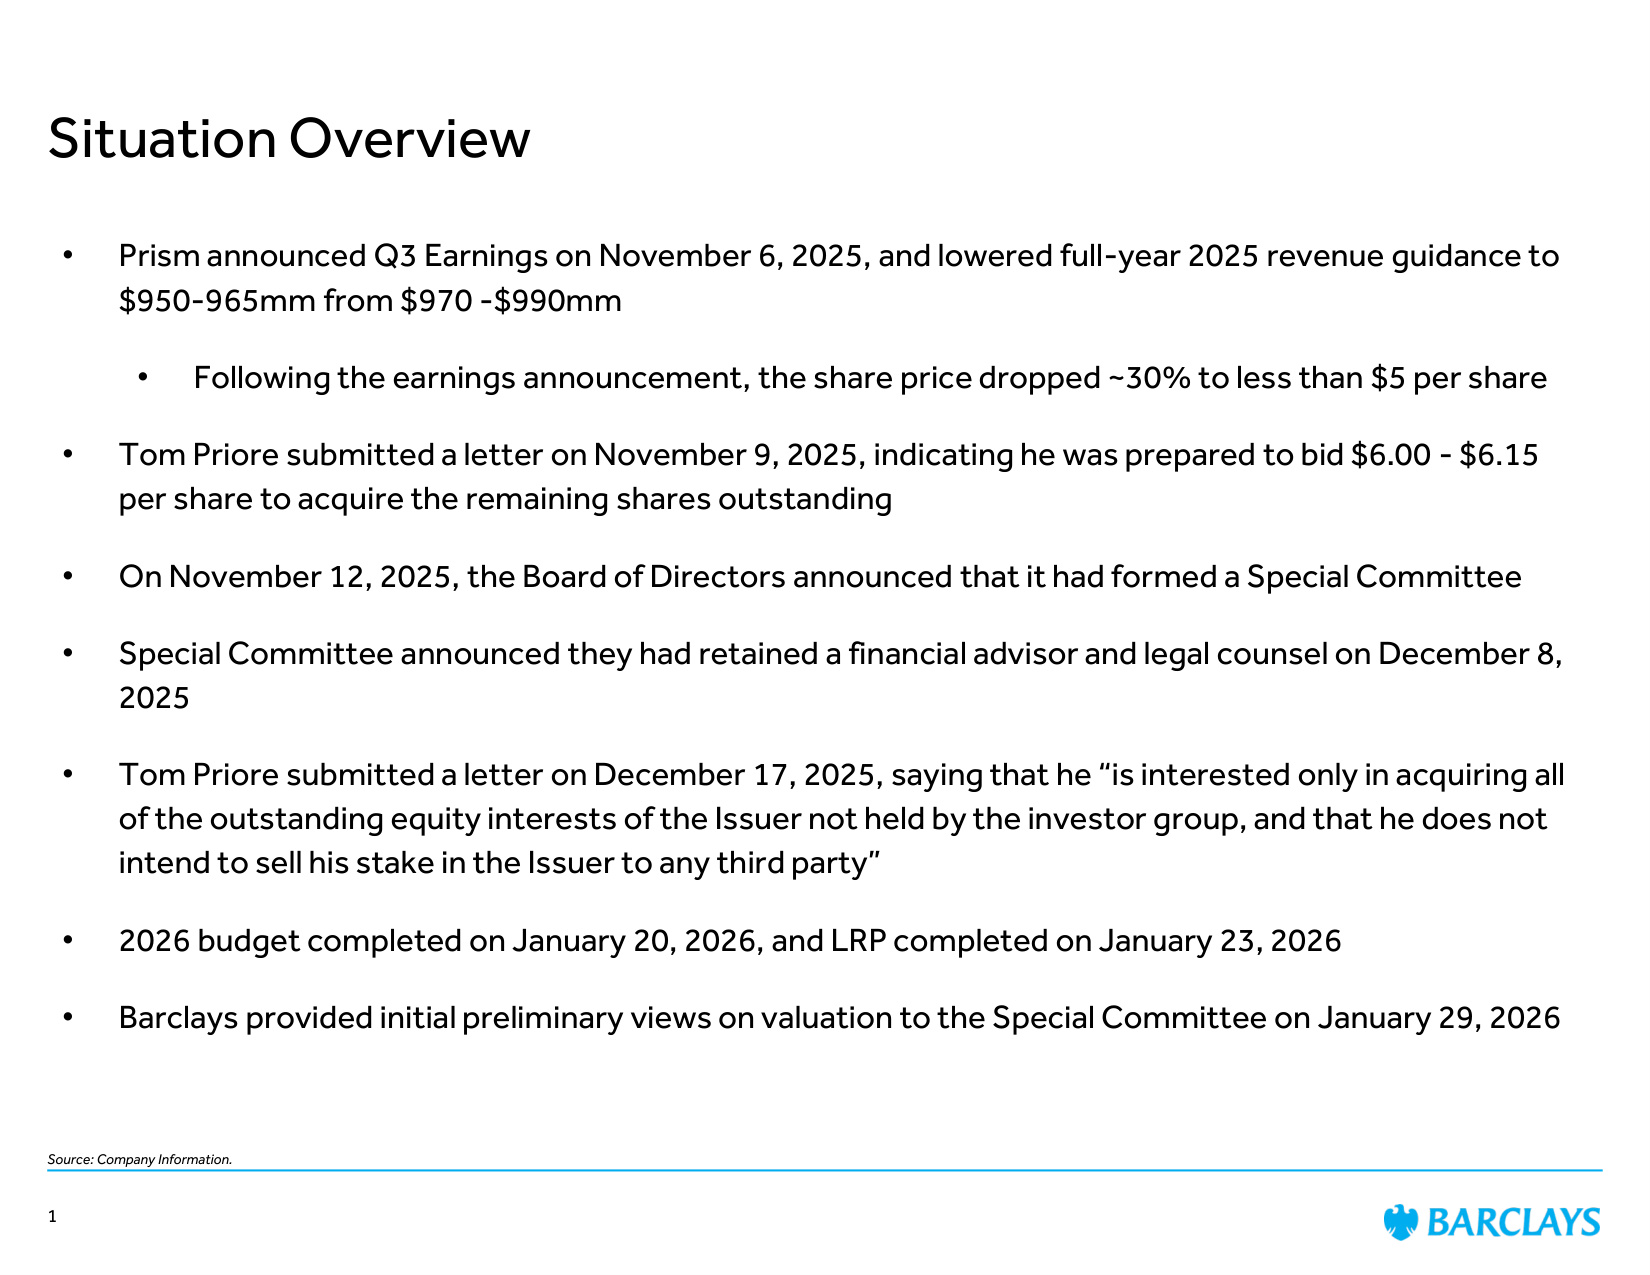
Source: Company Information. Situation Overview 1 • Prism announced Q3 Earnings on November 6, 2025, and lowered full-year 2025 revenue guidance to $950-965mm from $970 -$990mm • Following the earnings announcement, the share price dropped ~30% to less than $5 per share • Tom Priore submitted a letter on November 9, 2025, indicating he was prepared to bid $6.00 - $6.15 per share to acquire the remaining shares outstanding • On November 12, 2025, the Board of Directors announced that it had formed a Special Committee • Special Committee announced they had retained a financial advisor and legal counsel on December 8, 2025 • Tom Priore submitted a letter on December 17, 2025, saying that he "is interested only in acquiring all of the outstanding equity interests of the Issuer not held by the investor group, and that he does not intend to sell his stake in the Issuer to any third party" • 2026 budget completed on January 20, 2026, and LRP completed on January 23, 2026 • Barclays provided initial preliminary views on valuation to the Special Committee on January 29, 2026
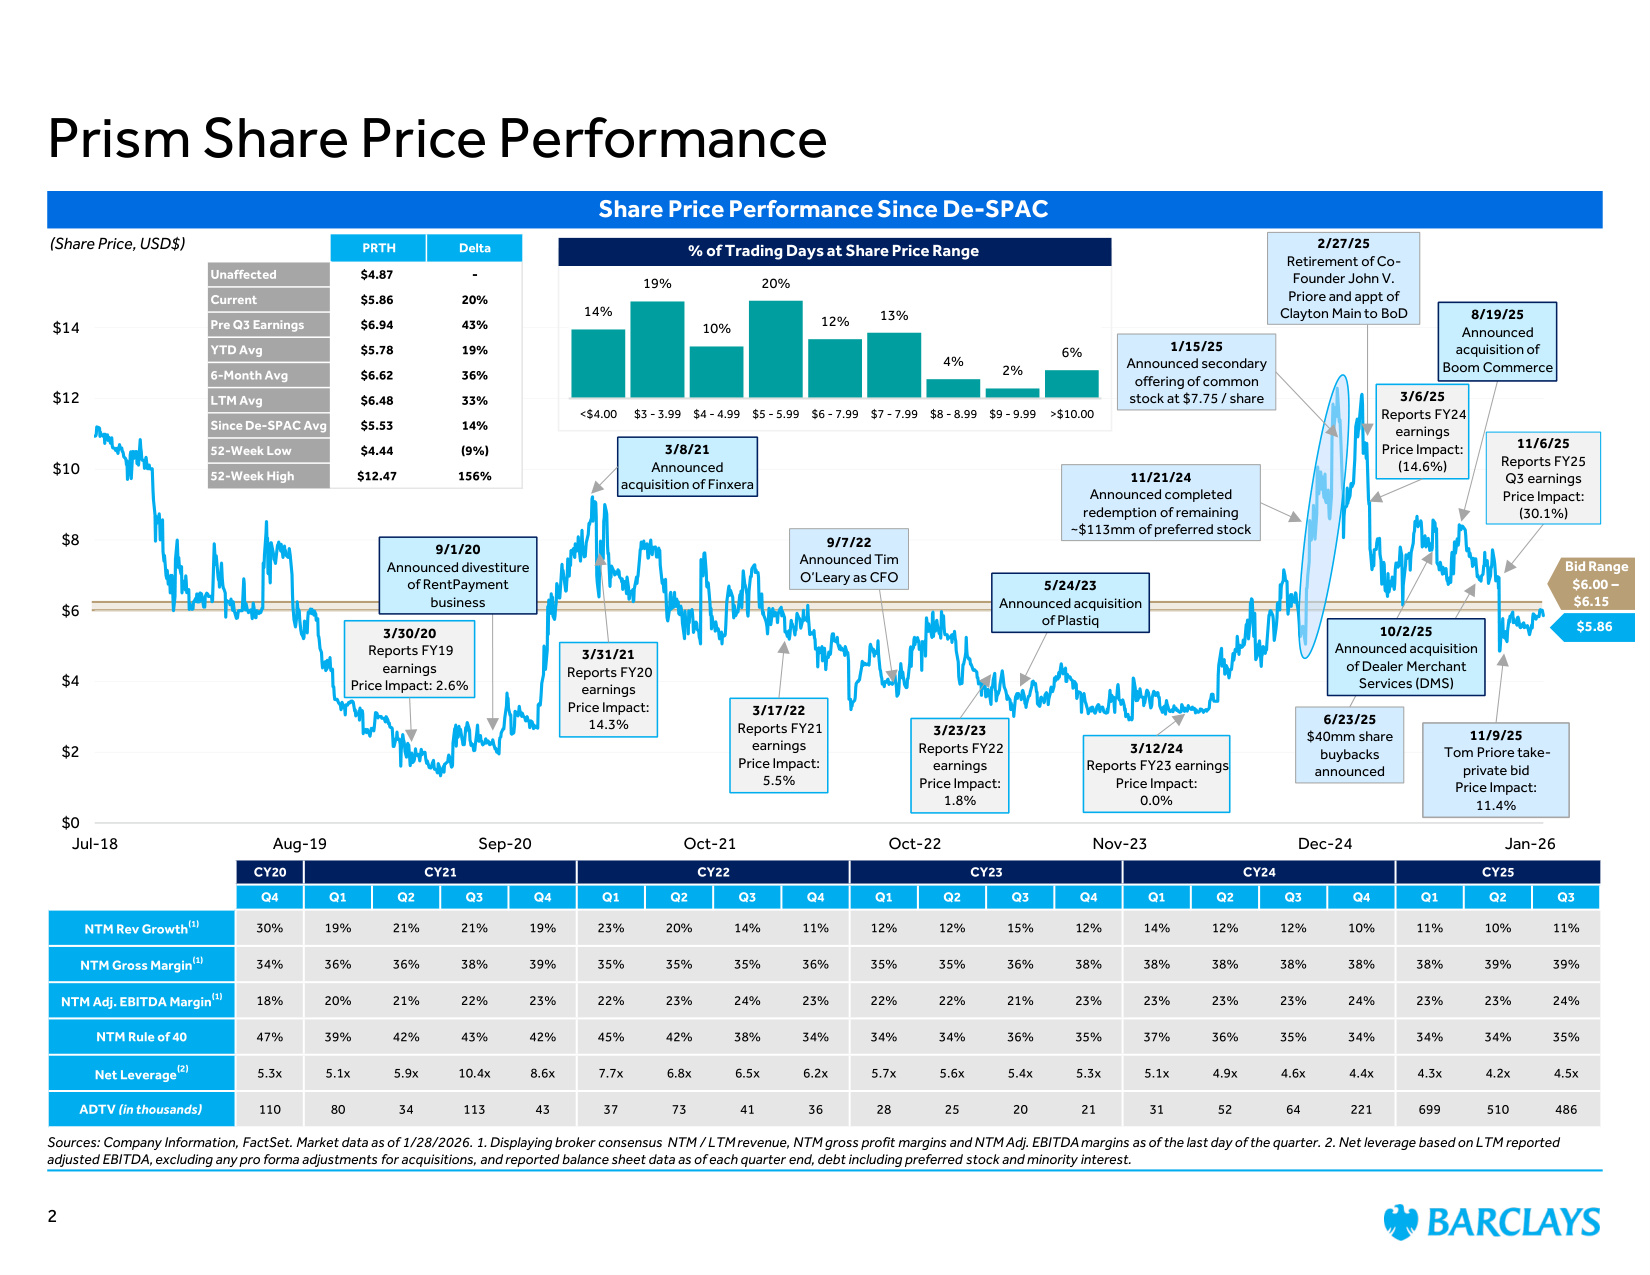
$0 $2 $4 $6 $8 $10 $12 $14 Jul-18 Aug-19 Sep-20 Oct-21 Oct-22 Nov-23 Dec-24 Jan-26 Sources: Company Information, FactSet. Market data as of 1/28/2026. 1. Displaying broker consensus NTM / LTM revenue, NTM gross profit margins and NTM Adj. EBITDA margins as of the last day of the quarter. 2. Net leverage based on LTM reported adjusted EBITDA, excluding any pro forma adjustments for acquisitions, and reported balance sheet data as of each quarter end, debt including preferred stock and minority interest. Prism Share Price Performance Share Price Performance Since De-SPAC (Share Price, USD$) 6/23/25 $40mm share buybacks announced 3/17/22 Reports FY21 earnings Price Impact: 5.5% $5.86 3/23/23 Reports FY22 earnings Price Impact: 1.8% 3/12/24 Reports FY23 earnings Price Impact: 0.0% 2/27/25 Retirement of Co- Founder John V. Priore and appt of Clayton Main to BoD 1/15/25 Announced secondary offering of common stock at $7.75 / share 11/9/25 Tom Priore take- private bid Price Impact: 11.4% Bid Range $6.00 – $6.15 CY20 CY21 CY22 CY23 CY24 CY25 Q4 Q1 Q2 Q3 Q4 Q1 Q2 Q3 Q4 Q1 Q2 Q3 Q4 Q1 Q2 Q3 Q4 Q1 Q2 Q3 NTM Rev Growth(1) 30% 19% 21% 21% 19% 23% 20% 14% 11% 12% 12% 15% 12% 14% 12% 12% 10% 11% 10% 11% NTM Gross Margin(1) 34% 36% 36% 38% 39% 35% 35% 35% 36% 35% 35% 36% 38% 38% 38% 38% 38% 38% 39% 39% NTM Adj. EBITDA Margin(1) 18% 20% 21% 22% 23% 22% 23% 24% 23% 22% 22% 21% 23% 23% 23% 23% 24% 23% 23% 24% NTM Rule of 40 47% 39% 42% 43% 42% 45% 42% 38% 34% 34% 34% 36% 35% 37% 36% 35% 34% 34% 34% 35% Net Leverage(2) 5.3x 5.1x 5.9x 10.4x 8.6x 7.7x 6.8x 6.5x 6.2x 5.7x 5.6x 5.4x 5.3x 5.1x 4.9x 4.6x 4.4x 4.3x 4.2x 4.5x ADTV (in thousands) 110 80 34 113 43 37 73 41 36 28 25 20 21 31 52 64 221 699 510 486 PRTH Delta Unaffected $4.87 - Current $5.86 20% Pre Q3 Earnings $6.94 43% YTD Avg $5.78 19% 6-Month Avg $6.62 36% LTM Avg $6.48 33% Since De-SPAC Avg $5.53 14% 52-Week Low $4.44 (9%) 52-Week High $12.47 156% 11/21/24 Announced completed redemption of remaining ~$113mm of preferred stock 2 3/8/21 Announced acquisition of Finxera 9/7/22 Announced Tim O'Leary as CFO 5/24/23 Announced acquisition of Plastiq 8/19/25 Announced acquisition of Boom Commerce 10/2/25 Announced acquisition of Dealer Merchant Services (DMS) 3/31/21 Reports FY20 earnings Price Impact: 14.3% 3/30/20 Reports FY19 earnings Price Impact: 2.6% 9/1/20 Announced divestiture of RentPayment business 14% 19% 10% 20% 12% 13% 4% 2% 6% <$4.00 $3 - 3.99 $4 - 4.99 $5 - 5.99 $6 - 7.99 $7 - 7.99 $8 - 8.99 $9 - 9.99 >$10.00 % of Trading Days at Share Price Range 3/6/25 Reports FY24 earnings Price Impact: (14.6%) 11/6/25 Reports FY25 Q3 earnings Price Impact: (30.1%)
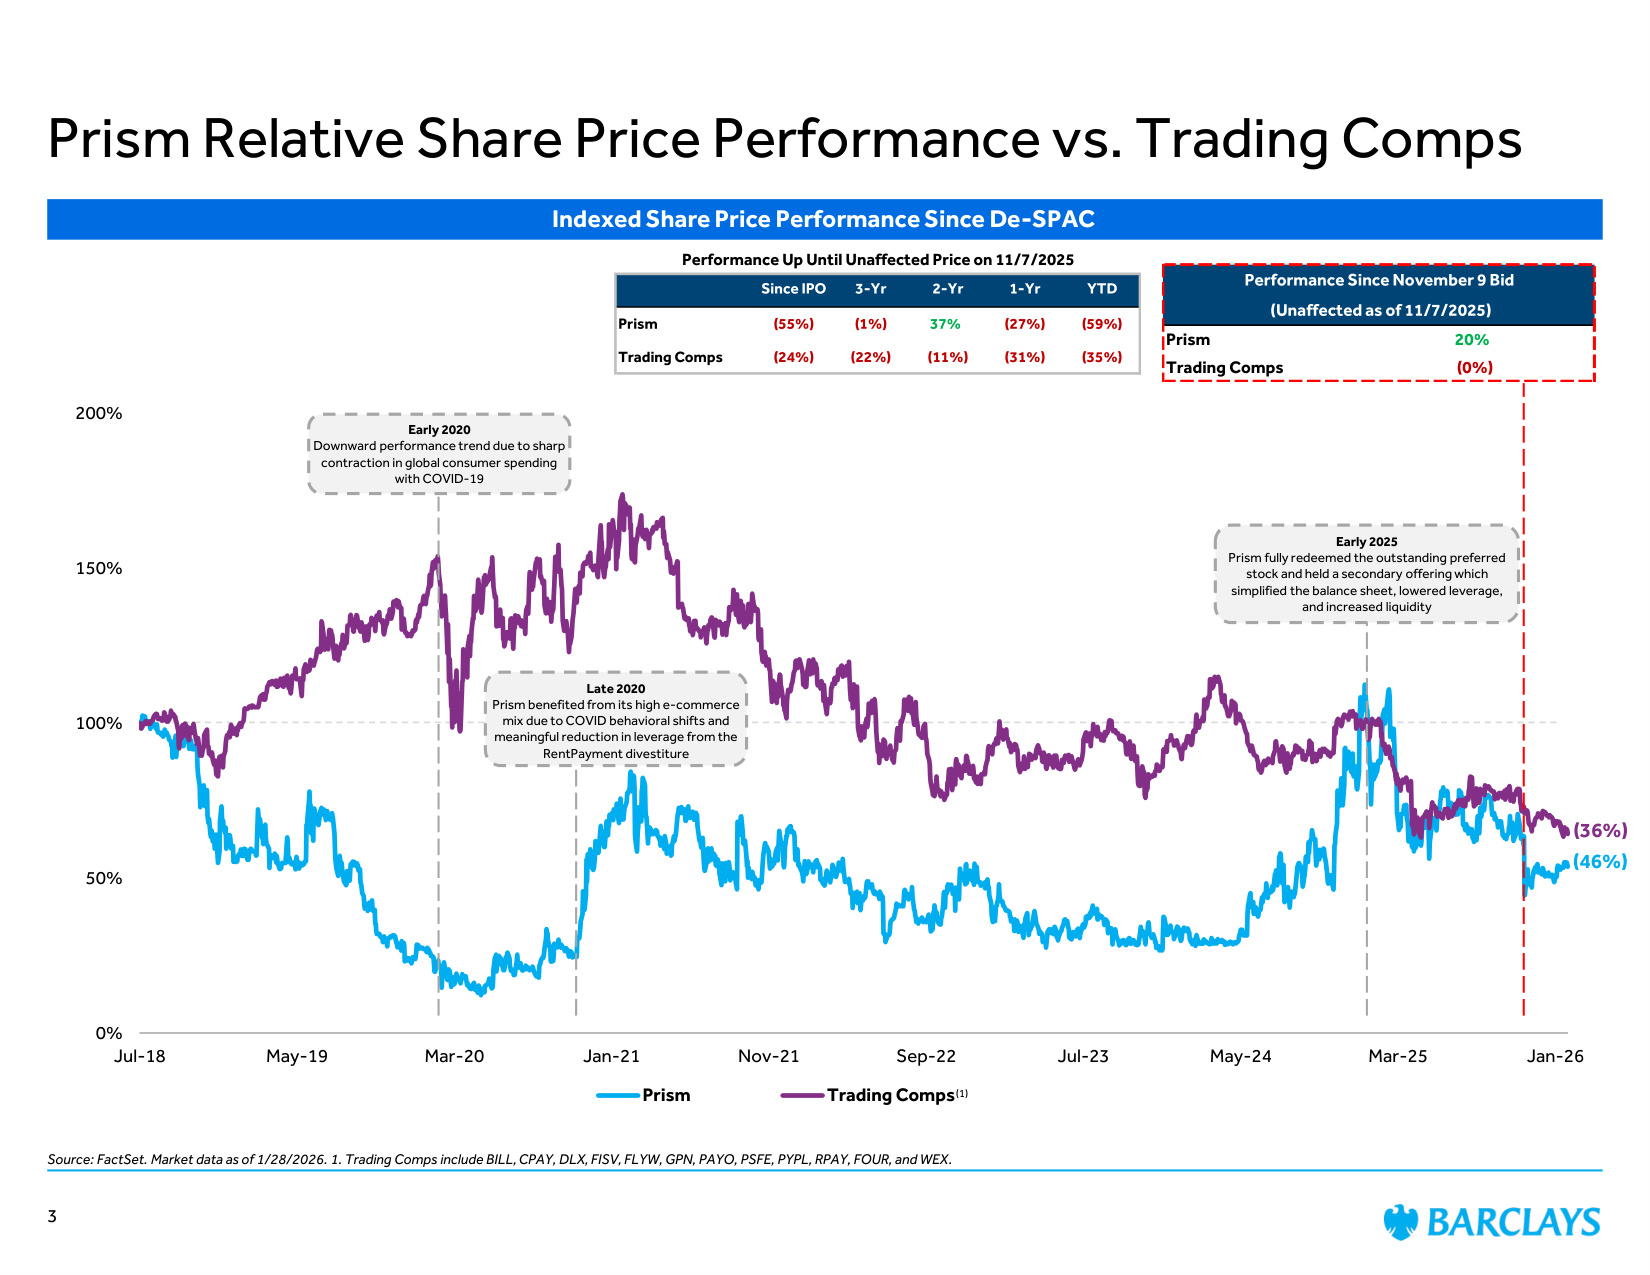
Indexed Share Price Performance Since De-SPAC 0% 50% 100% 150% 200% Jul-18 May-19 Mar-20 Jan-21 Nov-21 Sep-22 Jul-23 May-24 Mar-25 Jan-26 Prism Trading Comps (36%) (46%) (1) Performance Since November 9 Bid (Unaffected as of 11/7/2025) Prism 20% Trading Comps (0%) Performance Up Until Unaffected Price on 11/7/2025 Since IPO 3-Yr 2-Yr 1-Yr YTD Prism (55%) (1%) 37% (27%) (59%) Trading Comps (24%) (22%) (11%) (31%) (35%) Prism Relative Share Price Performance vs. Trading Comps Source: FactSet. Market data as of 1/28/2026. 1. Trading Comps include BILL, CPAY, DLX, FISV, FLYW, GPN, PAYO, PSFE, PYPL, RPAY, FOUR, and WEX. Early 2020 Downward performance trend due to sharp contraction in global consumer spending with COVID-19 3 Early 2025 Prism fully redeemed the outstanding preferred stock and held a secondary offering which simplified the balance sheet, lowered leverage, and increased liquidity Late 2020 Prism benefited from its high e-commerce mix due to COVID behavioral shifts and meaningful reduction in leverage from the RentPayment divestiture
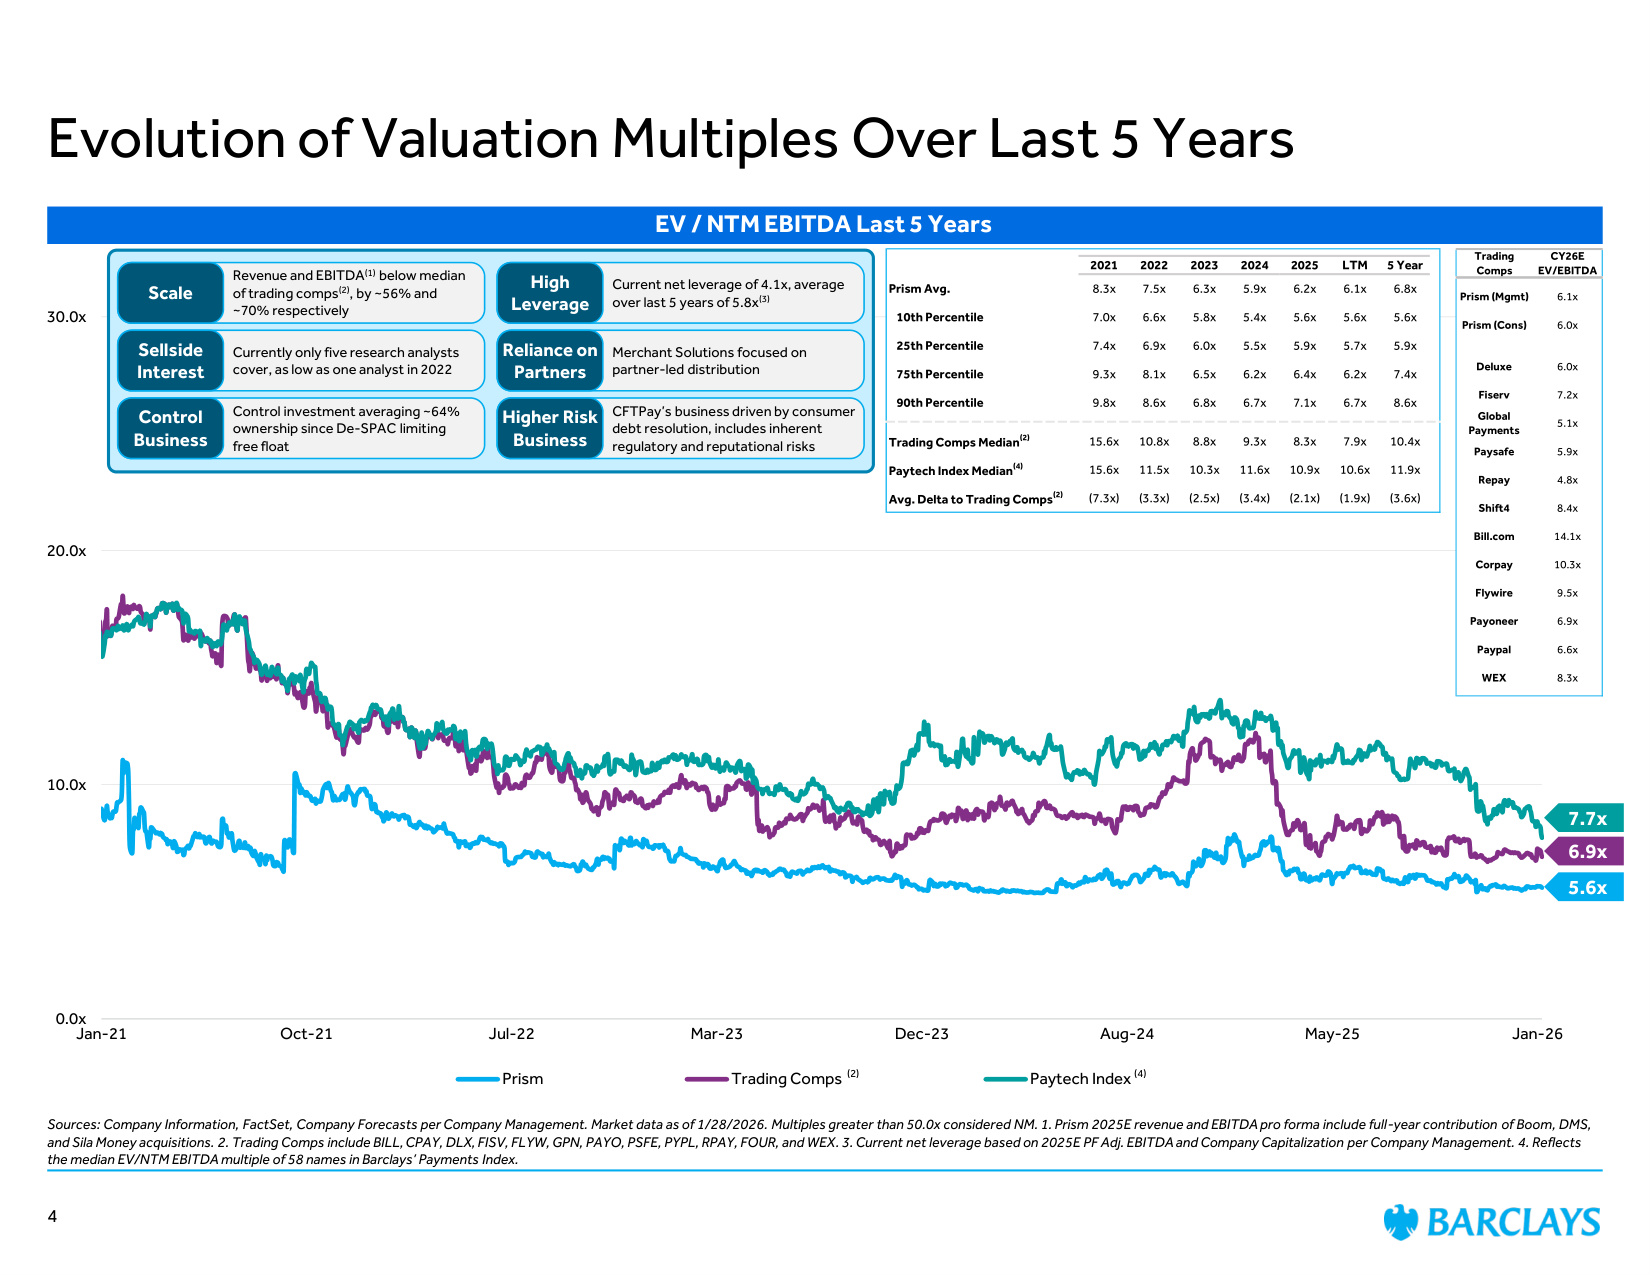
Sources: Company Information, FactSet, Company Forecasts per Company Management. Market data as of 1/28/2026. Multiples greater than 50.0x considered NM. 1. Prism 2025E revenue and EBITDA pro forma include full-year contribution of Boom, DMS, and Sila Money acquisitions. 2. Trading Comps include BILL, CPAY, DLX, FISV, FLYW, GPN, PAYO, PSFE, PYPL, RPAY, FOUR, and WEX. 3. Current net leverage based on 2025E PF Adj. EBITDA and Company Capitalization per Company Management. 4. Reflects the median EV/NTM EBITDA multiple of 58 names in Barclays' Payments Index. Evolution of Valuation Multiples Over Last 5 Years 0.0x 10.0x 20.0x 30.0x Jan-21 Oct-21 Jul-22 Mar-23 Dec-23 Aug-24 May-25 Jan-26 Prism Trading Comps Paytech Index 5.6x (2) EV / NTM EBITDA Last 5 Years 2021 2022 2023 2024 2025 LTM 5 Year Prism Avg. 8.3x 7.5x 6.3x 5.9x 6.2x 6.1x 6.8x 10th Percentile 7.0x 6.6x 5.8x 5.4x 5.6x 5.6x 5.6x 25th Percentile 7.4x 6.9x 6.0x 5.5x 5.9x 5.7x 5.9x 75th Percentile 9.3x 8.1x 6.5x 6.2x 6.4x 6.2x 7.4x 90th Percentile 9.8x 8.6x 6.8x 6.7x 7.1x 6.7x 8.6x Trading Comps Median(2) 15.6x 10.8x 8.8x 9.3x 8.3x 7.9x 10.4x Paytech Index Median(4) 15.6x 11.5x 10.3x 11.6x 10.9x 10.6x 11.9x Avg. Delta to Trading Comps(2) (7.3x) (3.3x) (2.5x) (3.4x) (2.1x) (1.9x) (3.6x) 6.9x Control investment averaging ~64% ownership since De-SPAC limiting free float Control Business Current net leverage of 4.1x, average over last 5 years of 5.8x(3) High Leverage Currently only five research analysts cover, as low as one analyst in 2022 Sellside Interest Merchant Solutions focused on partner-led distribution Reliance on Partners 7.7x (4) Revenue and EBITDA(1) below median of trading comps(2), by ~56% and ~70% respectively Scale CFTPay's business driven by consumer debt resolution, includes inherent regulatory and reputational risks Higher Risk Business 4 Trading CY26E Comps EV/EBITDA Prism (Mgmt) 6.1x Prism (Cons) 6.0x Deluxe 6.0x Fiserv 7.2x Global Payments 5.1x Paysafe 5.9x Repay 4.8x Shift4 8.4x Bill.com 14.1x Corpay 10.3x Flywire 9.5x Payoneer 6.9x Paypal 6.6x WEX 8.3x
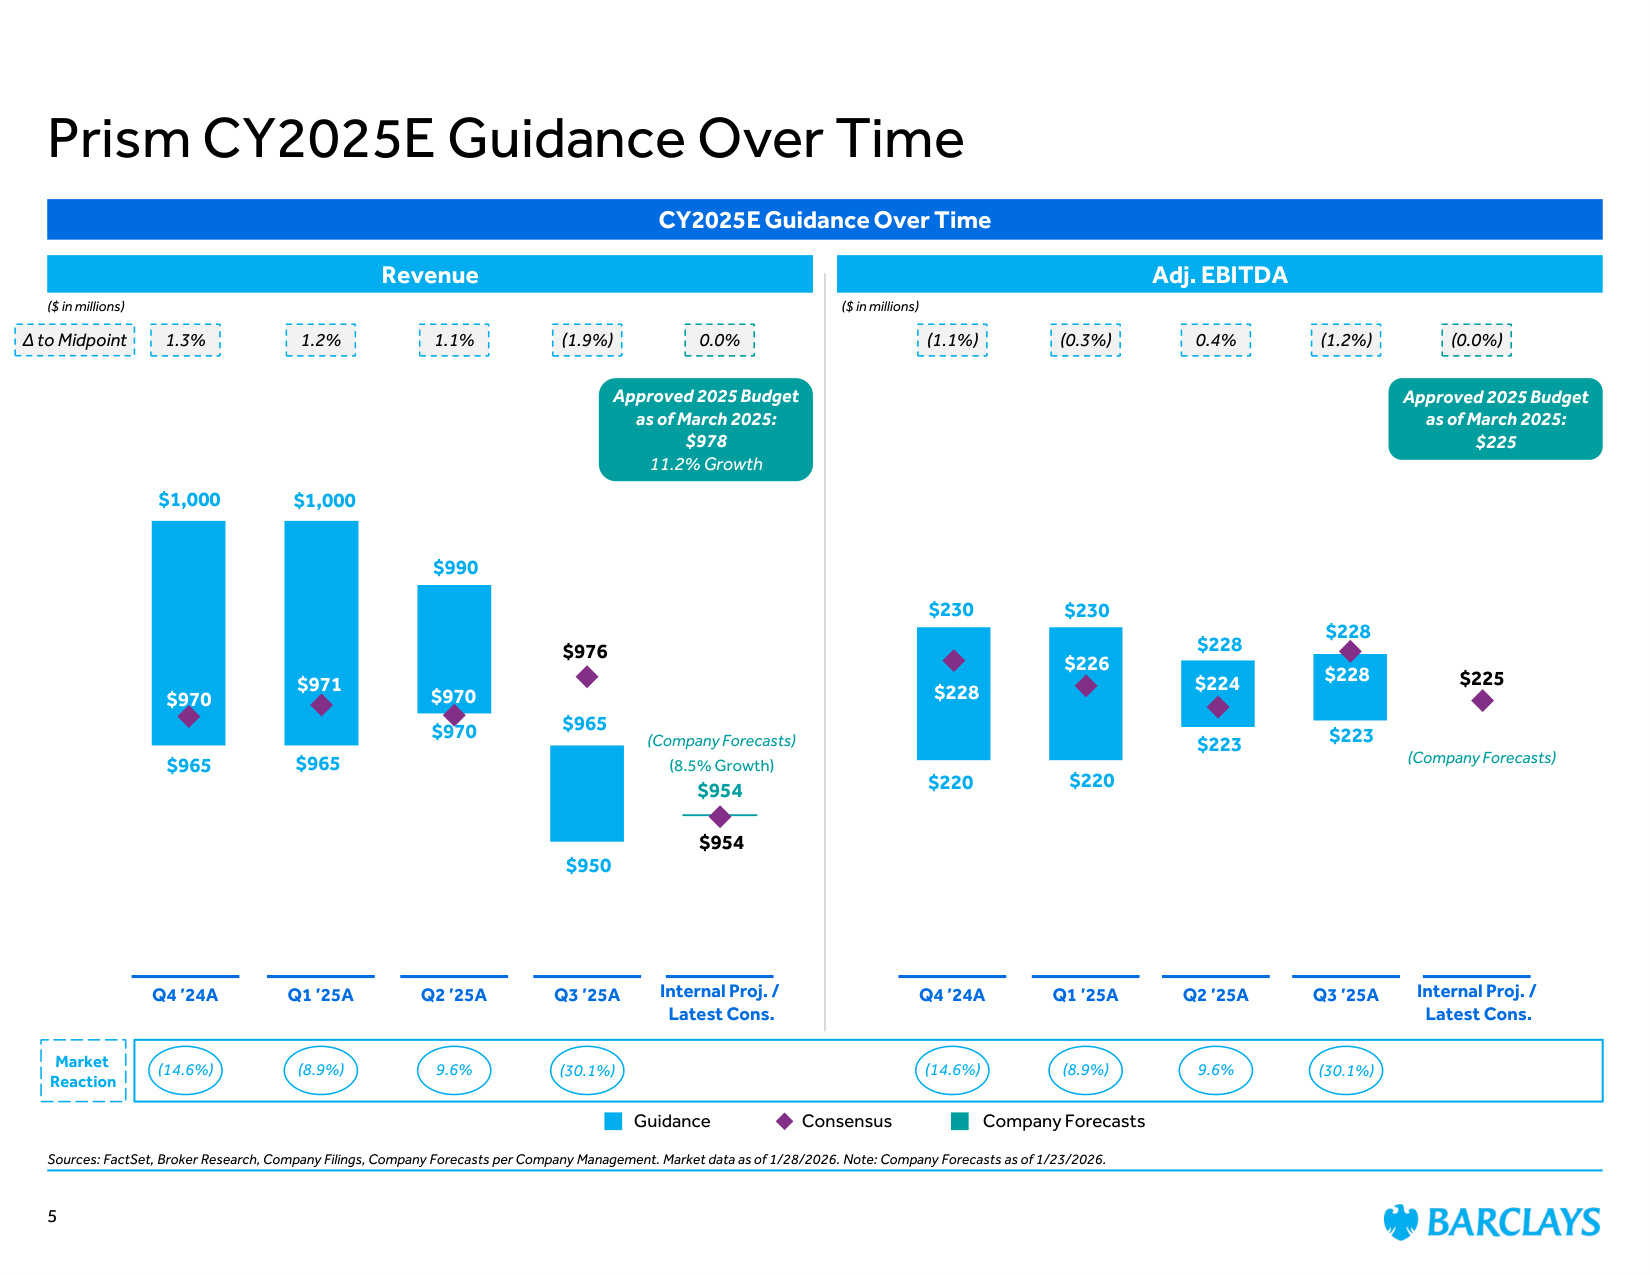
$220 $220 $223 $223 $228 $226 $224 $228 $225 $230 $230 $228 $228 $965 $965 $970 $950 $970 $971 $970 $976 $954 $1,000 $1,000 $990 $965 $954 CY2025E Guidance Over Time Revenue Adj. EBITDA Consensus ($ in millions) ($ in millions) 1.1% 1.2% 1.3% ∆ to Midpoint (1.9%) Q4 '24A Q1 '25A Q3 '25A Q2 '25A Internal Proj. / Latest Cons. Market Reaction (14.6%) (8.9%) 9.6% (30.1%) Company Forecasts Guidance Prism CY2025E Guidance Over Time Sources: FactSet, Broker Research, Company Filings, Company Forecasts per Company Management. Market data as of 1/28/2026. Note: Company Forecasts as of 1/23/2026. 5 (1.1%) (0.3%) 0.4% (1.2%) 0.0% Q4 '24A Q1 '25A Q3 '25A Q2 '25A Internal Proj. / Latest Cons. (0.0%) (30.1%) 9.6% (8.9%) (14.6%) (Company Forecasts) (Company Forecasts) Approved 2025 Budget as of March 2025: $978 11.2% Growth Approved 2025 Budget as of March 2025: $225 (8.5% Growth)
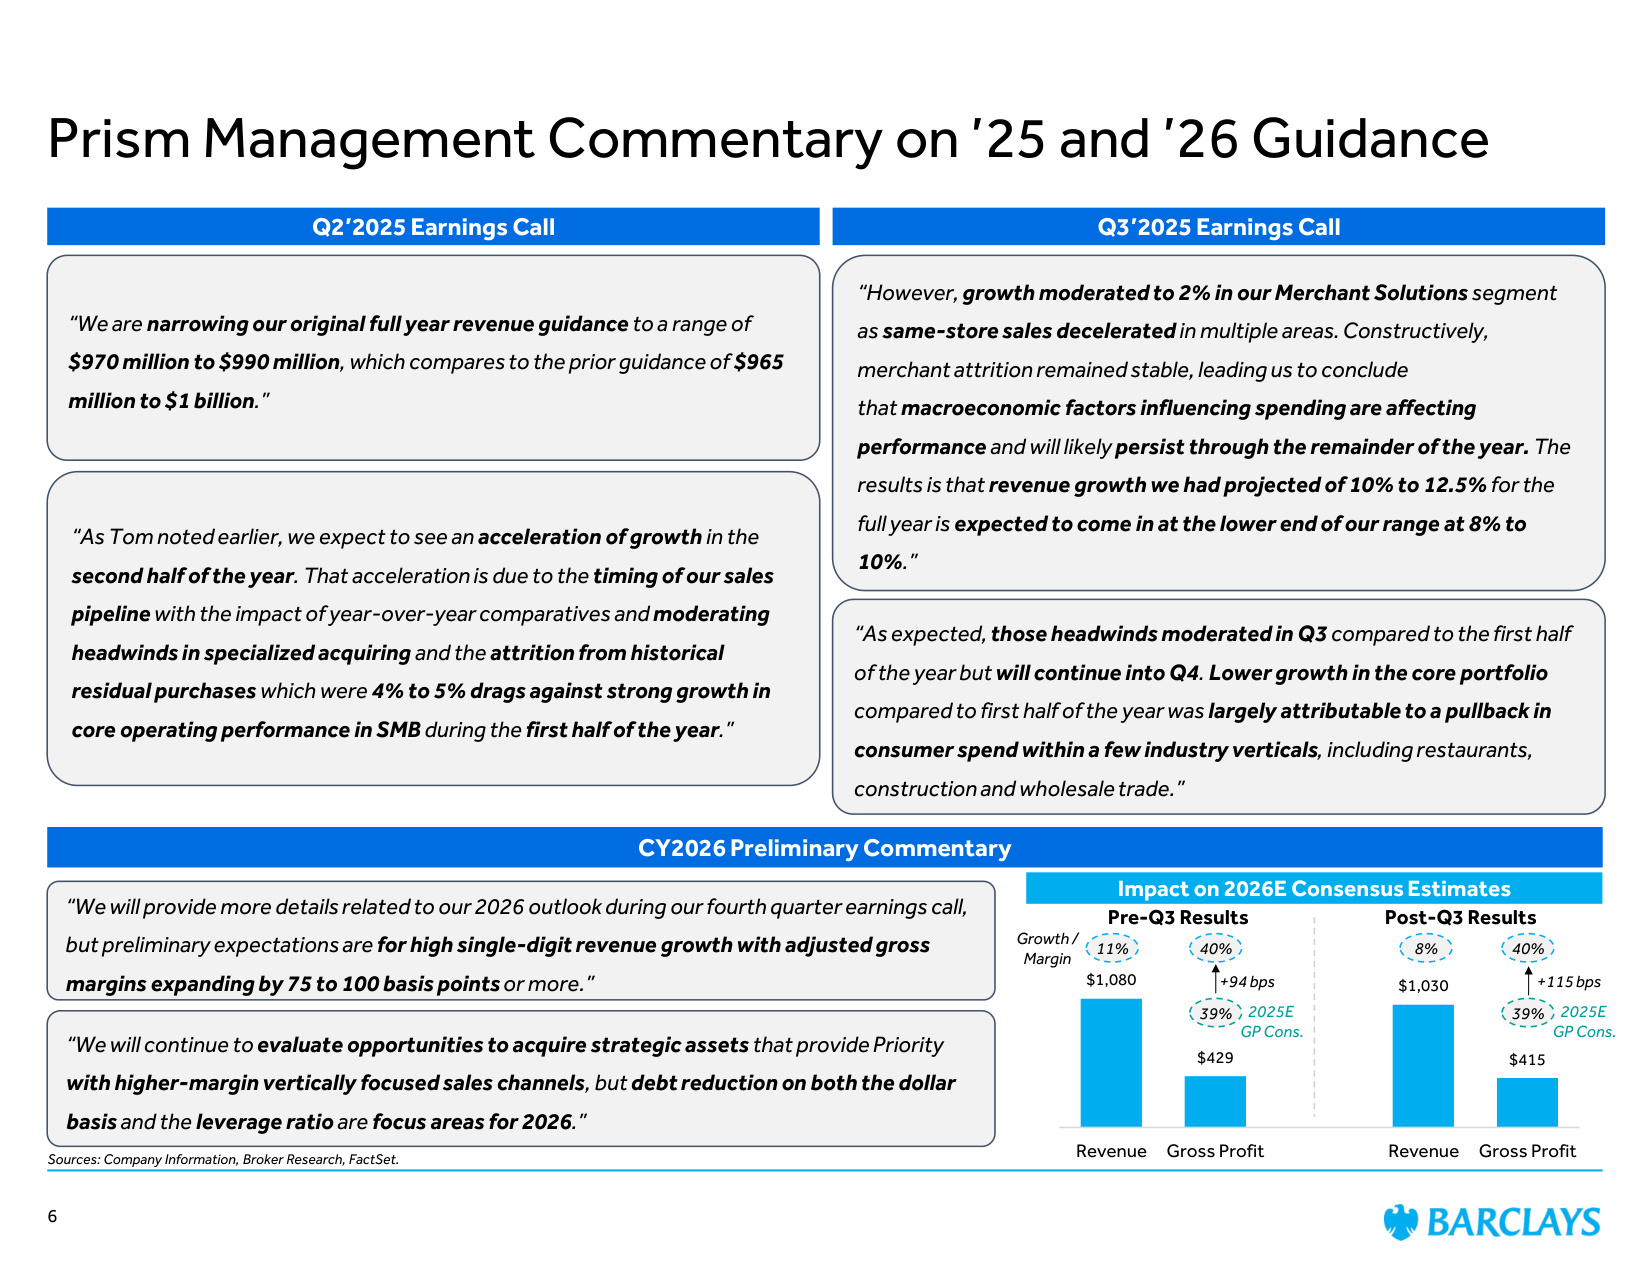
Prism Management Commentary on '25 and '26 Guidance 6 Q2'2025 Earnings Call Q3'2025 Earnings Call CY2026 Preliminary Commentary "We are narrowing our original full year revenue guidance to a range of $970 million to $990 million, which compares to the prior guidance of $965 million to $1 billion." "As Tom noted earlier, we expect to see an acceleration of growth in the second half of the year. That acceleration is due to the timing of our sales pipeline with the impact of year-over-year comparatives and moderating headwinds in specialized acquiring and the attrition from historical residual purchases which were 4% to 5% drags against strong growth in core operating performance in SMB during the first half of the year." "However,growth moderated to 2% in our Merchant Solutions segment as same-store sales decelerated in multiple areas. Constructively, merchant attrition remained stable, leading us to conclude that macroeconomic factors influencing spending are affecting performance and will likely persist through the remainder of the year. The results is that revenue growth we had projected of 10% to 12.5% for the full year is expected to come in at the lower end of our range at 8% to 10%." "As expected, those headwinds moderated in Q3 compared to the first half of the year but will continue into Q4. Lower growth in the core portfolio compared to first half of the year was largely attributable to a pullback in consumer spend within a few industry verticals, including restaurants, construction and wholesale trade." "We will continue to evaluate opportunities to acquire strategic assets that provide Priority with higher-margin vertically focused sales channels, but debt reduction on both the dollar basis and the leverage ratio are focus areas for 2026." Sources: Company Information, Broker Research, FactSet. "We will provide more details related to our 2026 outlook during our fourth quarter earnings call, but preliminary expectations are for high single-digit revenue growth with adjusted gross margins expanding by 75 to 100 basis points or more." $1,080 $429 $1,030 $415 Revenue Gross Profit Revenue Gross Profit Impact on 2026E Consensus Estimates Pre-Q3 Results Post-Q3 Results 11% 40% 8% 40% Growth / Margin 39% 39% 2025E GP Cons. +94 bps 2025E GP Cons. +115 bps
Review of Company Financials & Forecasts
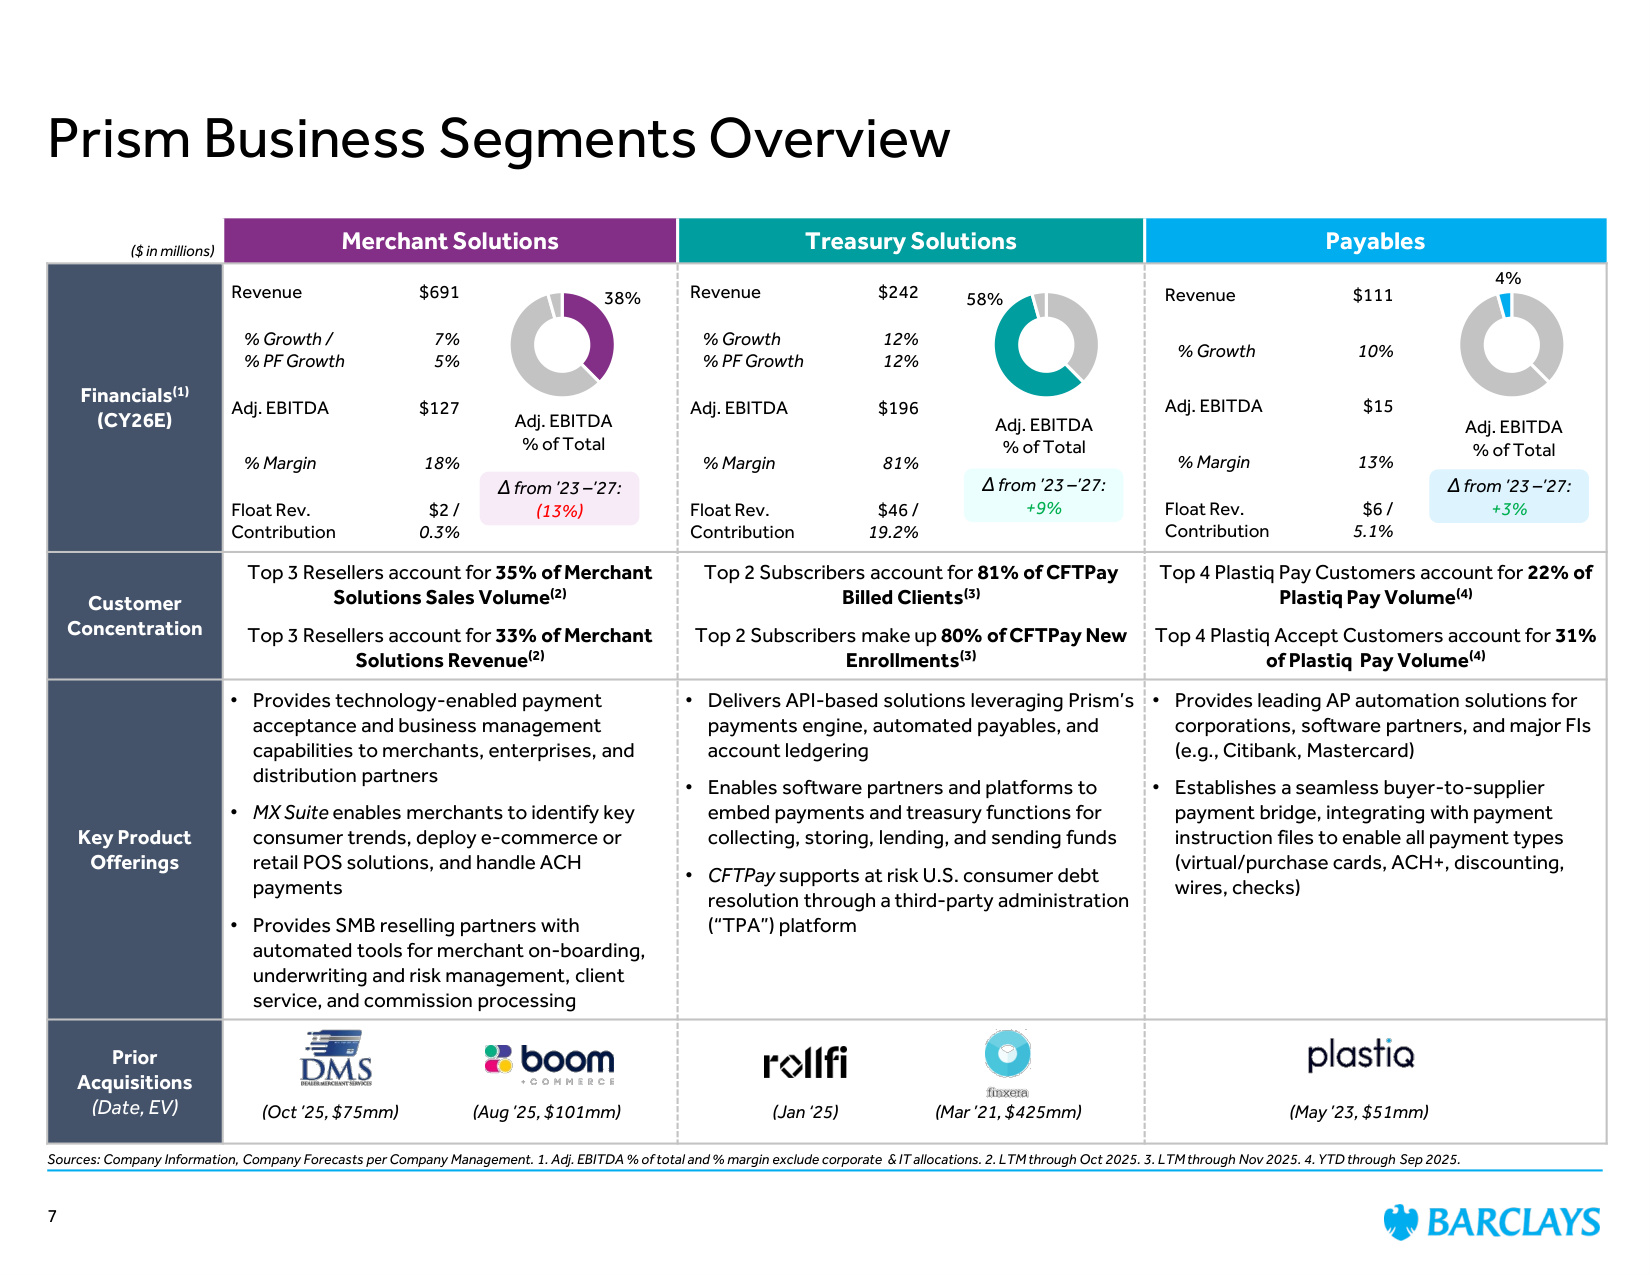
Prism Business Segments Overview Sources: Company Information, Company Forecasts per Company Management. 1. Adj. EBITDA % of total and % margin exclude corporate & IT allocations. 2. LTM through Oct 2025. 3. LTM through Nov 2025. 4. YTD through Sep 2025. Merchant Solutions Treasury Solutions Payables Financials(1) (CY26E) Customer Concentration Top 3 Resellers account for 35% of Merchant Solutions Sales Volume(2) Top 3 Resellers account for 33% of Merchant Solutions Revenue(2) Top 2 Subscribers account for 81% of CFTPay Billed Clients(3) Top 2 Subscribers make up 80% of CFTPay New Enrollments(3) Top 4 Plastiq Pay Customers account for 22% of Plastiq Pay Volume(4) Top 4 Plastiq Accept Customers account for 31% of Plastiq Pay Volume(4) Key Product Offerings • Provides technology-enabled payment acceptance and business management capabilities to merchants, enterprises, and distribution partners • MX Suite enables merchants to identify key consumer trends, deploy e-commerce or retail POS solutions, and handle ACH payments • Provides SMB reselling partners with automated tools for merchant on-boarding, underwriting and risk management, client service, and commission processing • Delivers API-based solutions leveraging Prism's payments engine, automated payables, and account ledgering • Enables software partners and platforms to embed payments and treasury functions for collecting, storing, lending, and sending funds • CFTPay supports at risk U.S. consumer debt resolution through a third-party administration ("TPA") platform • Provides leading AP automation solutions for corporations, software partners, and major FIs (e.g., Citibank, Mastercard) • Establishes a seamless buyer-to-supplier payment bridge, integrating with payment instruction files to enable all payment types (virtual/purchase cards, ACH+, discounting, wires, checks) Prior Acquisitions (Date, EV) ($ in millions) 7 (Oct '25, $75mm) (Aug '25, $101mm) (Jan '25) (Mar '21, $425mm) (May '23, $51mm) 38% 58% 4% Adj. EBITDA % of Total Adj. EBITDA % of Total Adj. EBITDA % of Total Revenue $691 % Growth / % PF Growth 7% 5% Adj. EBITDA $127 % Margin 18% Float Rev. Contribution $2 / 0.3% Revenue $242 % Growth % PF Growth 12% 12% Adj. EBITDA $196 % Margin 81% Float Rev. Contribution $46 / 19.2% Revenue $111 % Growth 10% Adj. EBITDA $15 % Margin 13% Float Rev. Contribution $6 / 5.1% Δ from '23 –'27: (13%) Δ from '23 –'27: +9% Δ from '23 –'27: +3%
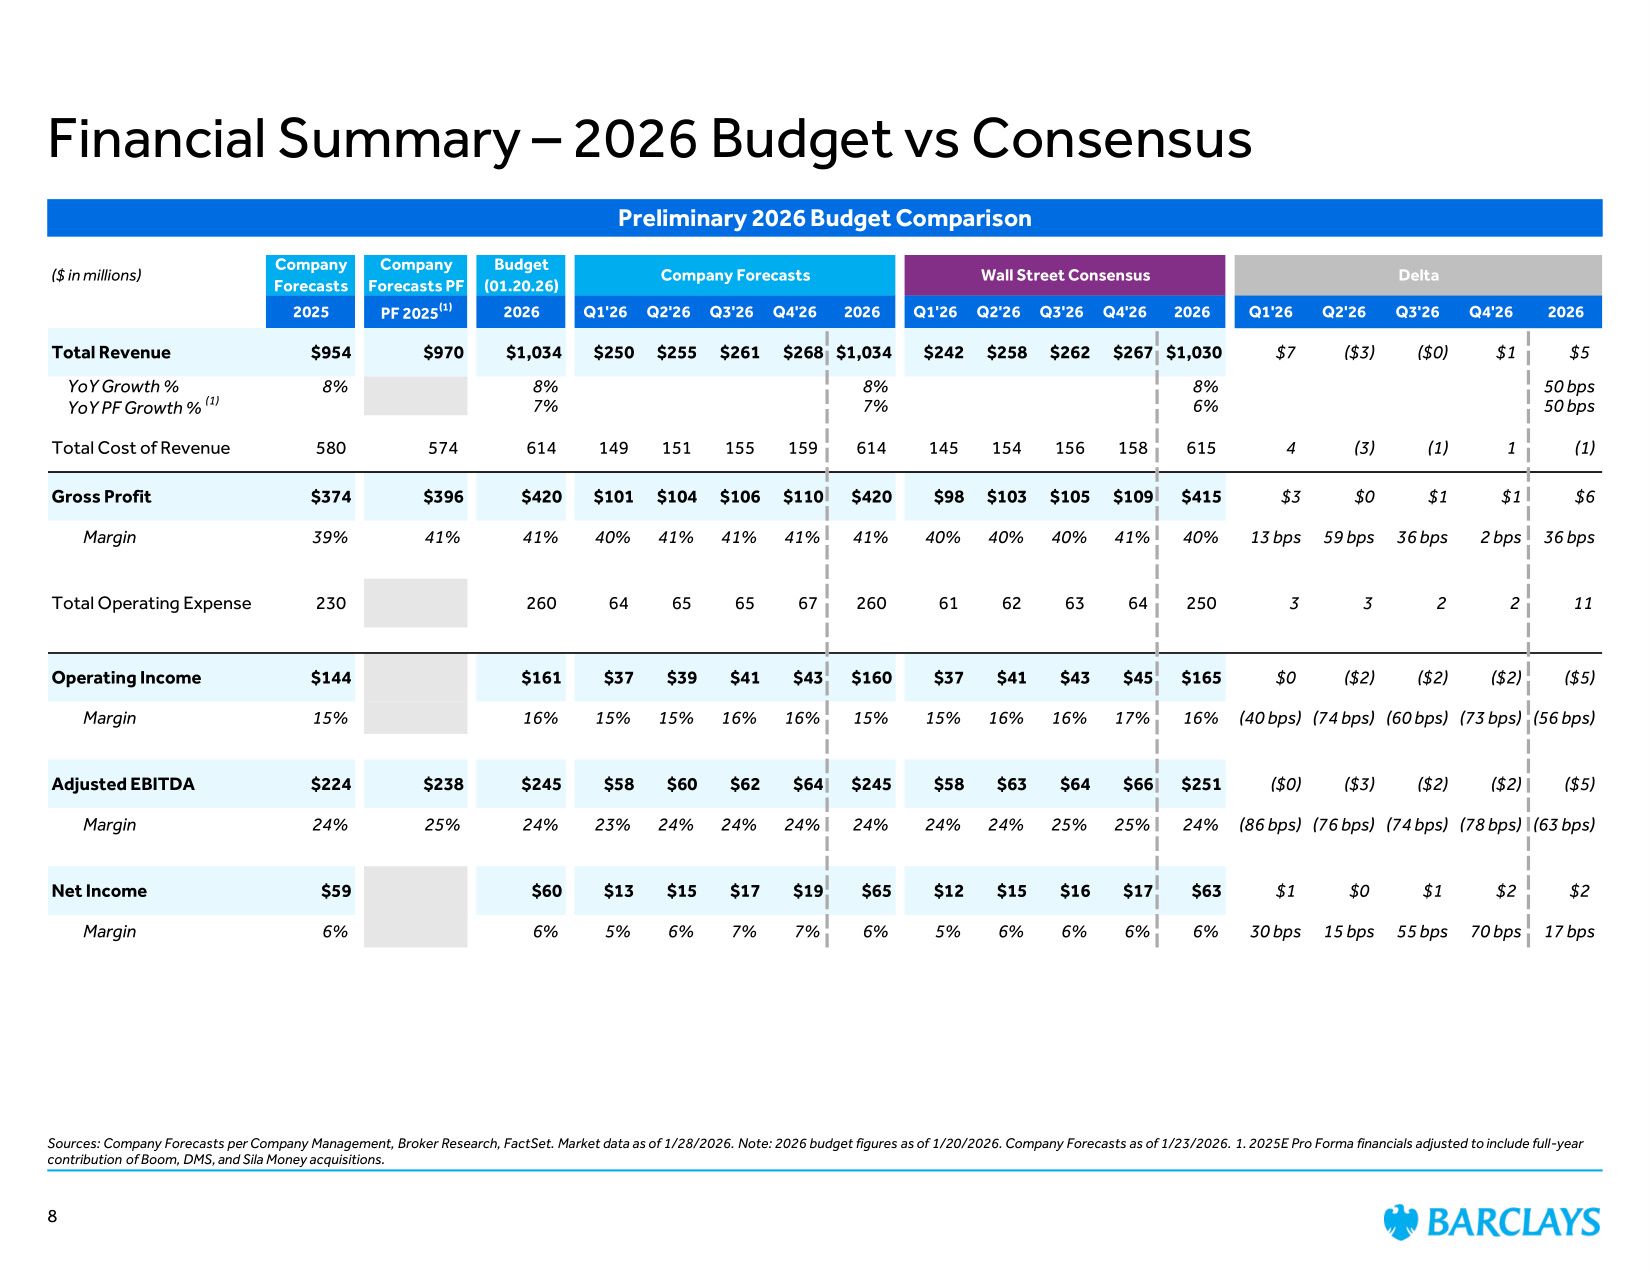
Preliminary 2026 Budget Comparison ($ in millions) Company Forecasts Company Forecasts PF Budget (01.20.26) Company Forecasts Wall Street Consensus Delta 2025 PF 2025(1) 2026 Q1'26 Q2'26 Q3'26 Q4'26 2026 Q1'26 Q2'26 Q3'26 Q4'26 2026 Q1'26 Q2'26 Q3'26 Q4'26 2026 Total Revenue $954 $970 $1,034 $250 $255 $261 $268 $1,034 $242 $258 $262 $267 $1,030 $7 ($3) ($0) $1 $5 YoY Growth % 8% 8% 8% 8% 50 bps YoY PF Growth % (1) 7% 7% 6% 50 bps Total Cost of Revenue 580 574 614 149 151 155 159 614 145 154 156 158 615 4 (3) (1) 1 (1) Gross Profit $374 $396 $420 $101 $104 $106 $110 $420 $98 $103 $105 $109 $415 $3 $0 $1 $1 $6 Margin 39% 41% 41% 40% 41% 41% 41% 41% 40% 40% 40% 41% 40% 13 bps 59 bps 36 bps 2 bps 36 bps Total Operating Expense 230 260 64 65 65 67 260 61 62 63 64 250 3 3 2 2 11 Operating Income $144 $161 $37 $39 $41 $43 $160 $37 $41 $43 $45 $165 $0 ($2) ($2) ($2) ($5) Margin 15% 16% 15% 15% 16% 16% 15% 15% 16% 16% 17% 16% (40 bps) (74 bps) (60 bps) (73 bps) (56 bps) Adjusted EBITDA $224 $238 $245 $58 $60 $62 $64 $245 $58 $63 $64 $66 $251 ($0) ($3) ($2) ($2) ($5) Margin 24% 25% 24% 23% 24% 24% 24% 24% 24% 24% 25% 25% 24% (86 bps) (76 bps) (74 bps) (78 bps) (63 bps) Net Income $59 $60 $13 $15 $17 $19 $65 $12 $15 $16 $17 $63 $1 $0 $1 $2 $2 Margin 6% 6% 5% 6% 7% 7% 6% 5% 6% 6% 6% 6% 30 bps 15 bps 55 bps 70 bps 17 bps Financial Summary – 2026 Budget vs Consensus Sources: Company Forecasts per Company Management, Broker Research, FactSet. Market data as of 1/28/2026. Note: 2026 budget figures as of 1/20/2026. Company Forecasts as of 1/23/2026. 1. 2025E Pro Forma financials adjusted to include full-year contribution of Boom, DMS, and Sila Money acquisitions. 8
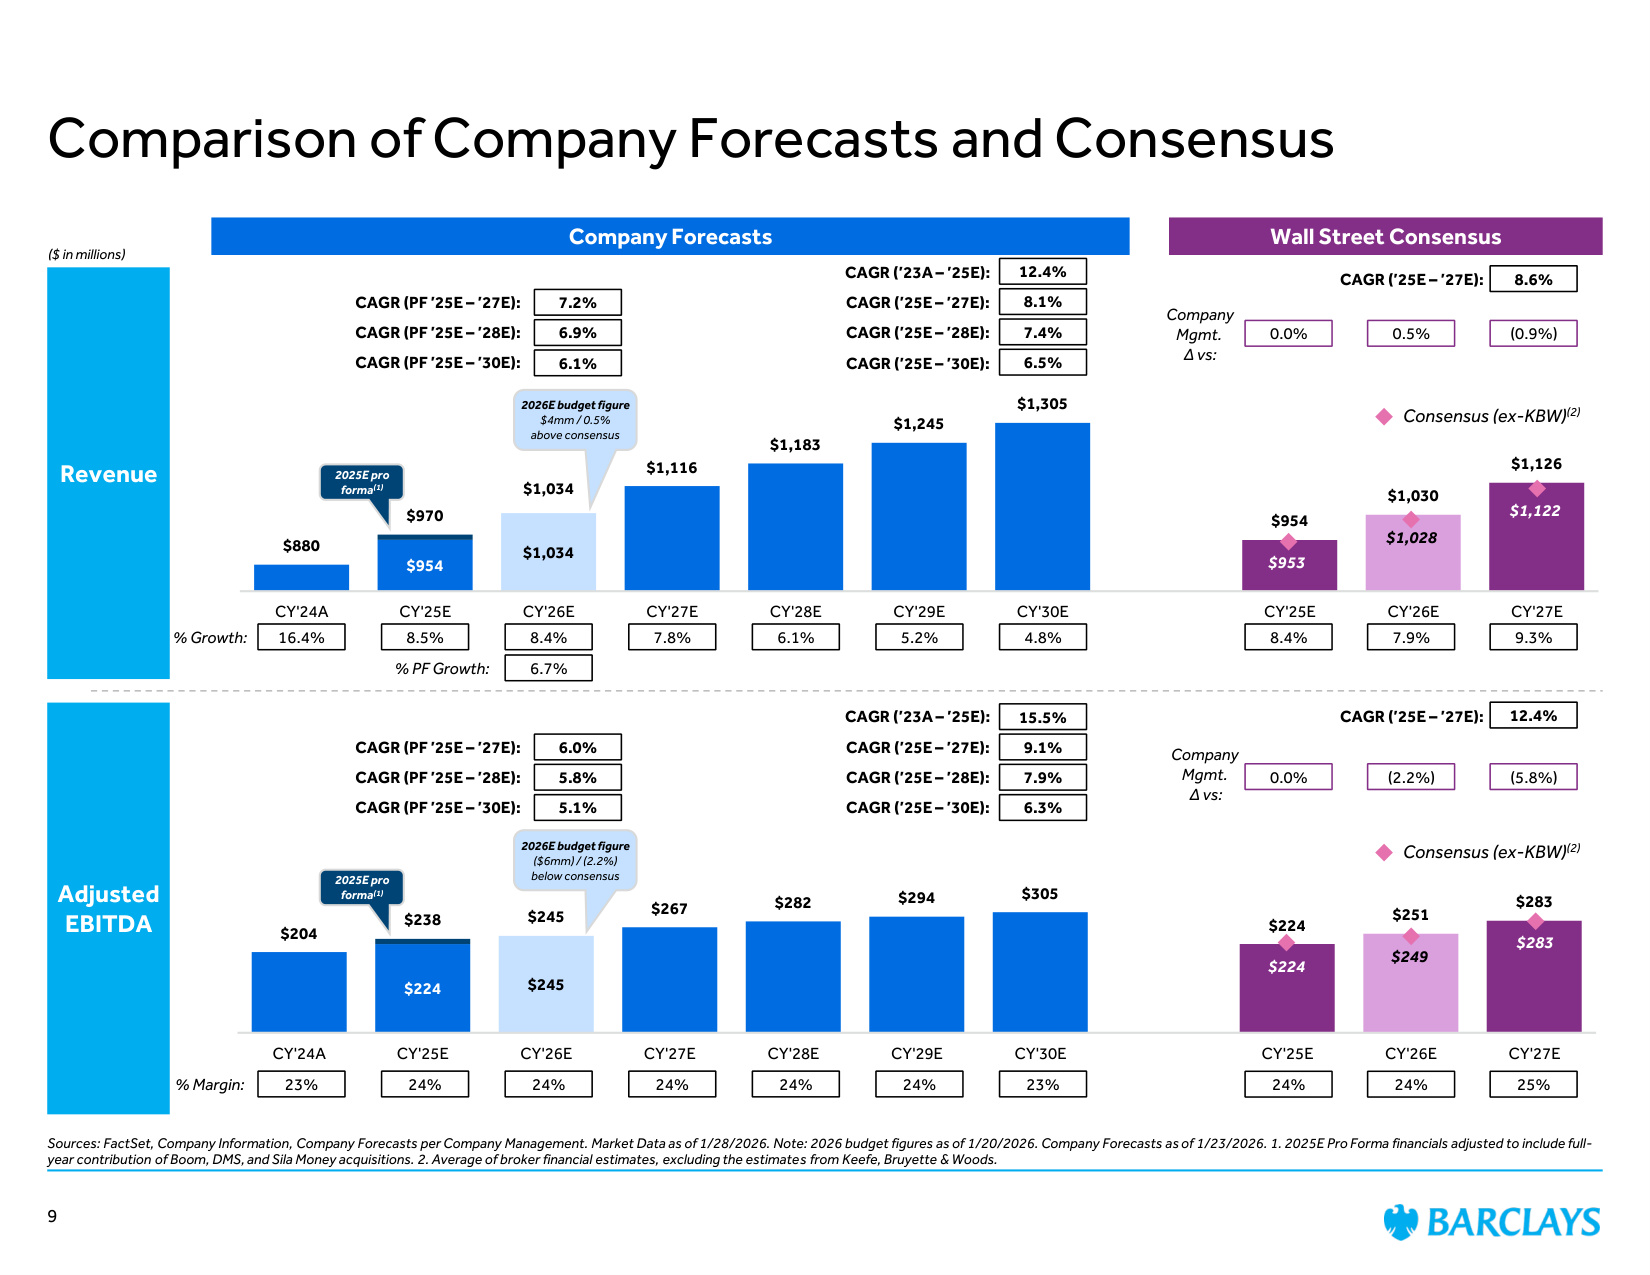
$954 $1,034 $880 $1,116 $1,183 $1,245 $1,305 $954 $1,030 $1,126 $970 $1,034 CY'24A CY'25E CY'26E CY'27E CY'28E CY'29E CY'30E CY'25E CY'26E CY'27E $224 $245 $204 $267 $282 $294 $305 $224 $251 $283 $238 $245 CY'24A CY'25E CY'26E CY'27E CY'28E CY'29E CY'30E CY'25E CY'26E CY'27E Revenue ($ in millions) Adjusted EBITDA % Growth: % Margin: 4.8% 24% 23% 24% 7.8% 6.1% 24% 24% 24% Company Forecasts Wall Street Consensus 8.6% CAGR ('25E – '27E): 25% 7.9% 9.3% 8.4% 8.4% 12.4% CAGR ('25E – '27E): 8.5% 23% 5.2% 24% Comparison of Company Forecasts and Consensus Sources: FactSet, Company Information, Company Forecasts per Company Management. Market Data as of 1/28/2026. Note: 2026 budget figures as of 1/20/2026. Company Forecasts as of 1/23/2026. 1. 2025E Pro Forma financials adjusted to include full- year contribution of Boom, DMS, and Sila Money acquisitions. 2. Average of broker financial estimates, excluding the estimates from Keefe, Bruyette & Woods. 2026E budget figure $4mm / 0.5% above consensus 2026E budget figure ($6mm) / (2.2%) below consensus 16.4% 24% 12.4% 8.1% 7.4% 6.5% 15.5% 9.1% CAGR ('23A – '25E): CAGR ('25E – '27E): CAGR ('25E – '28E): CAGR ('25E – '30E): 7.9% 6.3% 0.0% 0.5% (0.9%) 0.0% (2.2%) (5.8%) Company Mgmt. Δ vs: Company Mgmt. Δ vs: 2025E pro forma(1) % PF Growth: 6.7% 7.2% CAGR (PF '25E – '27E): CAGR (PF '25E – '28E): CAGR (PF '25E – '30E): 6.9% 6.1% 6.0% CAGR (PF '25E – '27E): CAGR (PF '25E – '28E): CAGR (PF '25E – '30E): 5.8% 5.1% 2025E pro forma(1) CAGR ('23A – '25E): CAGR ('25E – '27E): CAGR ('25E – '28E): CAGR ('25E – '30E): 9 $953 $1,028 $1,122 $249 $224 $283 Consensus (ex-KBW)(2) Consensus (ex-KBW)(2)
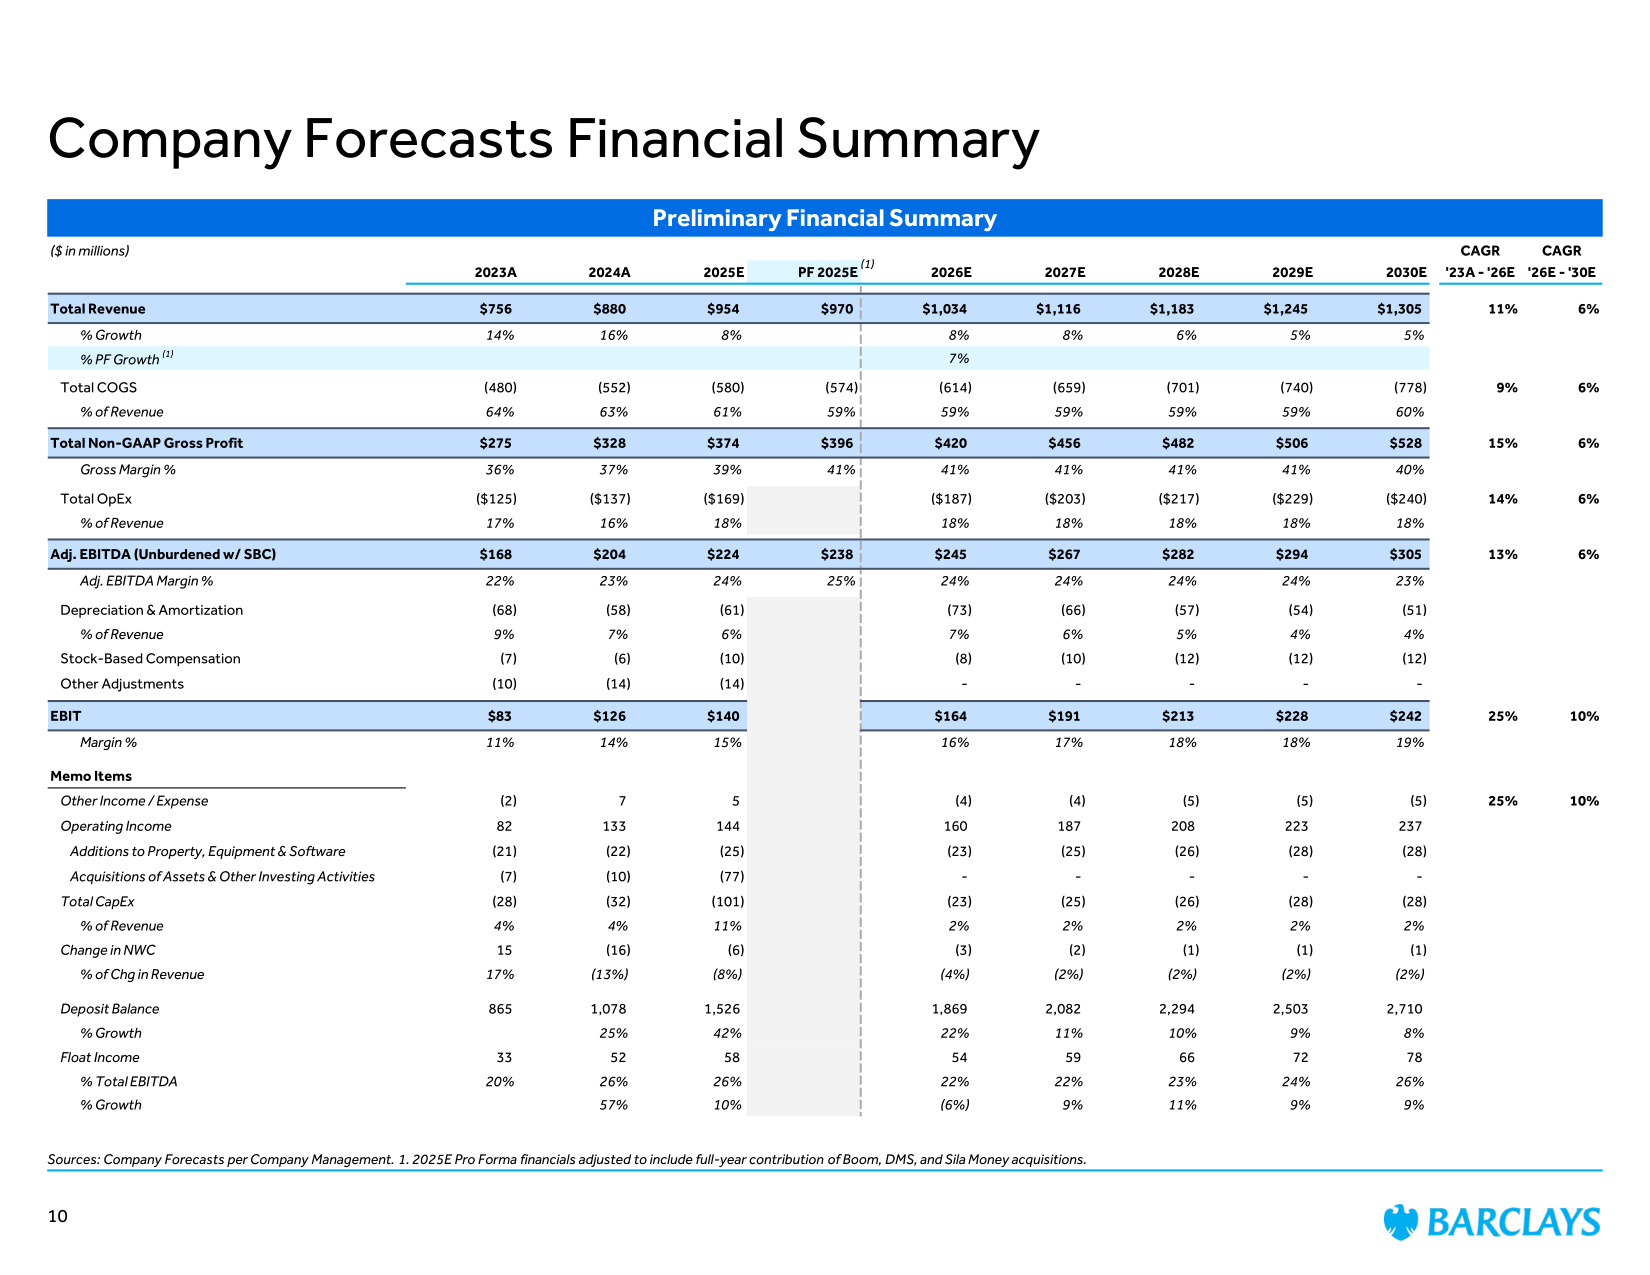
Preliminary Financial Summary ($ in millions) CAGR CAGR 2023A 2024A 2025E PF 2025E 2026E 2027E 2028E 2029E 2030E '23A - '26E '26E - '30E Total Revenue $756 $880 $954 $970 $1,034 $1,116 $1,183 $1,245 $1,305 11% 6% % Growth 14% 16% 8% 8% 8% 6% 5% 5% % PF Growth (1) 7% Total COGS (480) (552) (580) (574) (614) (659) (701) (740) (778) 9% 6% % of Revenue 64% 63% 61% 59% 59% 59% 59% 59% 60% Total Non-GAAP Gross Profit $275 $328 $374 $396 $420 $456 $482 $506 $528 15% 6% Gross Margin % 36% 37% 39% 41% 41% 41% 41% 41% 40% Total OpEx ($125) ($137) ($169) ($187) ($203) ($217) ($229) ($240) 14% 6% % of Revenue 17% 16% 18% 18% 18% 18% 18% 18% Adj. EBITDA (Unburdened w/ SBC) $168 $204 $224 $238 $245 $267 $282 $294 $305 13% 6% Adj. EBITDA Margin % 22% 23% 24% 25% 24% 24% 24% 24% 23% Depreciation & Amortization (68) (58) (61) (73) (66) (57) (54) (51) % of Revenue 9% 7% 6% 7% 6% 5% 4% 4% Stock-Based Compensation (7) (6) (10) (8) (10) (12) (12) (12) Other Adjustments (10) (14) (14) - - - - - EBIT $83 $126 $140 $164 $191 $213 $228 $242 25% 10% Margin % 11% 14% 15% 16% 17% 18% 18% 19% Memo Items Other Income / Expense (2) 7 5 (4) (4) (5) (5) (5) 25% 10% Operating Income 82 133 144 160 187 208 223 237 Additions to Property, Equipment & Software (21) (22) (25) (23) (25) (26) (28) (28) Acquisitions of Assets & Other Investing Activities (7) (10) (77) - - - - - Total CapEx (28) (32) (101) (23) (25) (26) (28) (28) % of Revenue 4% 4% 11% 2% 2% 2% 2% 2% Change in NWC 15 (16) (6) (3) (2) (1) (1) (1) % of Chg in Revenue 17% (13%) (8%) (4%) (2%) (2%) (2%) (2%) Deposit Balance 865 1,078 1,526 1,869 2,082 2,294 2,503 2,710 % Growth 25% 42% 22% 11% 10% 9% 8% Float Income 33 52 58 54 59 66 72 78 % Total EBITDA 20% 26% 26% 22% 22% 23% 24% 26% % Growth 57% 10% (6%) 9% 11% 9% 9% Company Forecasts Financial Summary Sources: Company Forecasts per Company Management. 1. 2025E Pro Forma financials adjusted to include full-year contribution of Boom, DMS, and Sila Money acquisitions. 10 (1)
Preliminary Valuation Perspectives
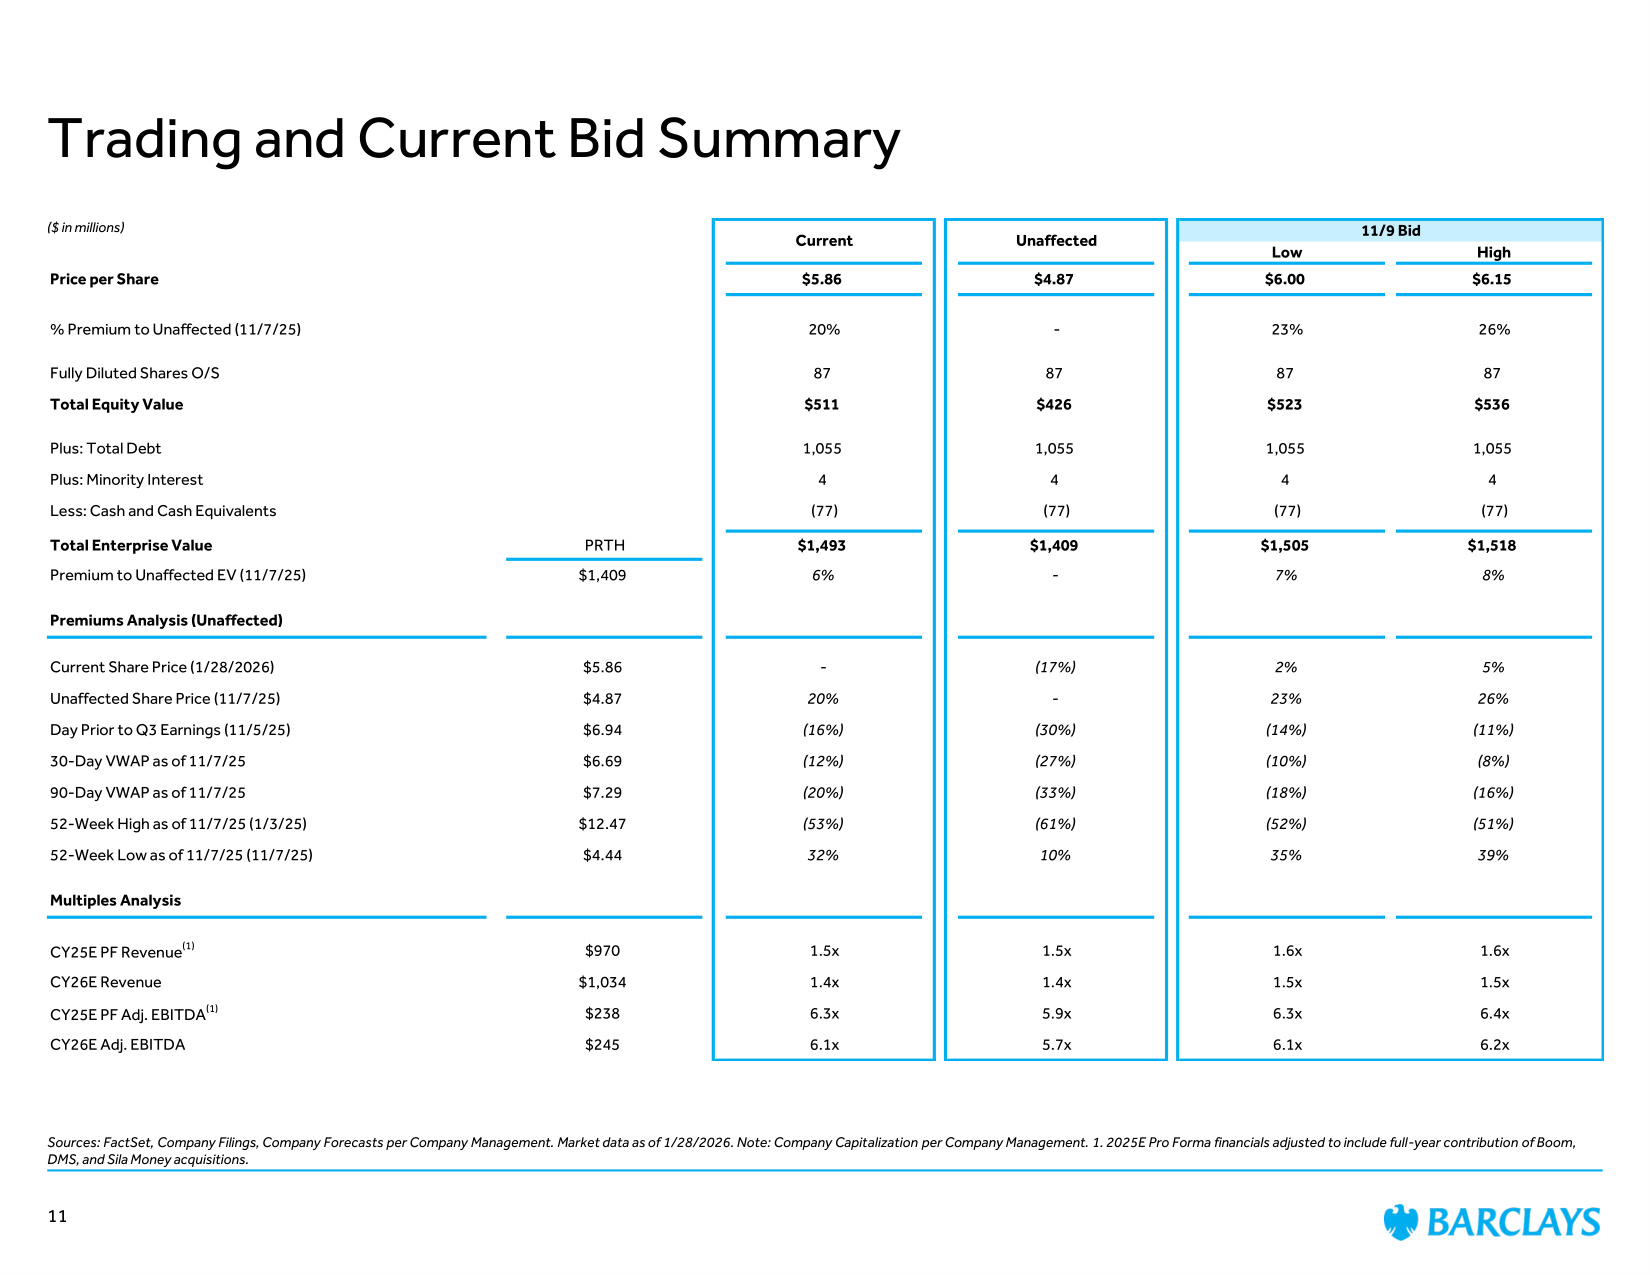
Trading and Current Bid Summary Sources: FactSet, Company Filings, Company Forecasts per Company Management. Market data as of 1/28/2026. Note: Company Capitalization per Company Management. 1. 2025E Pro Forma financials adjusted to include full-year contribution of Boom, DMS, and Sila Money acquisitions. 11/9 Bid Low High Price per Share $5.86 $4.87 $6.00 $6.15 % Premium to Unaffected (11/7/25) 20% - 23% 26% Fully Diluted Shares O/S 87 87 87 87 Total Equity Value $511 $426 $523 $536 Plus: Total Debt 1,055 1,055 1,055 1,055 Plus: Minority Interest 4 4 4 4 Less: Cash and Cash Equivalents (77) (77) (77) (77) Total Enterprise Value PRTH $1,493 $1,409 $1,505 $1,518 Premium to Unaffected EV (11/7/25) $1,409 6% - 7% 8% Premiums Analysis (Unaffected) Current Share Price (1/28/2026) $5.86 - (17%) 2% 5% Unaffected Share Price (11/7/25) $4.87 20% - 23% 26% Day Prior to Q3 Earnings (11/5/25) $6.94 (16%) (30%) (14%) (11%) 30-Day VWAP as of 11/7/25 $6.69 (12%) (27%) (10%) (8%) 90-Day VWAP as of 11/7/25 $7.29 (20%) (33%) (18%) (16%) 52-Week High as of 11/7/25 (1/3/25) $12.47 (53%) (61%) (52%) (51%) 52-Week Low as of 11/7/25 (11/7/25) $4.44 32% 10% 35% 39% Multiples Analysis CY25E PF Revenue(1) $970 1.5x 1.5x 1.6x 1.6x CY26E Revenue $1,034 1.4x 1.4x 1.5x 1.5x CY25E PF Adj. EBITDA(1) $238 6.3x 5.9x 6.3x 6.4x CY26E Adj. EBITDA $245 6.1x 5.7x 6.1x 6.2x Current Unaffected ($ in millions) 11
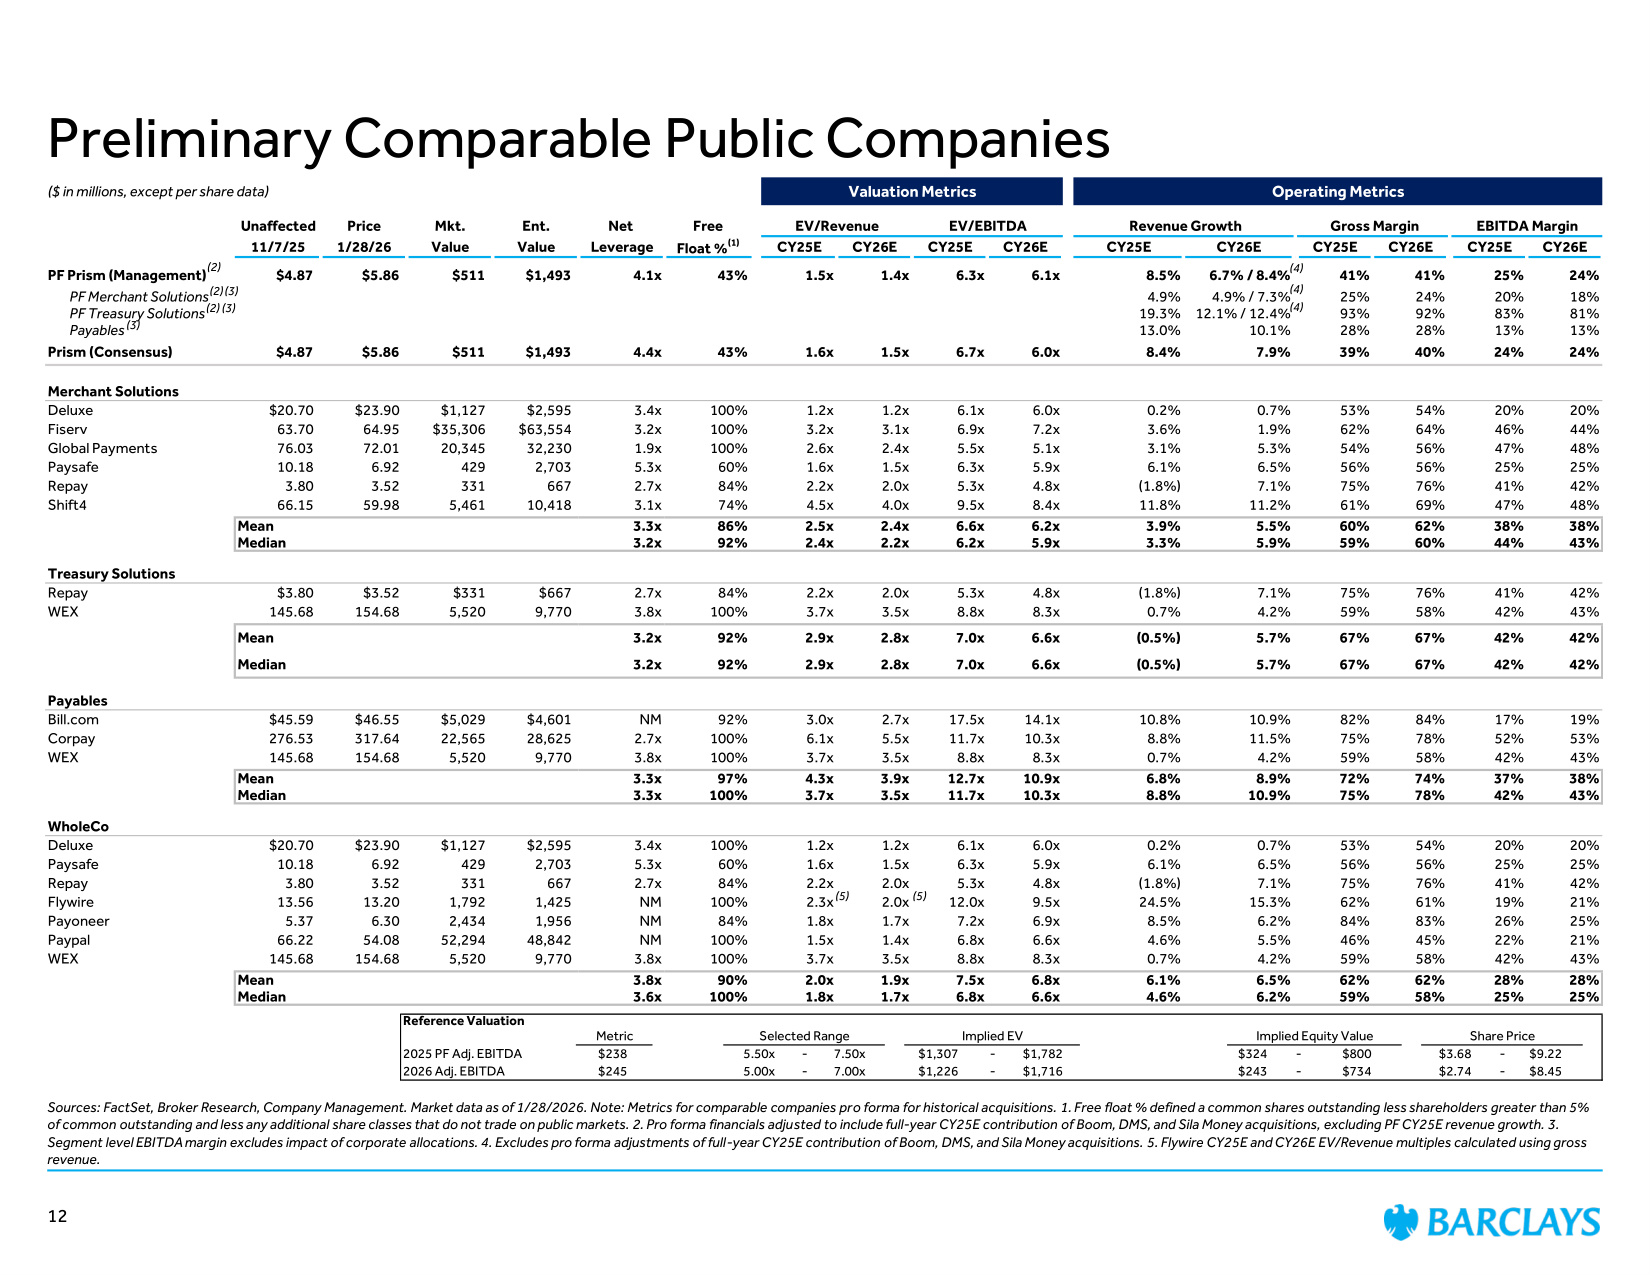
($ in millions, except per share data) Valuation Metrics Operating Metrics Unaffected Price Mkt. Ent. Net Free EV/Revenue EV/EBITDA Revenue Growth Gross Margin EBITDA Margin 11/7/25 1/28/26 Value Value Leverage Float %(1) CY25E CY26E CY25E CY26E CY25E CY26E CY25E CY26E CY25E CY26E PF Prism (Management) $4.87 $5.86 $511 $1,493 4.1x 43% 1.5x 1.4x 6.3x 6.1x 8.5% 6.7% / 8.4% 41% 41% 25% 24% PF Merchant Solutions 4.9% 4.9% / 7.3% 25% 24% 20% 18% PF Treasury Solutions 19.3% 12.1% / 12.4% 93% 92% 83% 81% Payables 13.0% 10.1% 28% 28% 13% 13% Prism (Consensus) $4.87 $5.86 $511 $1,493 4.4x 43% 1.6x 1.5x 6.7x 6.0x 8.4% 7.9% 39% 40% 24% 24% Merchant Solutions Deluxe $20.70 $23.90 $1,127 $2,595 3.4x 100% 1.2x 1.2x 6.1x 6.0x 0.2% 0.7% 53% 54% 20% 20% Fiserv 63.70 64.95 $35,306 $63,554 3.2x 100% 3.2x 3.1x 6.9x 7.2x 3.6% 1.9% 62% 64% 46% 44% Global Payments 76.03 72.01 20,345 32,230 1.9x 100% 2.6x 2.4x 5.5x 5.1x 3.1% 5.3% 54% 56% 47% 48% Paysafe 10.18 6.92 429 2,703 5.3x 60% 1.6x 1.5x 6.3x 5.9x 6.1% 6.5% 56% 56% 25% 25% Repay 3.80 3.52 331 667 2.7x 84% 2.2x 2.0x 5.3x 4.8x (1.8%) 7.1% 75% 76% 41% 42% Shift4 66.15 59.98 5,461 10,418 3.1x 74% 4.5x 4.0x 9.5x 8.4x 11.8% 11.2% 61% 69% 47% 48% Mean 3.3x 86% 2.5x 2.4x 6.6x 6.2x 3.9% 5.5% 60% 62% 38% 38% Median 3.2x 92% 2.4x 2.2x 6.2x 5.9x 3.3% 5.9% 59% 60% 44% 43% Treasury Solutions Repay $3.80 $3.52 $331 $667 2.7x 84% 2.2x 2.0x 5.3x 4.8x (1.8%) 7.1% 75% 76% 41% 42% WEX 145.68 154.68 5,520 9,770 3.8x 100% 3.7x 3.5x 8.8x 8.3x 0.7% 4.2% 59% 58% 42% 43% Mean 3.2x 92% 2.9x 2.8x 7.0x 6.6x (0.5%) 5.7% 67% 67% 42% 42% Median 3.2x 92% 2.9x 2.8x 7.0x 6.6x (0.5%) 5.7% 67% 67% 42% 42% Payables Bill.com $45.59 $46.55 $5,029 $4,601 NM 92% 3.0x 2.7x 17.5x 14.1x 10.8% 10.9% 82% 84% 17% 19% Corpay 276.53 317.64 22,565 28,625 2.7x 100% 6.1x 5.5x 11.7x 10.3x 8.8% 11.5% 75% 78% 52% 53% WEX 145.68 154.68 5,520 9,770 3.8x 100% 3.7x 3.5x 8.8x 8.3x 0.7% 4.2% 59% 58% 42% 43% Mean 3.3x 97% 4.3x 3.9x 12.7x 10.9x 6.8% 8.9% 72% 74% 37% 38% Median 3.3x 100% 3.7x 3.5x 11.7x 10.3x 8.8% 10.9% 75% 78% 42% 43% WholeCo Deluxe $20.70 $23.90 $1,127 $2,595 3.4x 100% 1.2x 1.2x 6.1x 6.0x 0.2% 0.7% 53% 54% 20% 20% Paysafe 10.18 6.92 429 2,703 5.3x 60% 1.6x 1.5x 6.3x 5.9x 6.1% 6.5% 56% 56% 25% 25% Repay 3.80 3.52 331 667 2.7x 84% 2.2x 2.0x 5.3x 4.8x (1.8%) 7.1% 75% 76% 41% 42% Flywire 13.56 13.20 1,792 1,425 NM 100% 2.3x 2.0x 12.0x 9.5x 24.5% 15.3% 62% 61% 19% 21% Payoneer 5.37 6.30 2,434 1,956 NM 84% 1.8x 1.7x 7.2x 6.9x 8.5% 6.2% 84% 83% 26% 25% Paypal 66.22 54.08 52,294 48,842 NM 100% 1.5x 1.4x 6.8x 6.6x 4.6% 5.5% 46% 45% 22% 21% WEX 145.68 154.68 5,520 9,770 3.8x 100% 3.7x 3.5x 8.8x 8.3x 0.7% 4.2% 59% 58% 42% 43% Mean 3.8x 90% 2.0x 1.9x 7.5x 6.8x 6.1% 6.5% 62% 62% 28% 28% Median 3.6x 100% 1.8x 1.7x 6.8x 6.6x 4.6% 6.2% 59% 58% 25% 25% Preliminary Comparable Public Companies Sources: FactSet, Broker Research, Company Management. Market data as of 1/28/2026. Note: Metrics for comparable companies pro forma for historical acquisitions. 1. Free float % defined a common shares outstanding less shareholders greater than 5% of common outstanding and less any additional share classes that do not trade on public markets. 2. Pro forma financials adjusted to include full-year CY25E contribution of Boom, DMS, and Sila Money acquisitions, excluding PF CY25E revenue growth. 3. Segment level EBITDA margin excludes impact of corporate allocations. 4. Excludes pro forma adjustments of full-year CY25E contribution of Boom, DMS, and Sila Money acquisitions. 5. Flywire CY25E and CY26E EV/Revenue multiples calculated using gross revenue. (5) (5) (2) (2) (2) (3) (3) (3) 12 Reference Valuation Metric Selected Range Implied EV Implied Equity Value Share Price 2025 PF Adj. EBITDA $238 5.50x - 7.50x $1,307 - $1,782 $324 - $800 $3.68 - $9.22 2026 Adj. EBITDA $245 5.00x - 7.00x $1,226 - $1,716 $243 - $734 $2.74 - $8.45 (4) (4) (4)
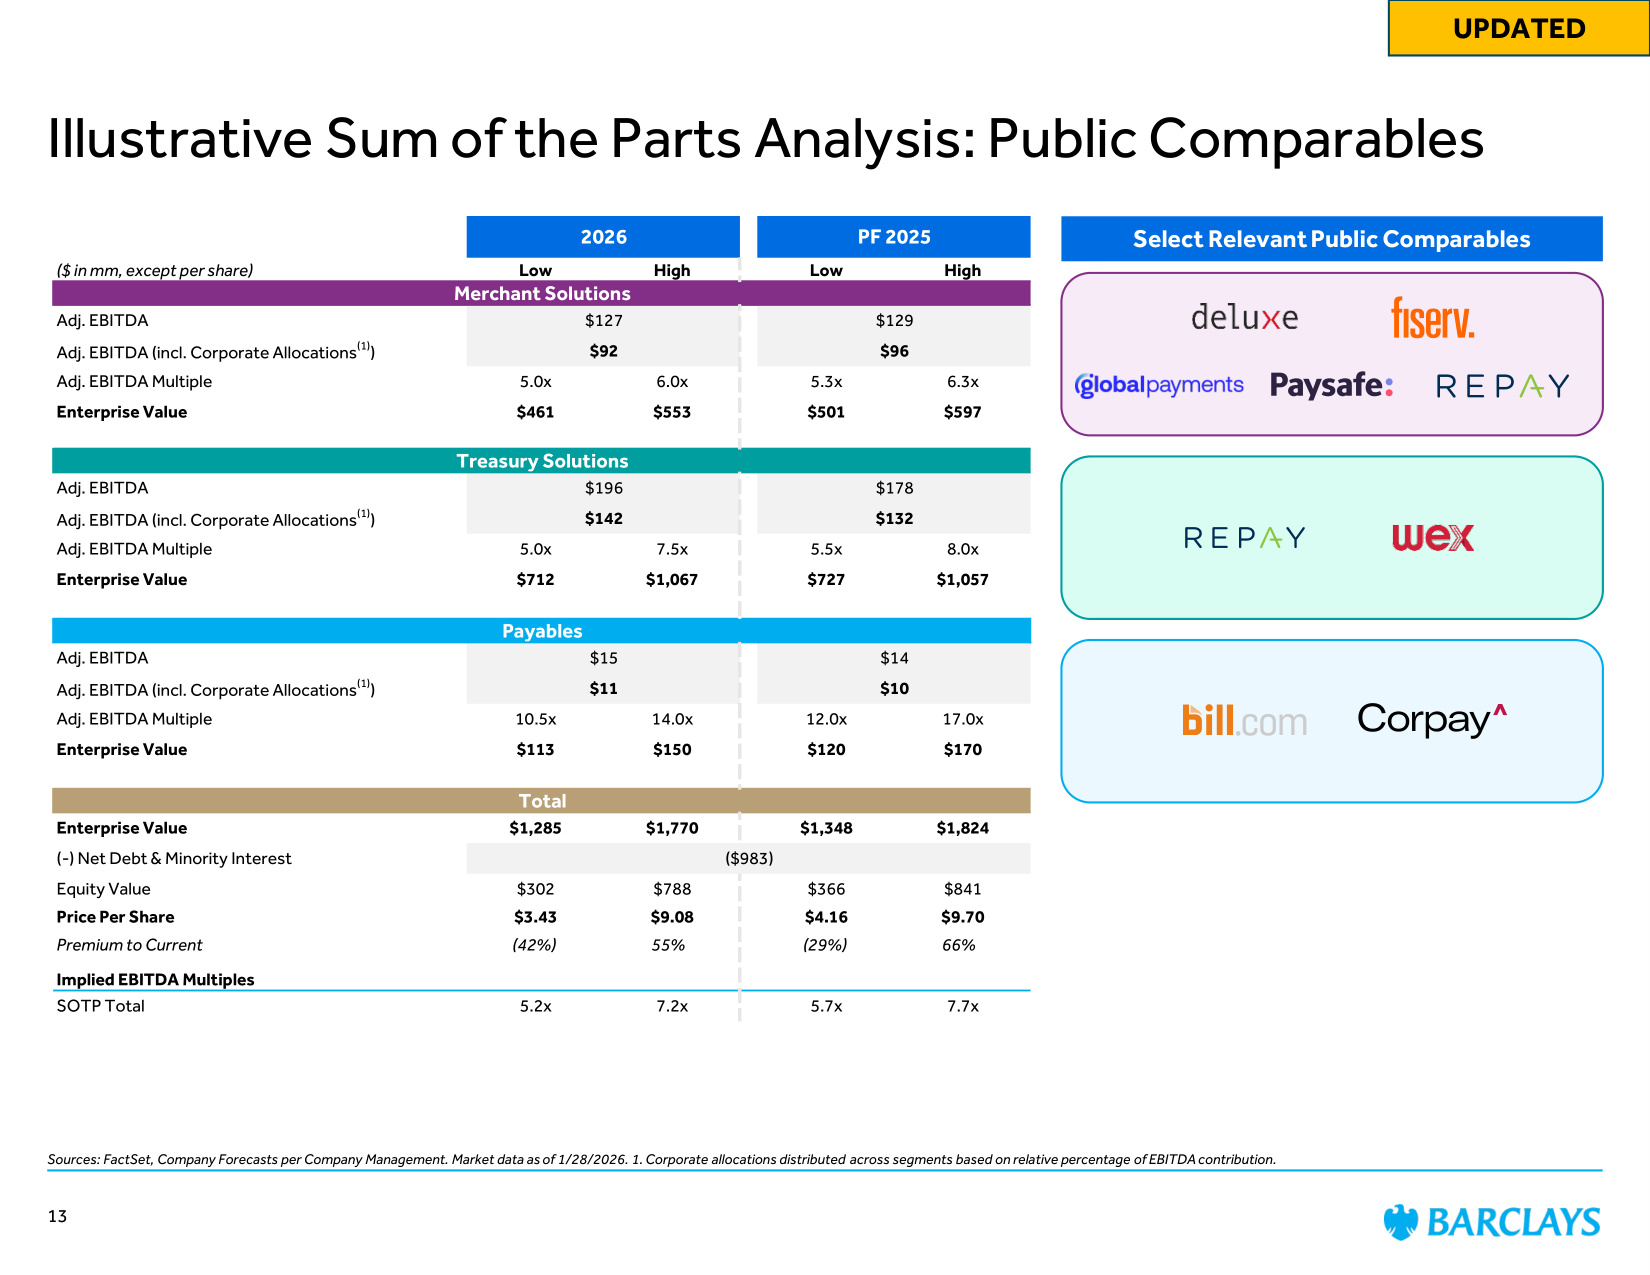
Illustrative Sum of the Parts Analysis: Public Comparables Sources: FactSet, Company Forecasts per Company Management. Market data as of 1/28/2026. 1. Corporate allocations distributed across segments based on relative percentage of EBITDA contribution. Select Relevant Public Comparables 2026 PF 2025 ($ in mm, except per share) Low High Low High Merchant Solutions Adj. EBITDA $127 $129 Adj. EBITDA (incl. Corporate Allocations(1)) $92 $96 Adj. EBITDA Multiple 5.0x 6.0x 5.3x 6.3x Enterprise Value $461 $553 $501 $597 Treasury Solutions Adj. EBITDA $196 $178 Adj. EBITDA (incl. Corporate Allocations(1)) $142 $132 Adj. EBITDA Multiple 5.0x 7.5x 5.5x 8.0x Enterprise Value $712 $1,067 $727 $1,057 Payables Adj. EBITDA $15 $14 Adj. EBITDA (incl. Corporate Allocations(1)) $11 $10 Adj. EBITDA Multiple 10.5x 14.0x 12.0x 17.0x Enterprise Value $113 $150 $120 $170 Total Enterprise Value $1,285 $1,770 $1,348 $1,824 (-) Net Debt & Minority Interest ($983) Equity Value $302 $788 $366 $841 Price Per Share $3.43 $9.08 $4.16 $9.70 Premium to Current (42%) 55% (29%) 66% Implied EBITDA Multiples SOTP Total 5.2x 7.2x 5.7x 7.7x 13 UPDATED
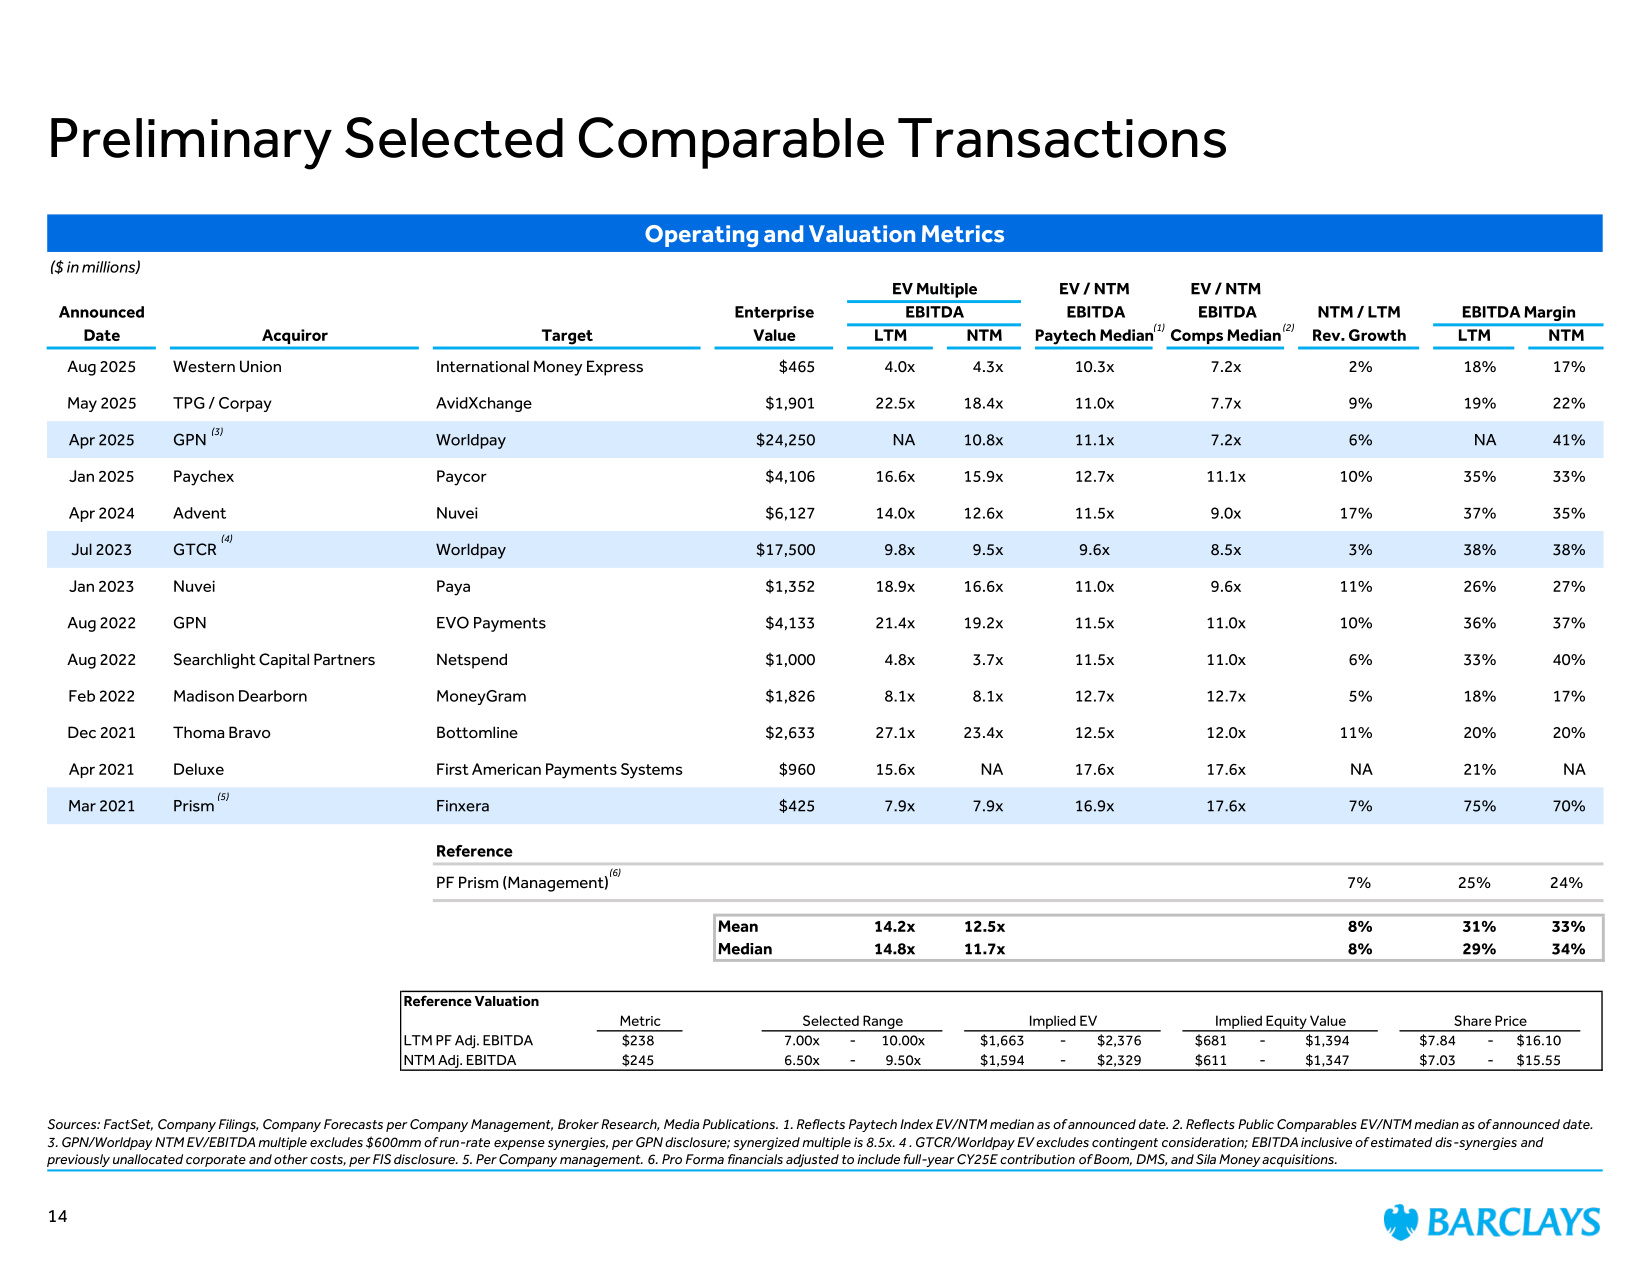
Preliminary Selected Comparable Transactions Sources: FactSet, Company Filings, Company Forecasts per Company Management, Broker Research, Media Publications. 1. Reflects Paytech Index EV/NTM median as of announced date. 2. Reflects Public Comparables EV/NTM median as of announced date. 3. GPN/Worldpay NTM EV/EBITDA multiple excludes $600mm of run-rate expense synergies, per GPN disclosure; synergized multiple is 8.5x. 4 . GTCR/Worldpay EV excludes contingent consideration; EBITDA inclusive of estimated dis-synergies and previously unallocated corporate and other costs, per FIS disclosure. 5. Per Company management. 6. Pro Forma financials adjusted to include full-year CY25E contribution of Boom, DMS, and Sila Money acquisitions. ($ in millions) EV Multiple EV / NTM EV / NTM Announced Enterprise EBITDA EBITDA EBITDA NTM / LTM EBITDA Margin Date Acquiror Target Value LTM NTM Paytech Median Comps Median Rev. Growth LTM NTM Aug 2025 Western Union International Money Express $465 4.0x 4.3x 10.3x 7.2x 2% 18% 17% May 2025 TPG / Corpay AvidXchange $1,901 22.5x 18.4x 11.0x 7.7x 9% 19% 22% Apr 2025 GPN Worldpay $24,250 NA 10.8x 11.1x 7.2x 6% NA 41% Jan 2025 Paychex Paycor $4,106 16.6x 15.9x 12.7x 11.1x 10% 35% 33% Apr 2024 Advent Nuvei $6,127 14.0x 12.6x 11.5x 9.0x 17% 37% 35% Jul 2023 GTCR Worldpay $17,500 9.8x 9.5x 9.6x 8.5x 3% 38% 38% Jan 2023 Nuvei Paya $1,352 18.9x 16.6x 11.0x 9.6x 11% 26% 27% Aug 2022 GPN EVO Payments $4,133 21.4x 19.2x 11.5x 11.0x 10% 36% 37% Aug 2022 Searchlight Capital Partners Netspend $1,000 4.8x 3.7x 11.5x 11.0x 6% 33% 40% Feb 2022 Madison Dearborn MoneyGram $1,826 8.1x 8.1x 12.7x 12.7x 5% 18% 17% Dec 2021 Thoma Bravo Bottomline $2,633 27.1x 23.4x 12.5x 12.0x 11% 20% 20% Apr 2021 Deluxe First American Payments Systems $960 15.6x NA 17.6x 17.6x NA 21% NA Mar 2021 Prism Finxera $425 7.9x 7.9x 16.9x 17.6x 7% 75% 70% Reference PF Prism (Management) 7% 25% 24% Mean 14.2x 12.5x 8% 31% 33% Median 14.8x 11.7x 8% 29% 34% Operating and Valuation Metrics 14 (4) (5) (1) (6) Reference Valuation Metric Selected Range Implied EV Implied Equity Value Share Price LTM PF Adj. EBITDA $238 7.00x - 10.00x $1,663 - $2,376 $681 - $1,394 $7.84 - $16.10 NTM Adj. EBITDA $245 6.50x - 9.50x $1,594 - $2,329 $611 - $1,347 $7.03 - $15.55 (2) (3)
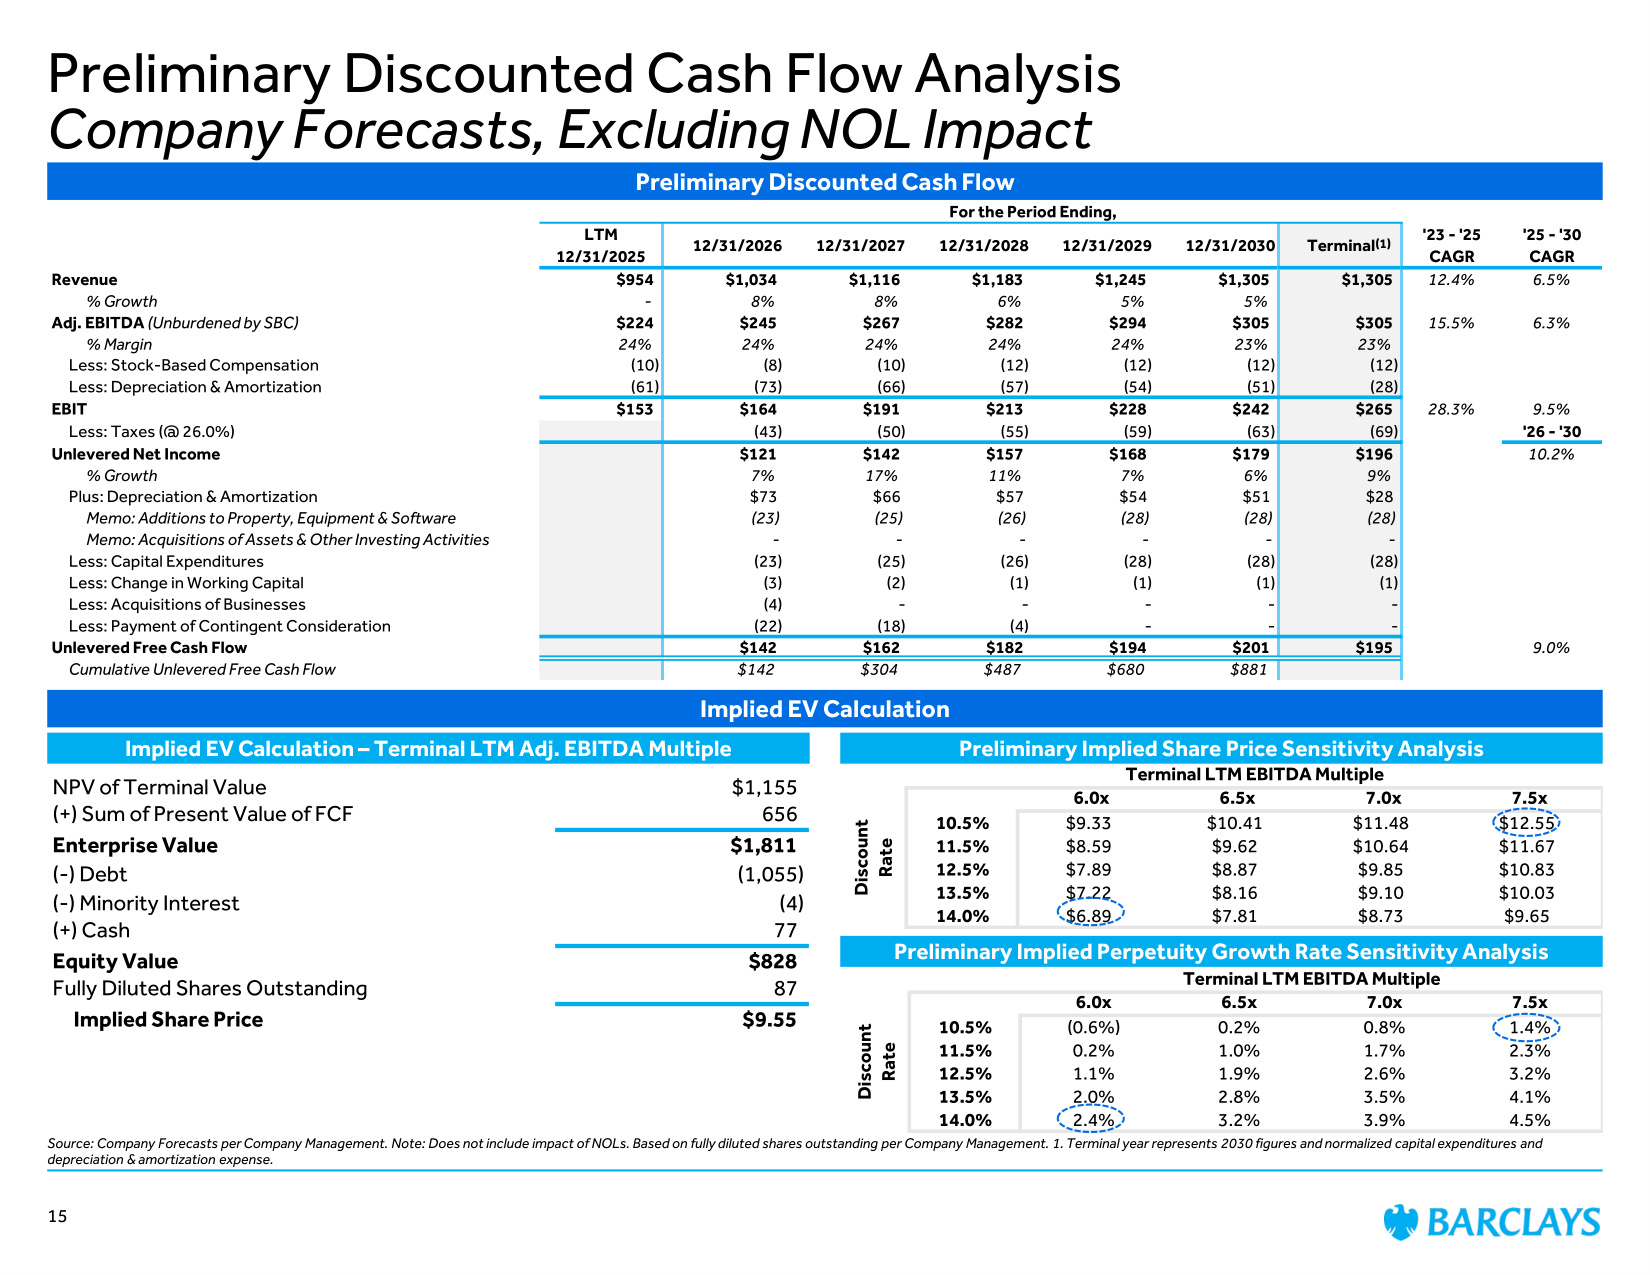
For the Period Ending, LTM 12/31/2025 12/31/2026 12/31/2027 12/31/2028 12/31/2029 12/31/2030 Terminal '23 - '25 CAGR '25 - '30 CAGR Revenue $954 $1,034 $1,116 $1,183 $1,245 $1,305 $1,305 12.4% 6.5% % Growth - 8% 8% 6% 5% 5% Adj. EBITDA (Unburdened by SBC) $224 $245 $267 $282 $294 $305 $305 15.5% 6.3% % Margin 24% 24% 24% 24% 24% 23% 23% Less: Stock-Based Compensation (10) (8) (10) (12) (12) (12) (12) Less: Depreciation & Amortization (61) (73) (66) (57) (54) (51) (28) EBIT $153 $164 $191 $213 $228 $242 $265 28.3% 9.5% Less: Taxes (@ 26.0%) (43) (50) (55) (59) (63) (69) '26 - '30 Unlevered Net Income $121 $142 $157 $168 $179 $196 10.2% % Growth 7% 17% 11% 7% 6% 9% Plus: Depreciation & Amortization $73 $66 $57 $54 $51 $28 Memo: Additions to Property, Equipment & Software (23) (25) (26) (28) (28) (28) Memo: Acquisitions of Assets & Other Investing Activities - - - - - - Less: Capital Expenditures (23) (25) (26) (28) (28) (28) Less: Change in Working Capital (3) (2) (1) (1) (1) (1) Less: Acquisitions of Businesses (4) - - - - - Less: Payment of Contingent Consideration (22) (18) (4) - - - Unlevered Free Cash Flow $142 $162 $182 $194 $201 $195 9.0% Cumulative Unlevered Free Cash Flow $142 $304 $487 $680 $881 Implied EV Calculation Implied EV Calculation – Terminal LTM Adj. EBITDA Multiple Preliminary Implied Share Price Sensitivity Analysis NPV of Terminal Value $1,155 (+) Sum of Present Value of FCF 656 Enterprise Value $1,811 (-) Debt (1,055) (-) Minority Interest (4) (+) Cash 77 Equity Value $828 Fully Diluted Shares Outstanding 87 Implied Share Price $9.55 Preliminary Implied Perpetuity Growth Rate Sensitivity Analysis Preliminary Discounted Cash Flow Terminal LTM EBITDA Multiple 6.0x 6.5x 7.0x 7.5x 10.5% $9.33 $10.41 $11.48 $12.55 11.5% $8.59 $9.62 $10.64 $11.67 12.5% $7.89 $8.87 $9.85 $10.83 13.5% $7.22 $8.16 $9.10 $10.03 14.0% $6.89 $7.81 $8.73 $9.65 Discount Rate Preliminary Discounted Cash Flow Analysis Company Forecasts, Excluding NOL Impact Source: Company Forecasts per Company Management. Note: Does not include impact of NOLs. Based on fully diluted shares outstanding per Company Management. 1. Terminal year represents 2030 figures and normalized capital expenditures and depreciation & amortization expense. 15 (1) Terminal LTM EBITDA Multiple 6.0x 6.5x 7.0x 7.5x 10.5% (0.6%) 0.2% 0.8% 1.4% 11.5% 0.2% 1.0% 1.7% 2.3% 12.5% 1.1% 1.9% 2.6% 3.2% 13.5% 2.0% 2.8% 3.5% 4.1% 14.0% 2.4% 3.2% 3.9% 4.5% Discount Rate
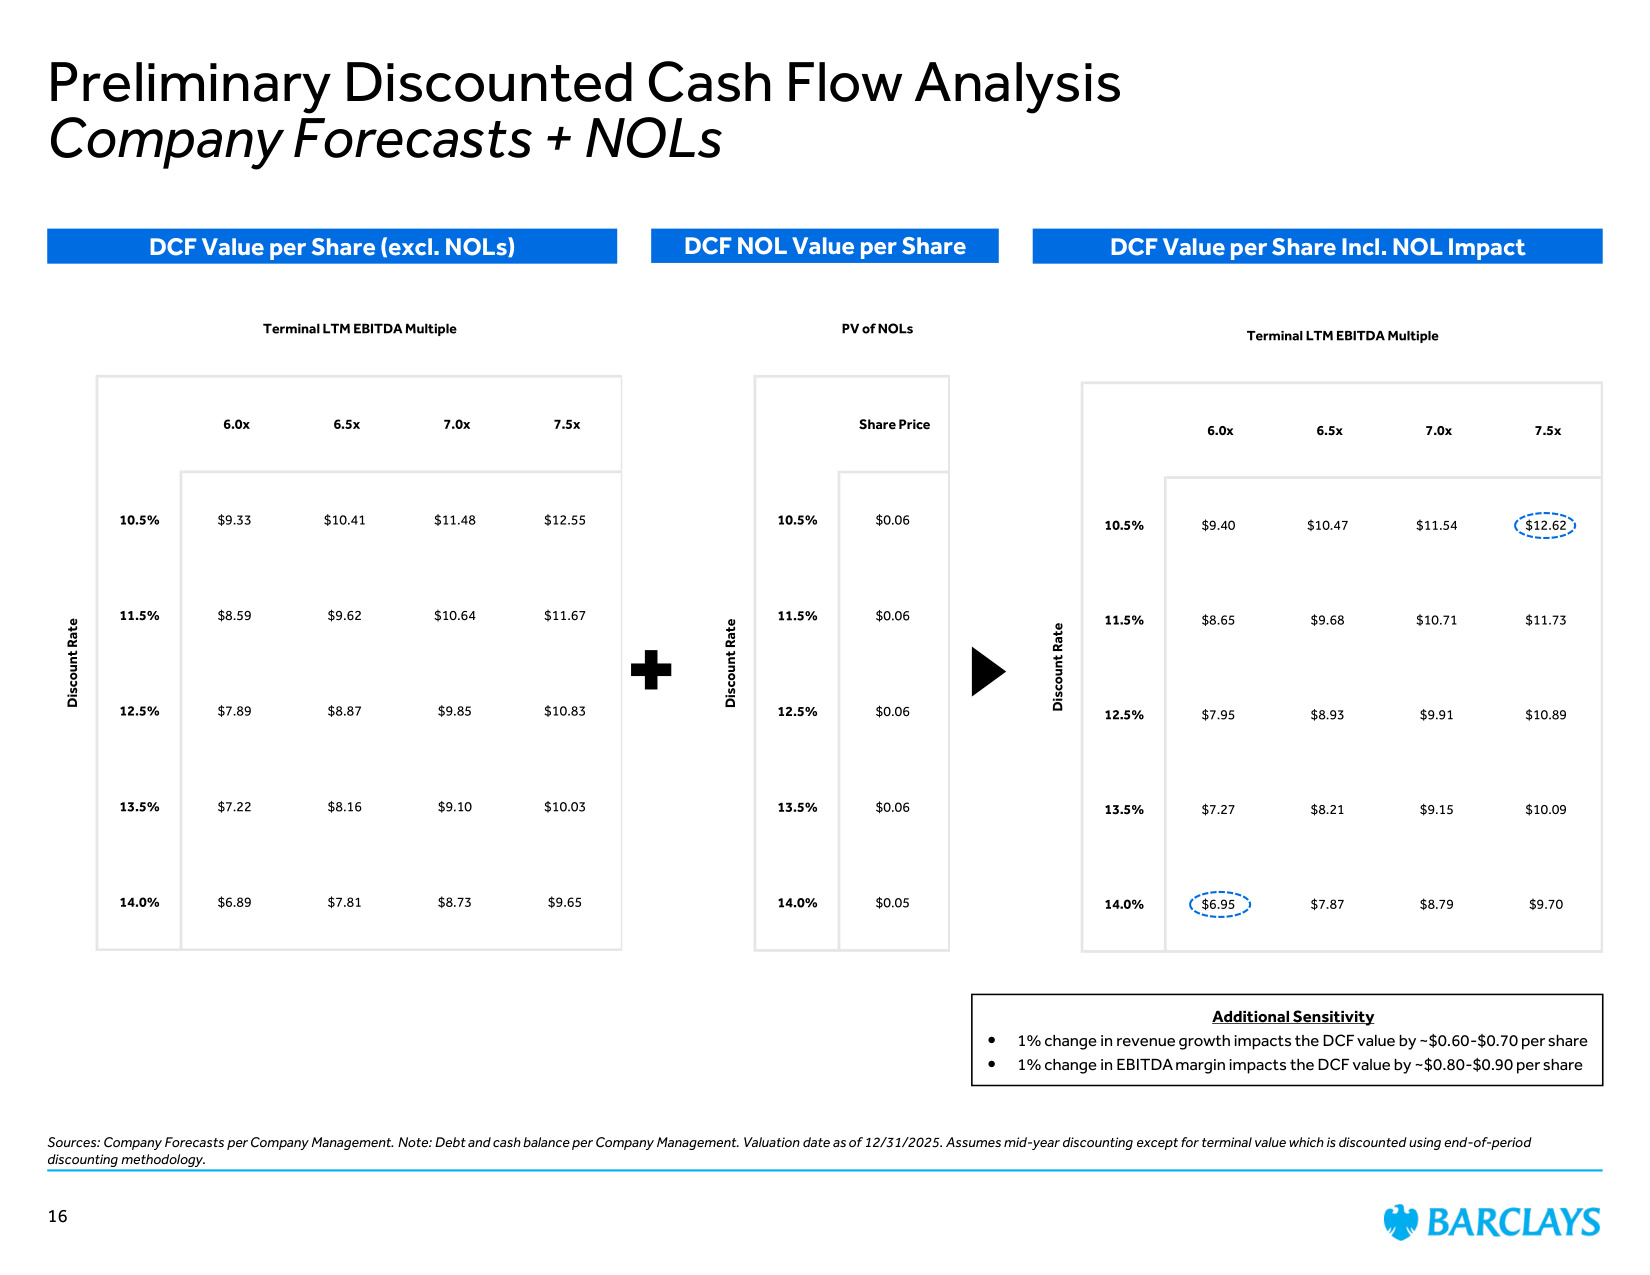
Terminal LTM EBITDA Multiple 6.0x 6.5x 7.0x 7.5x 10.5% $9.40 $10.47 $11.54 $12.62 11.5% $8.65 $9.68 $10.71 $11.73 12.5% $7.95 $8.93 $9.91 $10.89 13.5% $7.27 $8.21 $9.15 $10.09 14.0% $6.95 $7.87 $8.79 $9.70 Discount Rate Preliminary Discounted Cash Flow Analysis Company Forecasts + NOLs Sources: Company Forecasts per Company Management. Note: Debt and cash balance per Company Management. Valuation date as of 12/31/2025. Assumes mid-year discounting except for terminal value which is discounted using end-of-period discounting methodology. 16 DCF Value per Share (excl. NOLs) DCF NOL Value per Share DCF Value per Share Incl. NOL Impact Terminal LTM EBITDA Multiple 6.0x 6.5x 7.0x 7.5x 10.5% $9.33 $10.41 $11.48 $12.55 11.5% $8.59 $9.62 $10.64 $11.67 12.5% $7.89 $8.87 $9.85 $10.83 13.5% $7.22 $8.16 $9.10 $10.03 14.0% $6.89 $7.81 $8.73 $9.65 Discount Rate PV of NOLs Share Price 10.5% $0.06 11.5% $0.06 12.5% $0.06 13.5% $0.06 14.0% $0.05 Discount Rate Additional Sensitivity 1% change in revenue growth impacts the DCF value by ~$0.60-$0.70 per share 1% change in EBITDA margin impacts the DCF value by ~$0.80-$0.90 per share
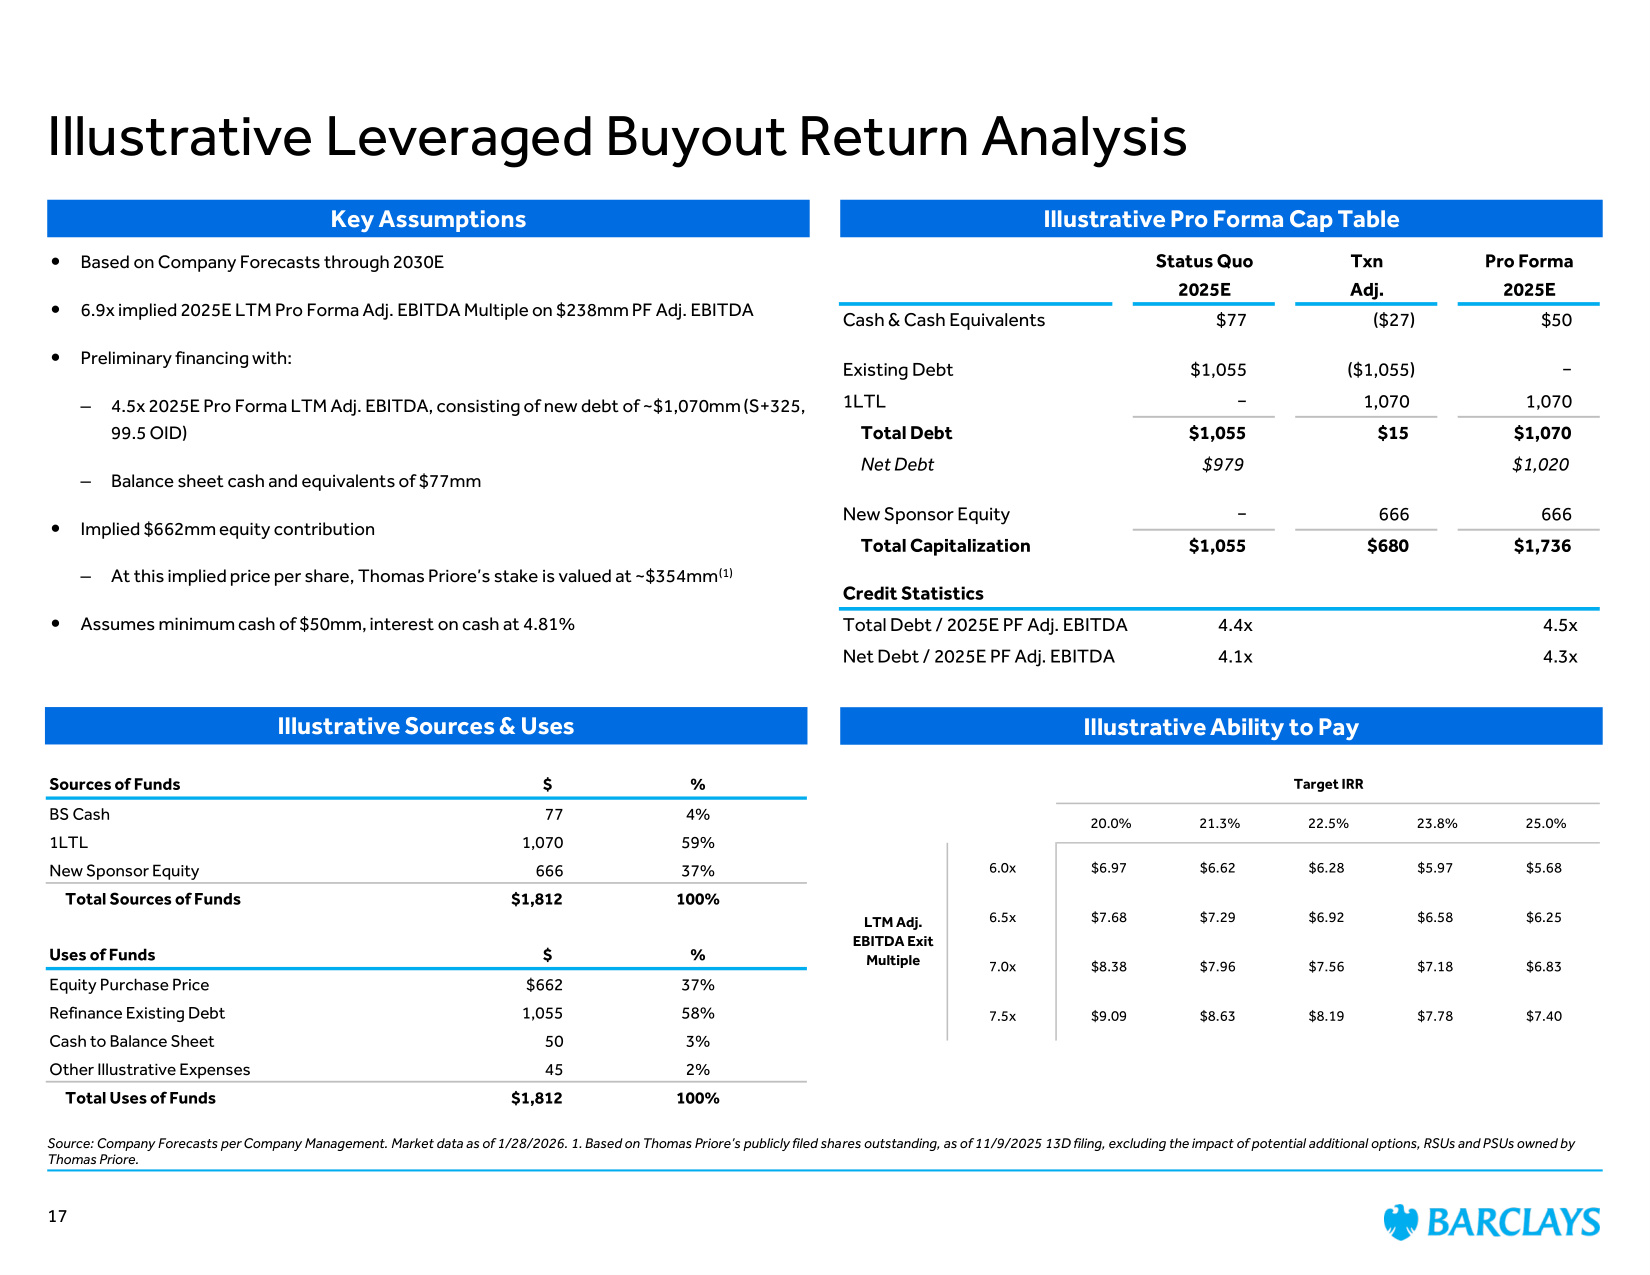
Illustrative Pro Forma Cap Table Illustrative Ability to Pay Key Assumptions Sources of Funds $ % BS Cash 77 4% 1LTL 1,070 59% New Sponsor Equity 666 37% Total Sources of Funds $1,812 100% Uses of Funds $ % Equity Purchase Price $662 37% Refinance Existing Debt 1,055 58% Cash to Balance Sheet 50 3% Other Illustrative Expenses 45 2% Total Uses of Funds $1,812 100% Status Quo Txn Pro Forma 2025E Adj. 2025E Cash & Cash Equivalents $77 ($27) $50 Existing Debt $1,055 ($1,055) − 1LTL − 1,070 1,070 Total Debt $1,055 $15 $1,070 Net Debt $979 $1,020 New Sponsor Equity − 666 666 Total Capitalization $1,055 $680 $1,736 Credit Statistics Total Debt / 2025E PF Adj. EBITDA 4.4x 4.5x Net Debt / 2025E PF Adj. EBITDA 4.1x 4.3x Target IRR 20.0% 21.3% 22.5% 23.8% 25.0% 6.0x $6.97 $6.62 $6.28 $5.97 $5.68 6.5x $7.68 $7.29 $6.92 $6.58 $6.25 7.0x $8.38 $7.96 $7.56 $7.18 $6.83 7.5x $9.09 $8.63 $8.19 $7.78 $7.40 LTM Adj. EBITDA Exit Multiple Illustrative Sources & Uses Based on Company Forecasts through 2030E 6.9x implied 2025E LTM Pro Forma Adj. EBITDA Multiple on $238mm PF Adj. EBITDA Preliminary financing with: – 4.5x 2025E Pro Forma LTM Adj. EBITDA, consisting of new debt of ~$1,070mm (S+325, 99.5 OID) – Balance sheet cash and equivalents of $77mm Implied $662mm equity contribution – At this implied price per share, Thomas Priore's stake is valued at ~$354mm(1) Assumes minimum cash of $50mm, interest on cash at 4.81% Illustrative Leveraged Buyout Return Analysis Source: Company Forecasts per Company Management. Market data as of 1/28/2026. 1. Based on Thomas Priore's publicly filed shares outstanding, as of 11/9/2025 13D filing, excluding the impact of potential additional options, RSUs and PSUs owned by Thomas Priore. 17
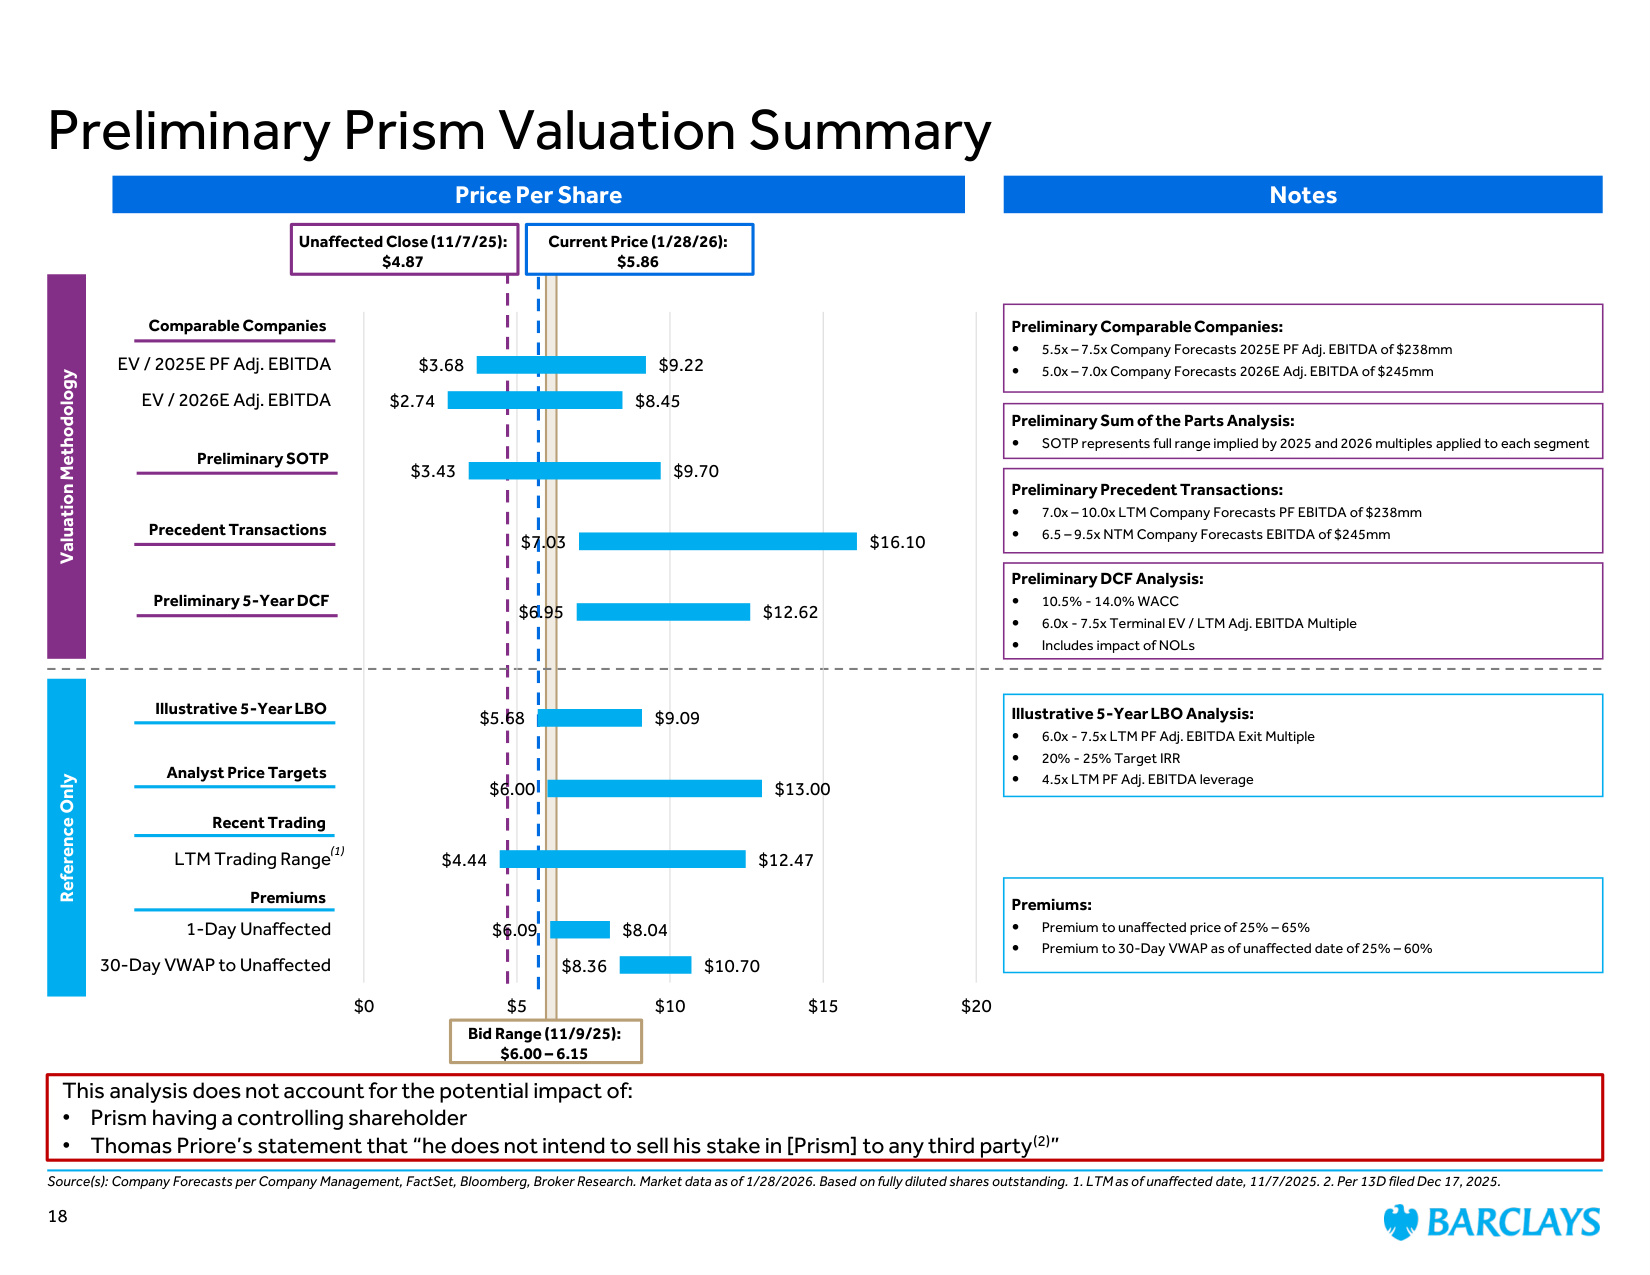
Price Per Share Notes Preliminary Comparable Companies: 5.5x – 7.5x Company Forecasts 2025E PF Adj. EBITDA of $238mm 5.0x – 7.0x Company Forecasts 2026E Adj. EBITDA of $245mm Premiums: Premium to unaffected price of 25% – 65% Premium to 30-Day VWAP as of unaffected date of 25% – 60% Preliminary Precedent Transactions: 7.0x – 10.0x LTM Company Forecasts PF EBITDA of $238mm 6.5 – 9.5x NTM Company Forecasts EBITDA of $245mm Valuation Methodology Reference Only Preliminary Prism Valuation Summary Preliminary DCF Analysis: 10.5% - 14.0% WACC 6.0x - 7.5x Terminal EV / LTM Adj. EBITDA Multiple Includes impact of NOLs Premiums Recent Trading Precedent Transactions Comparable Companies Source(s): Company Forecasts per Company Management, FactSet, Bloomberg, Broker Research. Market data as of 1/28/2026. Based on fully diluted shares outstanding. 1. LTM as of unaffected date, 11/7/2025. 2. Per 13D filed Dec 17, 2025. Illustrative 5-Year LBO Analysis: 6.0x - 7.5x LTM PF Adj. EBITDA Exit Multiple 20% - 25% Target IRR 4.5x LTM PF Adj. EBITDA leverage Illustrative 5-Year LBO Current Price (1/28/26): $5.86 Unaffected Close (11/7/25): $4.87 Preliminary 5-Year DCF Analyst Price Targets Bid Range (11/9/25): $6.00 – 6.15 (1) $3.68 $2.74 $3.43 $7.03 $6.95 $5.68 $6.00 $4.44 $6.09 $8.36 $9.22 $8.45 $9.70 $16.10 $12.62 $9.09 $13.00 $12.47 $8.04 $10.70 $0 $5 $10 $15 $20 EV / 2025E PF Adj. EBITDA EV / 2026E Adj. EBITDA LTM Trading Range 1-Day Unaffected 30-Day VWAP to Unaffected This analysis does not account for the potential impact of: • Prism having a controlling shareholder • Thomas Priore's statement that "he does not intend to sell his stake in [Prism] to any third party(2)" Preliminary SOTP Preliminary Sum of the Parts Analysis: SOTP represents full range implied by 2025 and 2026 multiples applied to each segment 18
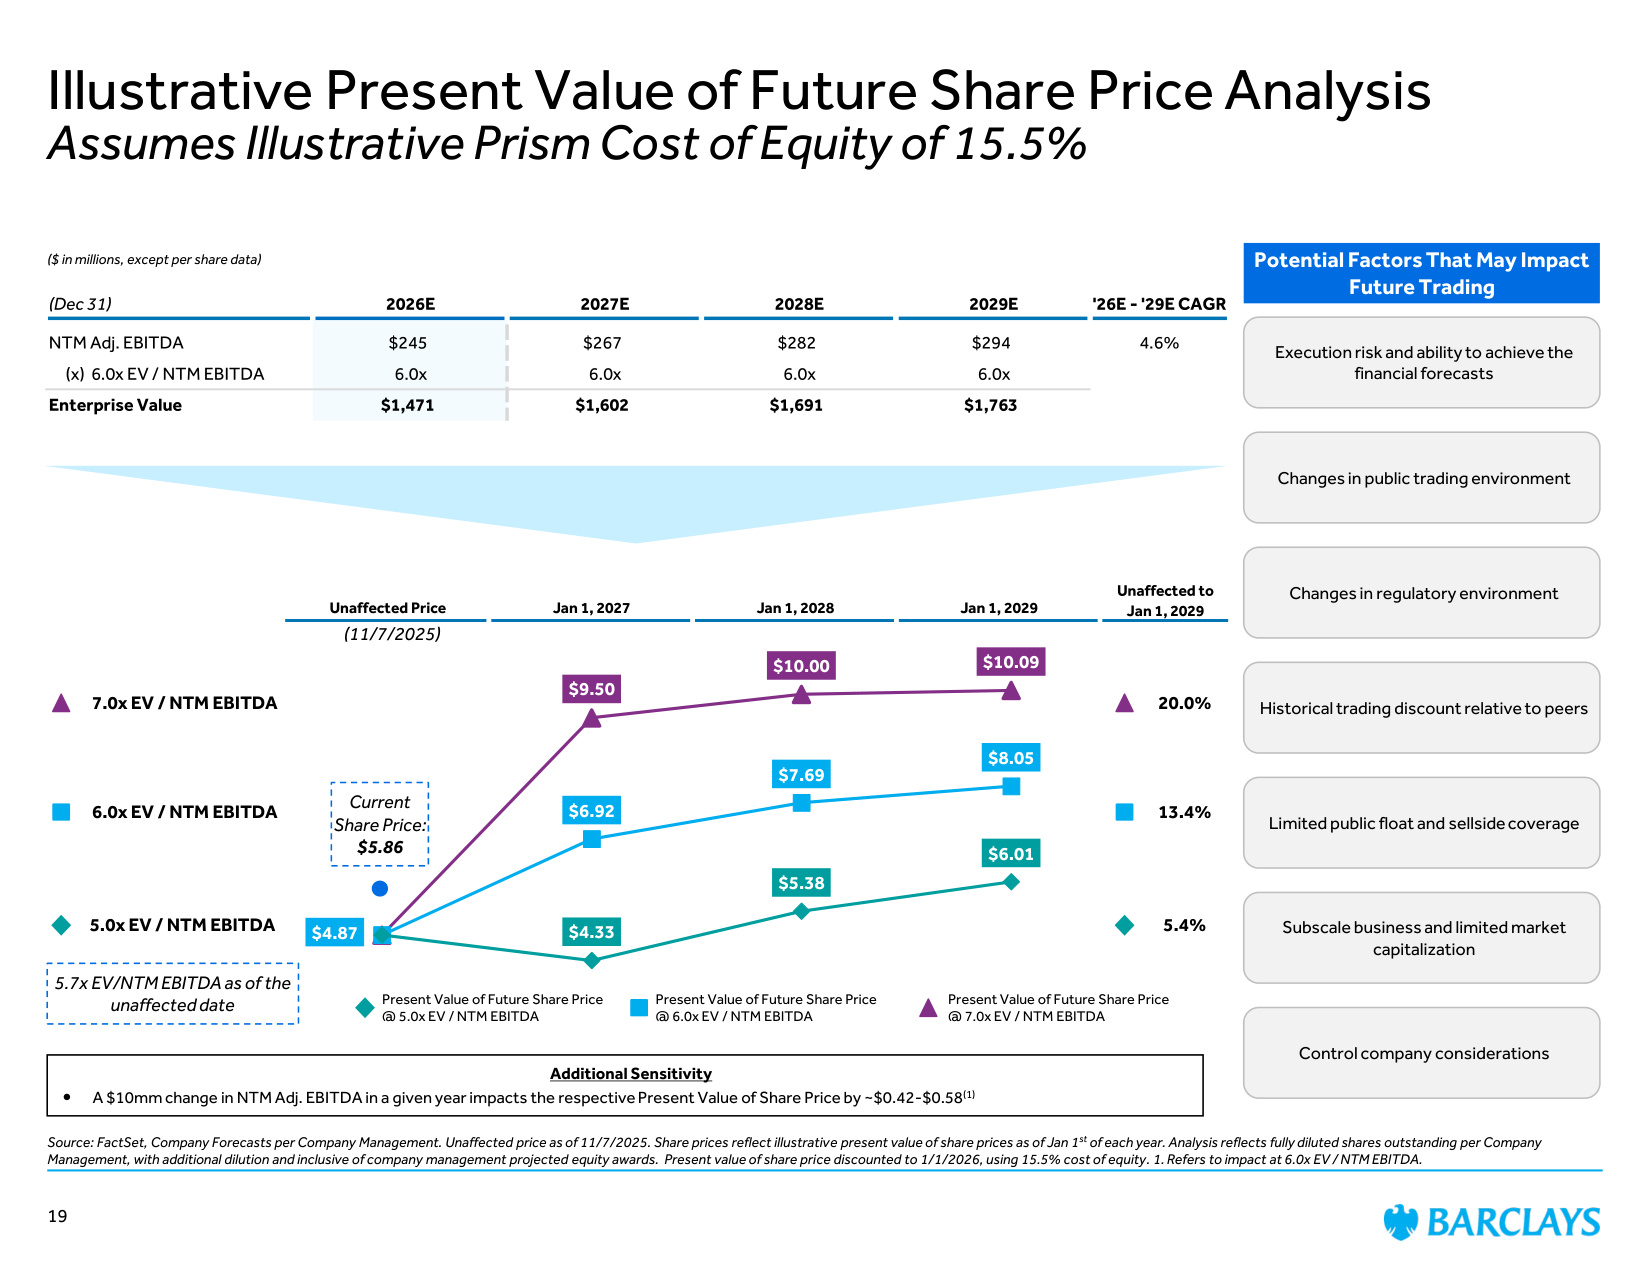
$9.50 $10.00 $10.09 $6.92 $7.69 $8.05 $4.87 $4.33 $5.38 $6.01 Illustrative Present Value of Future Share Price Analysis Assumes Illustrative Prism Cost of Equity of 15.5% Source: FactSet, Company Forecasts per Company Management. Unaffected price as of 11/7/2025. Share prices reflect illustrative present value of share prices as of Jan 1st of each year. Analysis reflects fully diluted shares outstanding per Company Management, with additional dilution and inclusive of company management projected equity awards. Present value of share price discounted to 1/1/2026, using 15.5% cost of equity. 1. Refers to impact at 6.0x EV / NTM EBITDA. 20.0% 13.4% 7.0x EV / NTM EBITDA 6.0x EV / NTM EBITDA (Dec 31) 2026E 2027E 2028E 2029E '26E - '29E CAGR NTM Adj. EBITDA $245 $267 $282 $294 4.6% (x) 6.0x EV / NTM EBITDA 6.0x 6.0x 6.0x 6.0x Enterprise Value $1,471 $1,602 $1,691 $1,763 5.0x EV / NTM EBITDA Unaffected Price Jan 1, 2027 Jan 1, 2028 Jan 1, 2029 Unaffected to Jan 1, 2029 ($ in millions, except per share data) (11/7/2025) Current Share Price: $5.86 Present Value of Future Share Price @ 7.0x EV / NTM EBITDA Present Value of Future Share Price @ 6.0x EV / NTM EBITDA Present Value of Future Share Price @ 5.0x EV / NTM EBITDA 5.4% 5.7x EV/NTM EBITDA as of the unaffected date Potential Factors That May Impact Future Trading Execution risk and ability to achieve the financial forecasts Changes in public trading environment Changes in regulatory environment Historical trading discount relative to peers Limited public float and sellside coverage Subscale business and limited market capitalization Control company considerations 19 Additional Sensitivity A $10mm change in NTM Adj. EBITDA in a given year impacts the respective Present Value of Share Price by ~$0.42-$0.58(1)
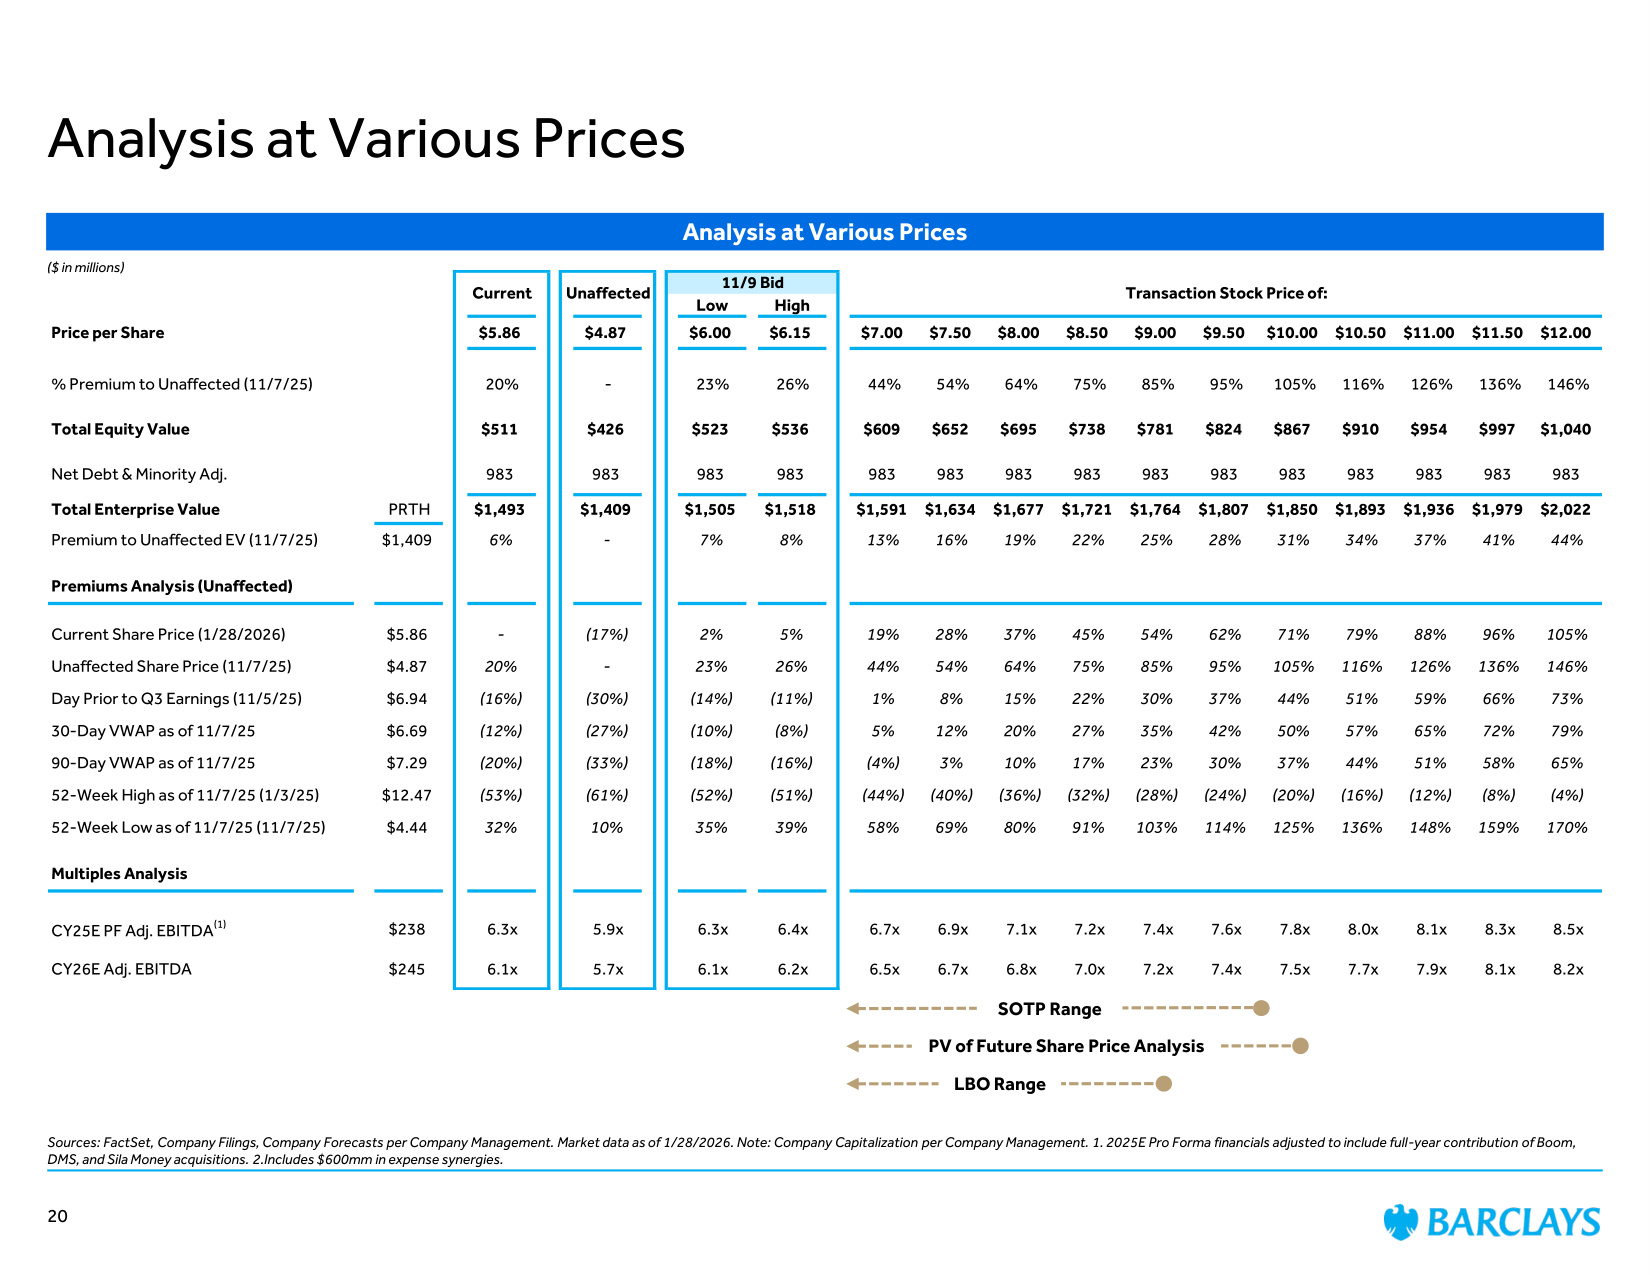
11/9 Bid Low High Price per Share $5.86 $4.87 $6.00 $6.15 $7.00 $7.50 $8.00 $8.50 $9.00 $9.50 $10.00 $10.50 $11.00 $11.50 $12.00 % Premium to Unaffected (11/7/25) 20% - 23% 26% 44% 54% 64% 75% 85% 95% 105% 116% 126% 136% 146% Total Equity Value $511 $426 $523 $536 $609 $652 $695 $738 $781 $824 $867 $910 $954 $997 $1,040 Net Debt & Minority Adj. 983 983 983 983 983 983 983 983 983 983 983 983 983 983 983 Total Enterprise Value PRTH $1,493 $1,409 $1,505 $1,518 $1,591 $1,634 $1,677 $1,721 $1,764 $1,807 $1,850 $1,893 $1,936 $1,979 $2,022 Premium to Unaffected EV (11/7/25) $1,409 6% - 7% 8% 13% 16% 19% 22% 25% 28% 31% 34% 37% 41% 44% Premiums Analysis (Unaffected) Current Share Price (1/28/2026) $5.86 - (17%) 2% 5% 19% 28% 37% 45% 54% 62% 71% 79% 88% 96% 105% Unaffected Share Price (11/7/25) $4.87 20% - 23% 26% 44% 54% 64% 75% 85% 95% 105% 116% 126% 136% 146% Day Prior to Q3 Earnings (11/5/25) $6.94 (16%) (30%) (14%) (11%) 1% 8% 15% 22% 30% 37% 44% 51% 59% 66% 73% 30-Day VWAP as of 11/7/25 $6.69 (12%) (27%) (10%) (8%) 5% 12% 20% 27% 35% 42% 50% 57% 65% 72% 79% 90-Day VWAP as of 11/7/25 $7.29 (20%) (33%) (18%) (16%) (4%) 3% 10% 17% 23% 30% 37% 44% 51% 58% 65% 52-Week High as of 11/7/25 (1/3/25) $12.47 (53%) (61%) (52%) (51%) (44%) (40%) (36%) (32%) (28%) (24%) (20%) (16%) (12%) (8%) (4%) 52-Week Low as of 11/7/25 (11/7/25) $4.44 32% 10% 35% 39% 58% 69% 80% 91% 103% 114% 125% 136% 148% 159% 170% Multiples Analysis CY25E PF Adj. EBITDA(1) $238 6.3x 5.9x 6.3x 6.4x 6.7x 6.9x 7.1x 7.2x 7.4x 7.6x 7.8x 8.0x 8.1x 8.3x 8.5x CY26E Adj. EBITDA $245 6.1x 5.7x 6.1x 6.2x 6.5x 6.7x 6.8x 7.0x 7.2x 7.4x 7.5x 7.7x 7.9x 8.1x 8.2x Current Unaffected Transaction Stock Price of: Analysis at Various Prices Sources: FactSet, Company Filings, Company Forecasts per Company Management. Market data as of 1/28/2026. Note: Company Capitalization per Company Management. 1. 2025E Pro Forma financials adjusted to include full-year contribution of Boom, DMS, and Sila Money acquisitions. 2.Includes $600mm in expense synergies. Analysis at Various Prices ($ in millions) 20 SOTP Range LBO Range PV of Future Share Price Analysis
Appendix
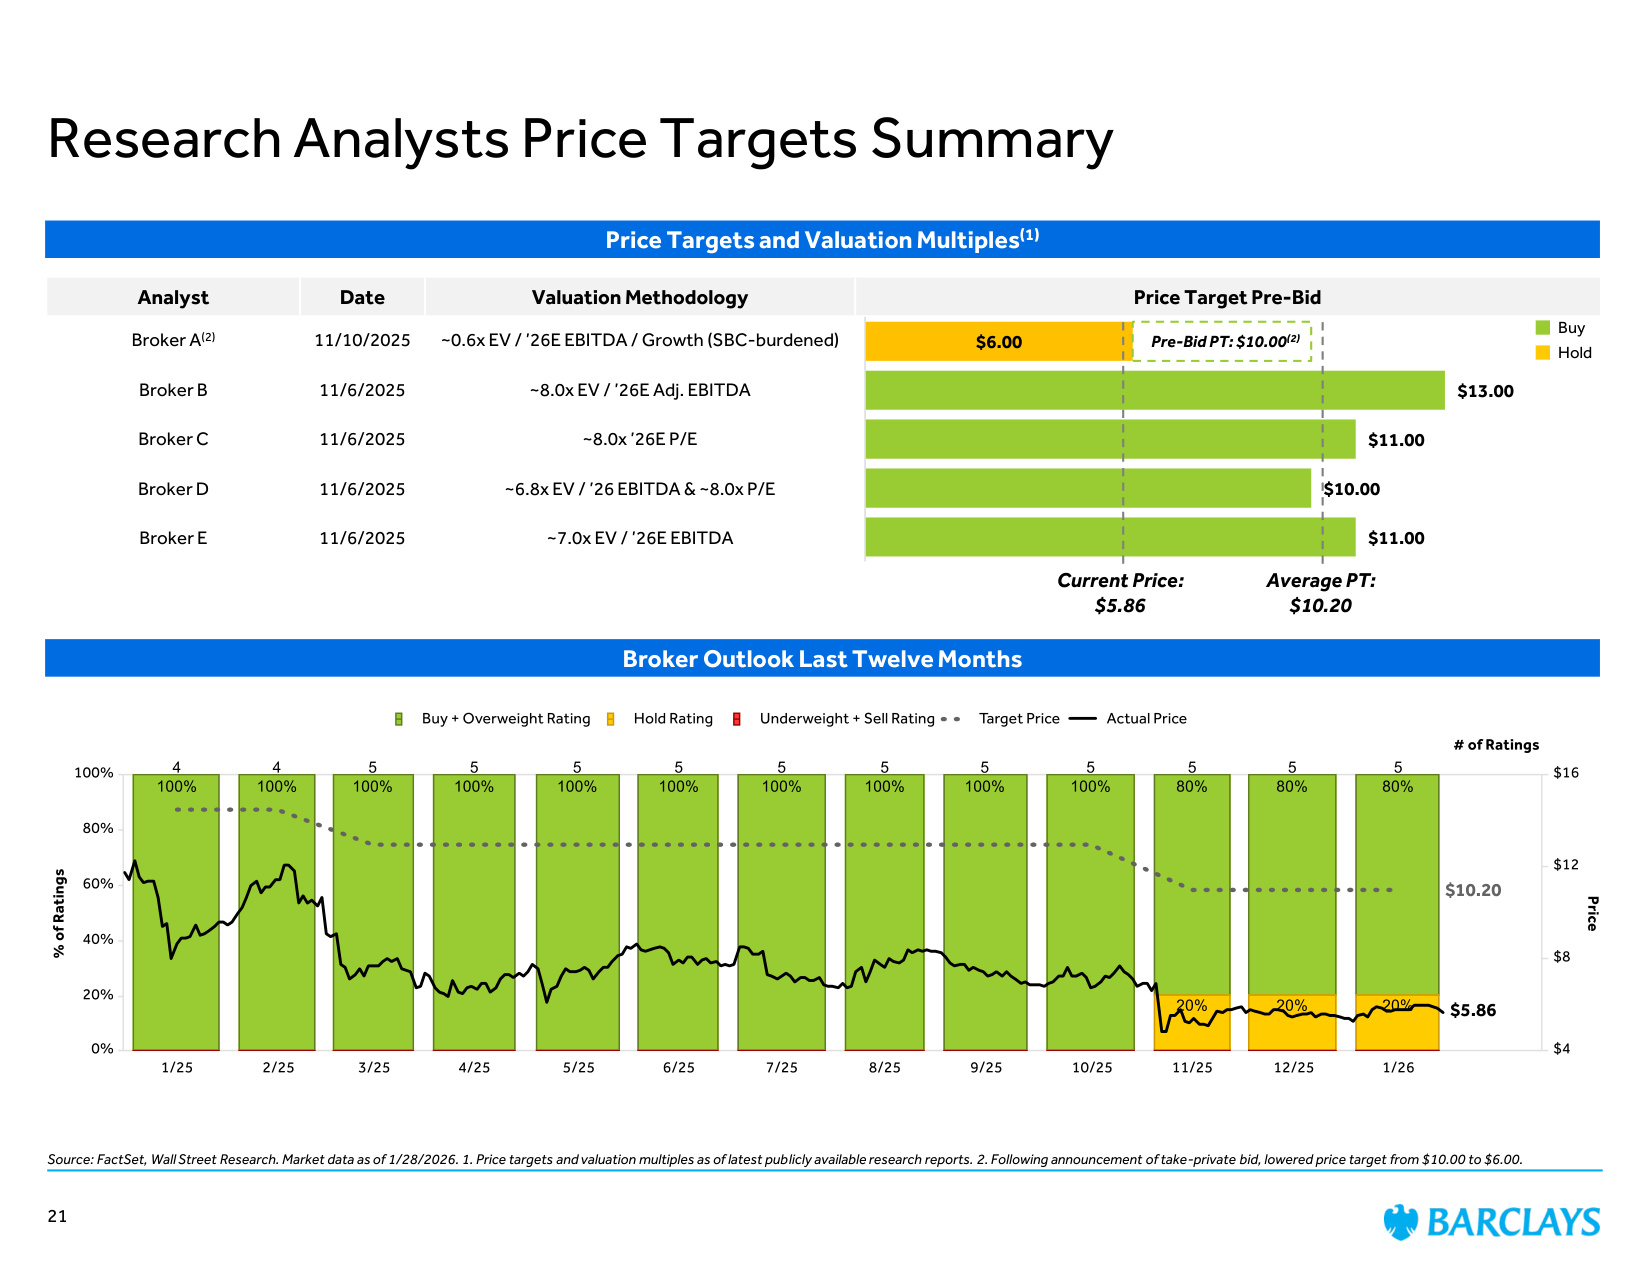
Research Analysts Price Targets Summary Source: FactSet, Wall Street Research. Market data as of 1/28/2026. 1. Price targets and valuation multiples as of latest publicly available research reports. 2. Following announcement of take-private bid, lowered price target from $10.00 to $6.00. Price Targets and Valuation Multiples(1) Broker Outlook Last Twelve Months Analyst Date Valuation Methodology Price Target Pre-Bid Broker A(2) 11/10/2025 ~0.6x EV / '26E EBITDA / Growth (SBC-burdened) Broker B 11/6/2025 ~8.0x EV / '26E Adj. EBITDA Broker C 11/6/2025 ~8.0x '26E P/E Broker D 11/6/2025 ~6.8x EV / '26 EBITDA & ~8.0x P/E Broker E 11/6/2025 ~7.0x EV / '26E EBITDA $6.00 $13.00 $11.00 $10.00 $11.00 Average PT: $10.20 Buy Hold Current Price: $5.86 Pre-Bid PT: $10.00(2) 21 $10.20 $5.86
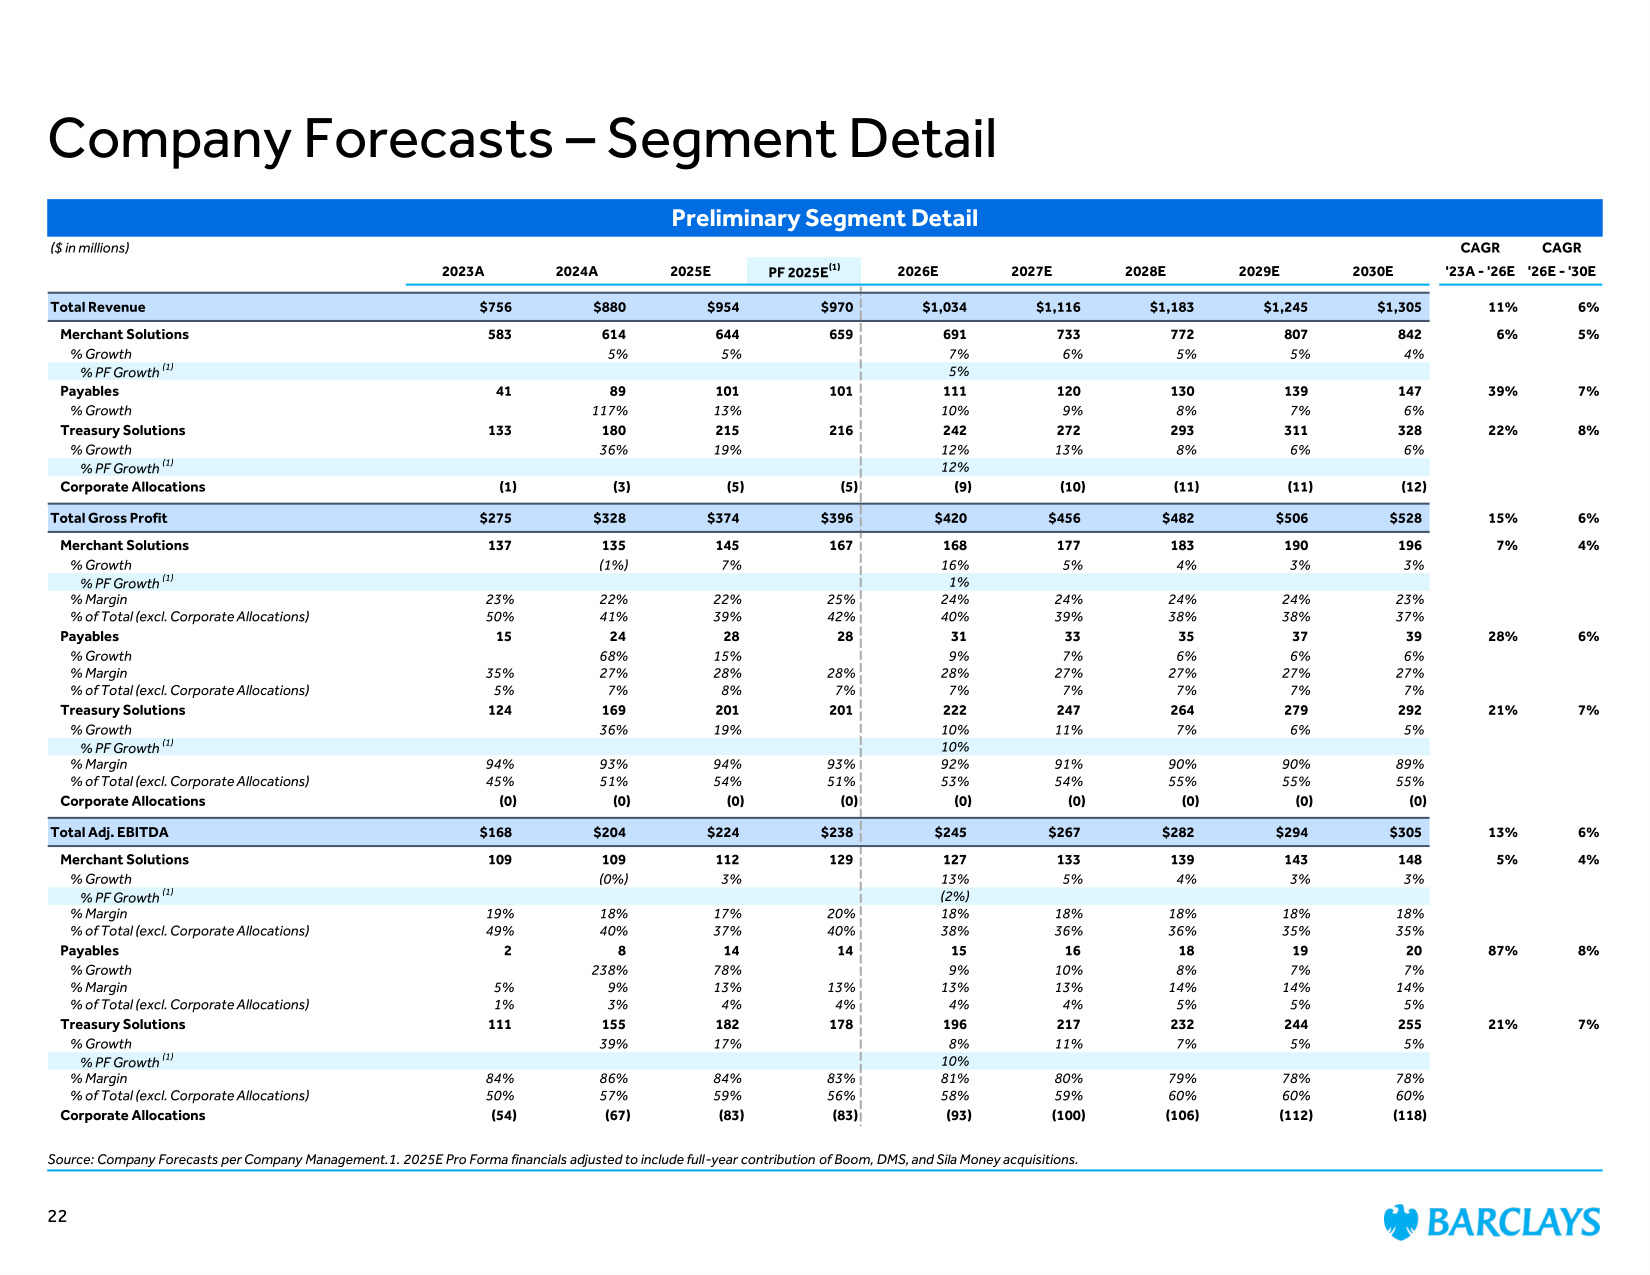
Preliminary Segment Detail ($ in millions) CAGR CAGR 2023A 2024A 2025E PF 2025E(1) 2026E 2027E 2028E 2029E 2030E '23A - '26E '26E - '30E Total Revenue $756 $880 $954 $970 $1,034 $1,116 $1,183 $1,245 $1,305 11% 6% Merchant Solutions 583 614 644 659 691 733 772 807 842 6% 5% % Growth 5% 5% 7% 6% 5% 5% 4% % PF Growth (1) 5% Payables 41 89 101 101 111 120 130 139 147 39% 7% % Growth 117% 13% 10% 9% 8% 7% 6% Treasury Solutions 133 180 215 216 242 272 293 311 328 22% 8% % Growth 36% 19% 12% 13% 8% 6% 6% % PF Growth (1) 12% Corporate Allocations (1) (3) (5) (5) (9) (10) (11) (11) (12) Total Gross Profit $275 $328 $374 $396 $420 $456 $482 $506 $528 15% 6% Merchant Solutions 137 135 145 167 168 177 183 190 196 7% 4% % Growth (1%) 7% 16% 5% 4% 3% 3% % PF Growth (1) 1% % Margin 23% 22% 22% 25% 24% 24% 24% 24% 23% % of Total (excl. Corporate Allocations) 50% 41% 39% 42% 40% 39% 38% 38% 37% Payables 15 24 28 28 31 33 35 37 39 28% 6% % Growth 68% 15% 9% 7% 6% 6% 6% % Margin 35% 27% 28% 28% 28% 27% 27% 27% 27% % of Total (excl. Corporate Allocations) 5% 7% 8% 7% 7% 7% 7% 7% 7% Treasury Solutions 124 169 201 201 222 247 264 279 292 21% 7% % Growth 36% 19% 10% 11% 7% 6% 5% % PF Growth (1) 10% % Margin 94% 93% 94% 93% 92% 91% 90% 90% 89% % of Total (excl. Corporate Allocations) 45% 51% 54% 51% 53% 54% 55% 55% 55% Corporate Allocations (0) (0) (0) (0) (0) (0) (0) (0) (0) Total Adj. EBITDA $168 $204 $224 $238 $245 $267 $282 $294 $305 13% 6% Merchant Solutions 109 109 112 129 127 133 139 143 148 5% 4% % Growth (0%) 3% 13% 5% 4% 3% 3% % PF Growth (1) (2%) % Margin 19% 18% 17% 20% 18% 18% 18% 18% 18% % of Total (excl. Corporate Allocations) 49% 40% 37% 40% 38% 36% 36% 35% 35% Payables 2 8 14 14 15 16 18 19 20 87% 8% % Growth 238% 78% 9% 10% 8% 7% 7% % Margin 5% 9% 13% 13% 13% 13% 14% 14% 14% % of Total (excl. Corporate Allocations) 1% 3% 4% 4% 4% 4% 5% 5% 5% Treasury Solutions 111 155 182 178 196 217 232 244 255 21% 7% % Growth 39% 17% 8% 11% 7% 5% 5% % PF Growth (1) 10% % Margin 84% 86% 84% 83% 81% 80% 79% 78% 78% % of Total (excl. Corporate Allocations) 50% 57% 59% 56% 58% 59% 60% 60% 60% Corporate Allocations (54) (67) (83) (83) (93) (100) (106) (112) (118) Company Forecasts – Segment Detail Source: Company Forecasts per Company Management.1. 2025E Pro Forma financials adjusted to include full-year contribution of Boom, DMS, and Sila Money acquisitions. 22
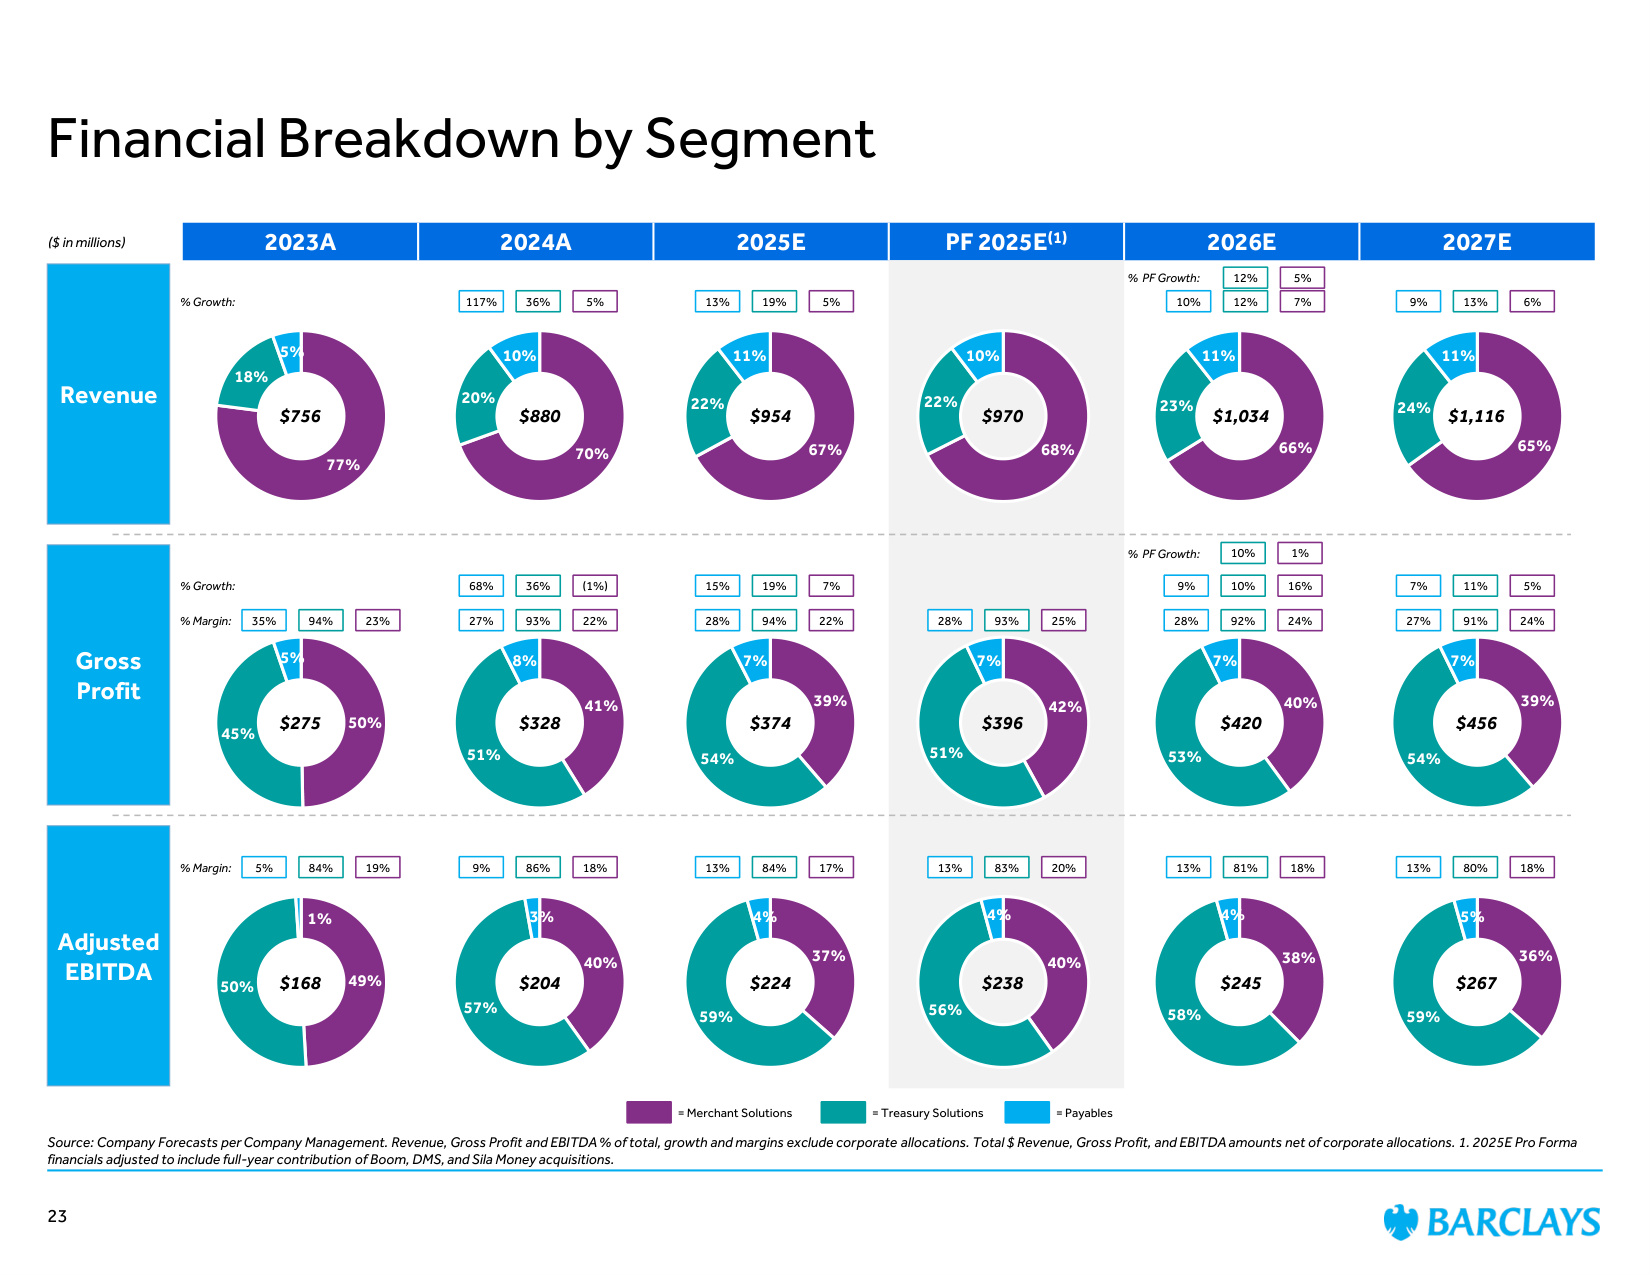
Source: Company Forecasts per Company Management. Revenue, Gross Profit and EBITDA % of total, growth and margins exclude corporate allocations. Total $ Revenue, Gross Profit, and EBITDA amounts net of corporate allocations. 1. 2025E Pro Forma financials adjusted to include full-year contribution of Boom, DMS, and Sila Money acquisitions. Financial Breakdown by Segment Revenue ($ in millions) Adjusted EBITDA 23 Gross Profit 2023A 2024A 2025E PF 2025E(1) 2026E 2027E 77% 18% 5% 70% 20% 10% 67% 22% 11% 68% 22% 10% 66% 23% 11% 50% 45% 5% 41% 51% 8% 39% 54% 7% 42% 51% 7% 40% 53% 7% 49% 50% 1% 40% 57% 3% 37% 59% 4% 40% 56% 4% 38% 58% 4% % Margin: % Margin: % Growth: 5% 117% 36% 5% 13% 19% 7% 10% 12% 6% 9% 13% 22% 27% 93% 22% 28% 94% 25% 28% 93% 24% 27% 91% 18% 9% 86% 17% 13% 84% 20% 13% 83% 18% 13% 81% 23% 35% 94% 19% 5% 84% $954 $970 $1,034 $756 $880 $374 $396 $420 $275 $328 $224 $238 $245 $168 $204 = Merchant Solutions = Payables = Treasury Solutions % Growth: (1%) 68% 36% 7% 15% 19% 5% 7% 11% 24% 28% 92% 16% 9% 10% 65% 24% 11% 39% 54% 7% 36% 59% 5% $1,116 $456 $267 18% 13% 80% 5% 12% % PF Growth: 1% 10% % PF Growth:
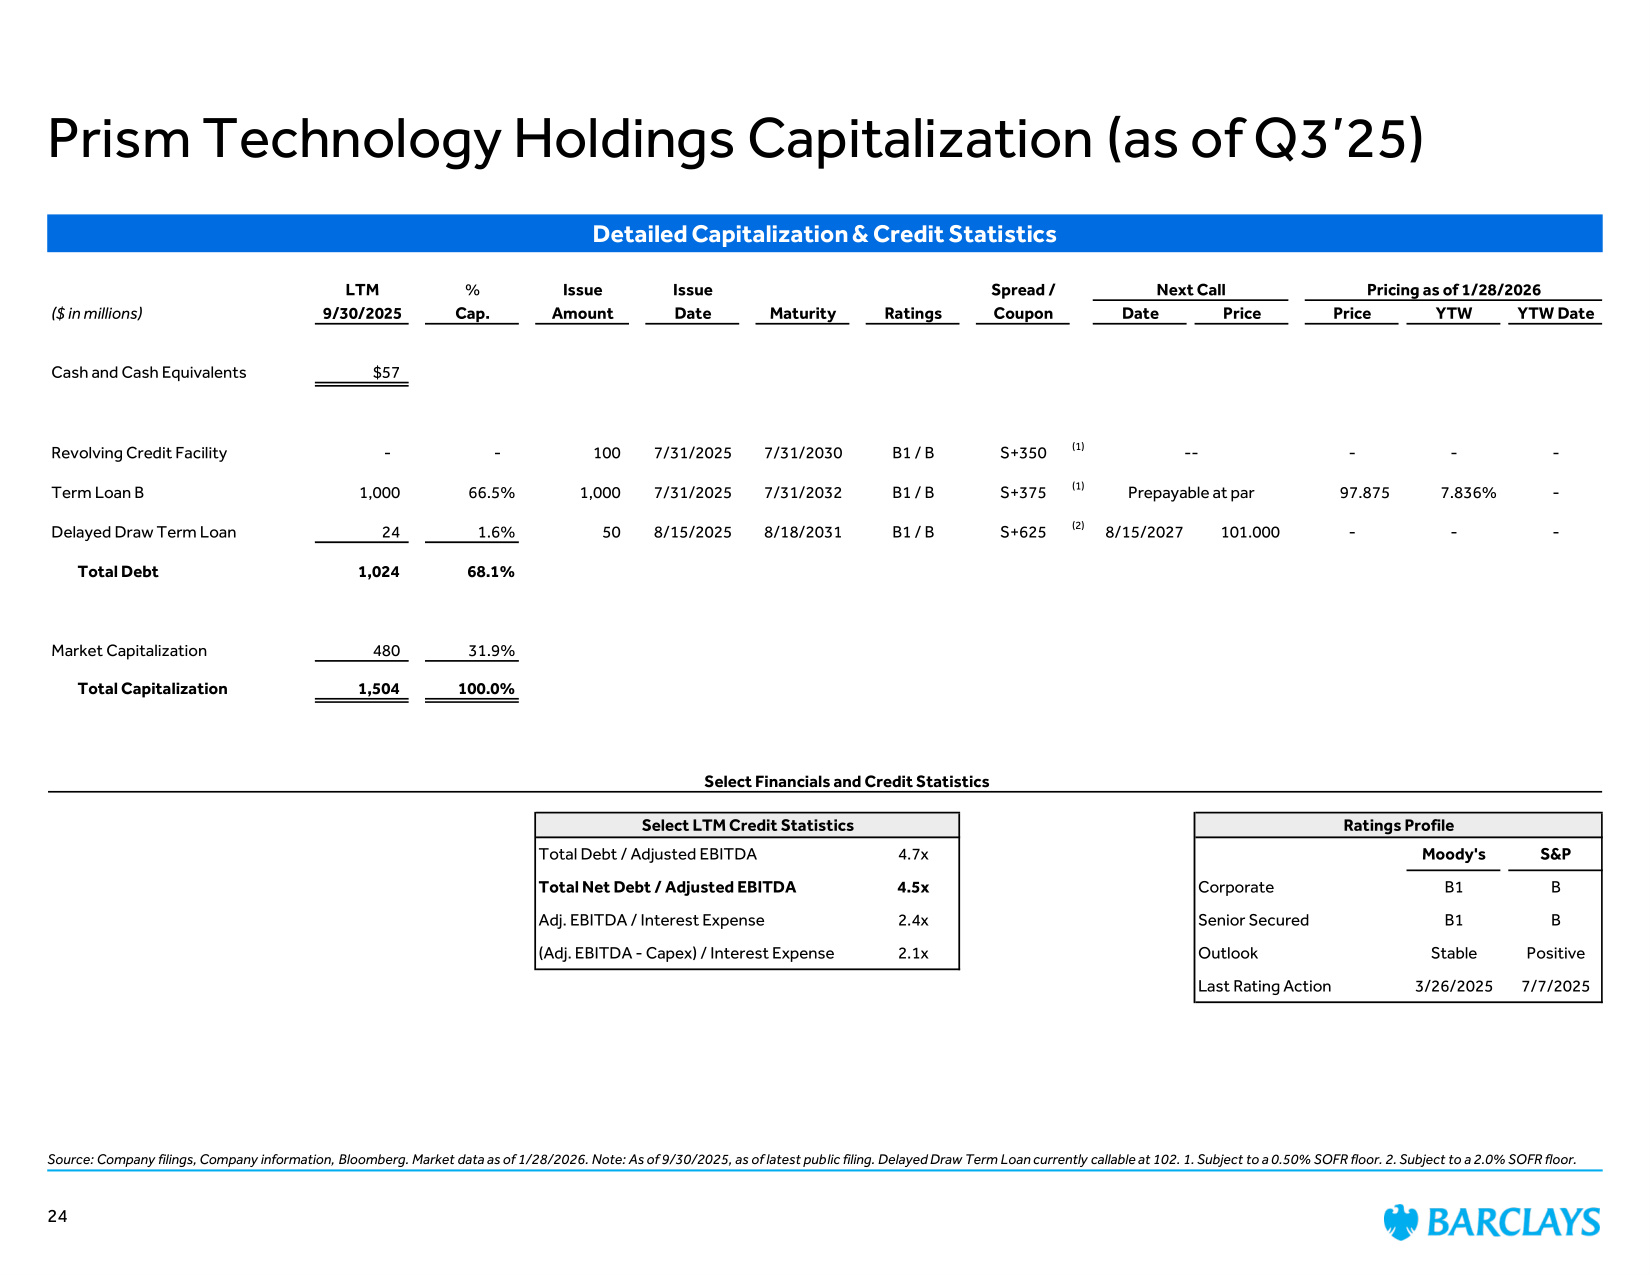
Source: Company filings, Company information, Bloomberg. Market data as of 1/28/2026. Note: As of 9/30/2025, as of latest public filing. Delayed Draw Term Loan currently callable at 102. 1. Subject to a 0.50% SOFR floor. 2. Subject to a 2.0% SOFR floor. Prism Technology Holdings Capitalization (as of Q3'25) Detailed Capitalization & Credit Statistics LTM % Issue Issue Spread / Next Call Pricing as of 1/28/2026 ($ in millions) 9/30/2025 Cap. Amount Date Maturity Ratings Coupon Date Price Price YTW YTW Date Cash and Cash Equivalents $57 Revolving Credit Facility - - 100 7/31/2025 7/31/2030 B1 / B S+350 (1) -- - - - Term Loan B 1,000 66.5% 1,000 7/31/2025 7/31/2032 B1 / B S+375 (1) Prepayable at par 97.875 7.836% - Delayed Draw Term Loan 24 1.6% 50 8/15/2025 8/18/2031 B1 / B S+625 (2) 8/15/2027 101.000 - - - Total Debt 1,024 68.1% Market Capitalization 480 31.9% Total Capitalization 1,504 100.0% Select Financials and Credit Statistics Select LTM Credit Statistics Ratings Profile Total Debt / Adjusted EBITDA 4.7x Moody's S&P Total Net Debt / Adjusted EBITDA 4.5x Corporate B1 B Adj. EBITDA / Interest Expense 2.4x Senior Secured B1 B (Adj. EBITDA - Capex) / Interest Expense 2.1x Outlook Stable Positive Last Rating Action 3/26/2025 7/7/2025 24
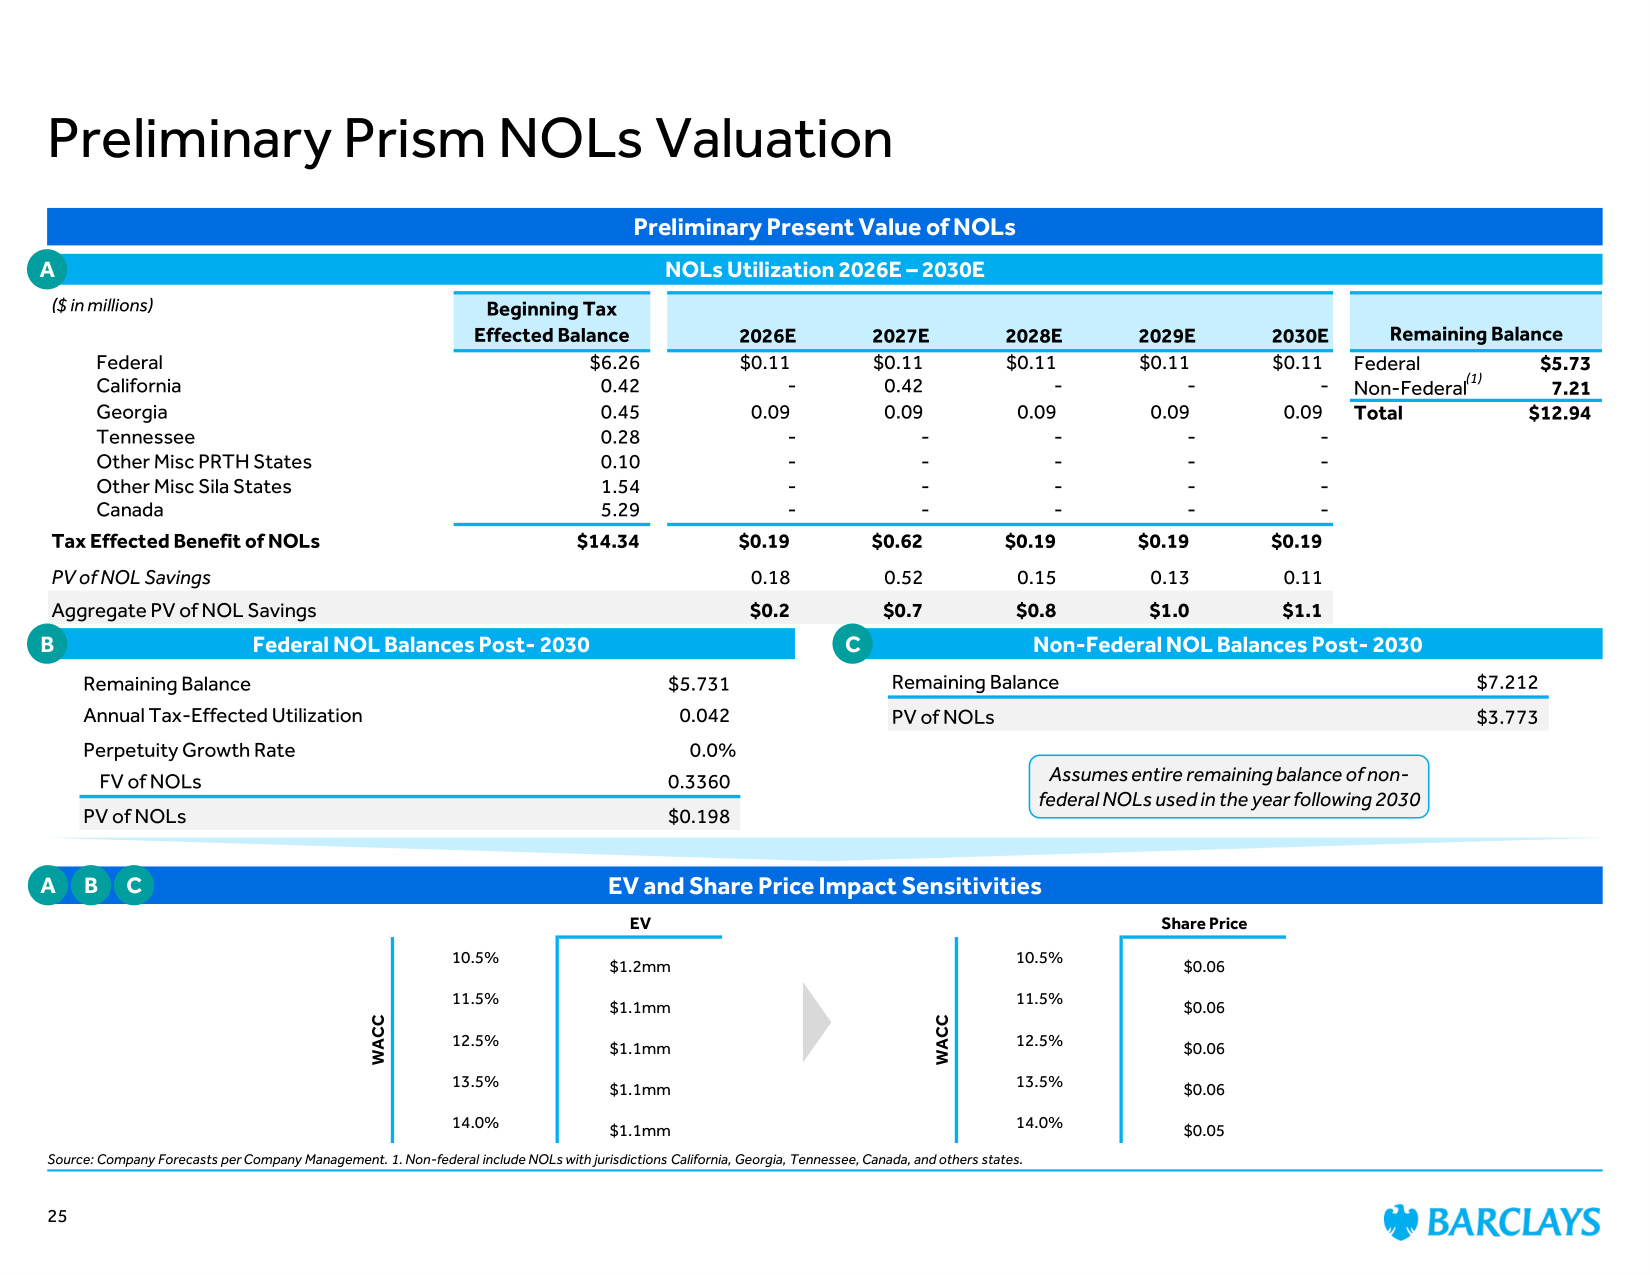
($ in millions) Beginning Tax Effected Balance 2026E 2027E 2028E 2029E 2030E Remaining Balance Federal $6.26 $0.11 $0.11 $0.11 $0.11 $0.11 Federal $5.73 California 0.42 - 0.42 - - - Non-Federal 7.21 Georgia 0.45 0.09 0.09 0.09 0.09 0.09 Total $12.94 Tennessee 0.28 - - - - - Other Misc PRTH States 0.10 - - - - - Other Misc Sila States 1.54 - - - - - Canada 5.29 - - - - - Tax Effected Benefit of NOLs $14.34 $0.19 $0.62 $0.19 $0.19 $0.19 PV of NOL Savings 0.18 0.52 0.15 0.13 0.11 Aggregate PV of NOL Savings $0.2 $0.7 $0.8 $1.0 $1.1 Preliminary Present Value of NOLs EV and Share Price Impact Sensitivities Preliminary Prism NOLs Valuation Source: Company Forecasts per Company Management. 1. Non-federal include NOLs with jurisdictions California, Georgia, Tennessee, Canada, and others states. 25 Remaining Balance $5.731 Annual Tax-Effected Utilization 0.042 Perpetuity Growth Rate 0.0% FV of NOLs 0.3360 PV of NOLs $0.198 NOLs Utilization 2026E – 2030E Federal NOL Balances Post- 2030 Non-Federal NOL Balances Post- 2030 Remaining Balance $7.212 PV of NOLs $3.773 EV Share Price 10.5% $1.2mm 10.5% $0.06 11.5% $1.1mm 11.5% $0.06 12.5% $1.1mm 12.5% $0.06 13.5% $1.1mm 13.5% $0.06 14.0% $1.1mm 14.0% $0.05 WACC WACC Assumes entire remaining balance of non- federal NOLs used in the year following 2030 A B C A B C (1)
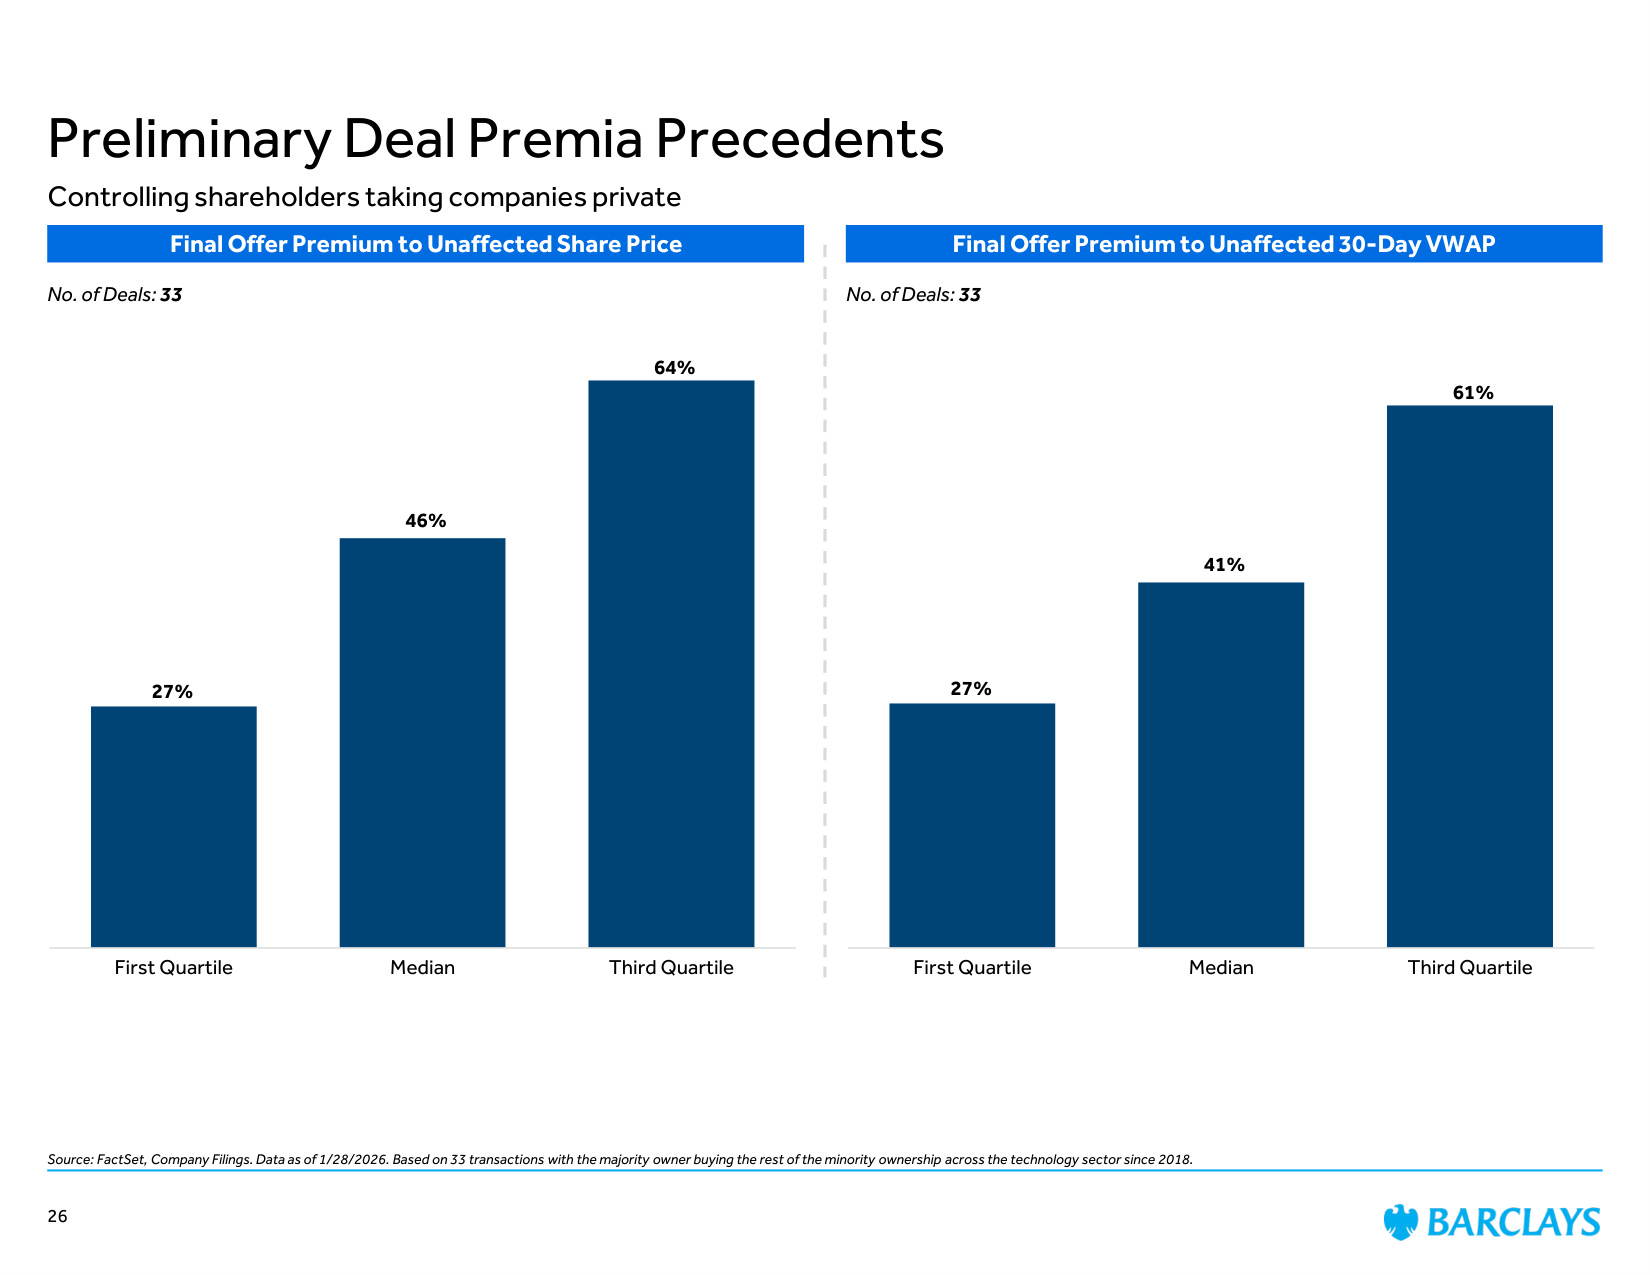
Source: FactSet, Company Filings. Data as of 1/28/2026. Based on 33 transactions with the majority owner buying the rest of the minority ownership across the technology sector since 2018. Controlling shareholders taking companies private 26 Preliminary Deal Premia Precedents 27% 46% 64% First Quartile Median Third Quartile Final Offer Premium to Unaffected Share Price No. of Deals: 33 Final Offer Premium to Unaffected 30-Day VWAP 27% 41% 61% First Quartile Median Third Quartile No. of Deals: 33
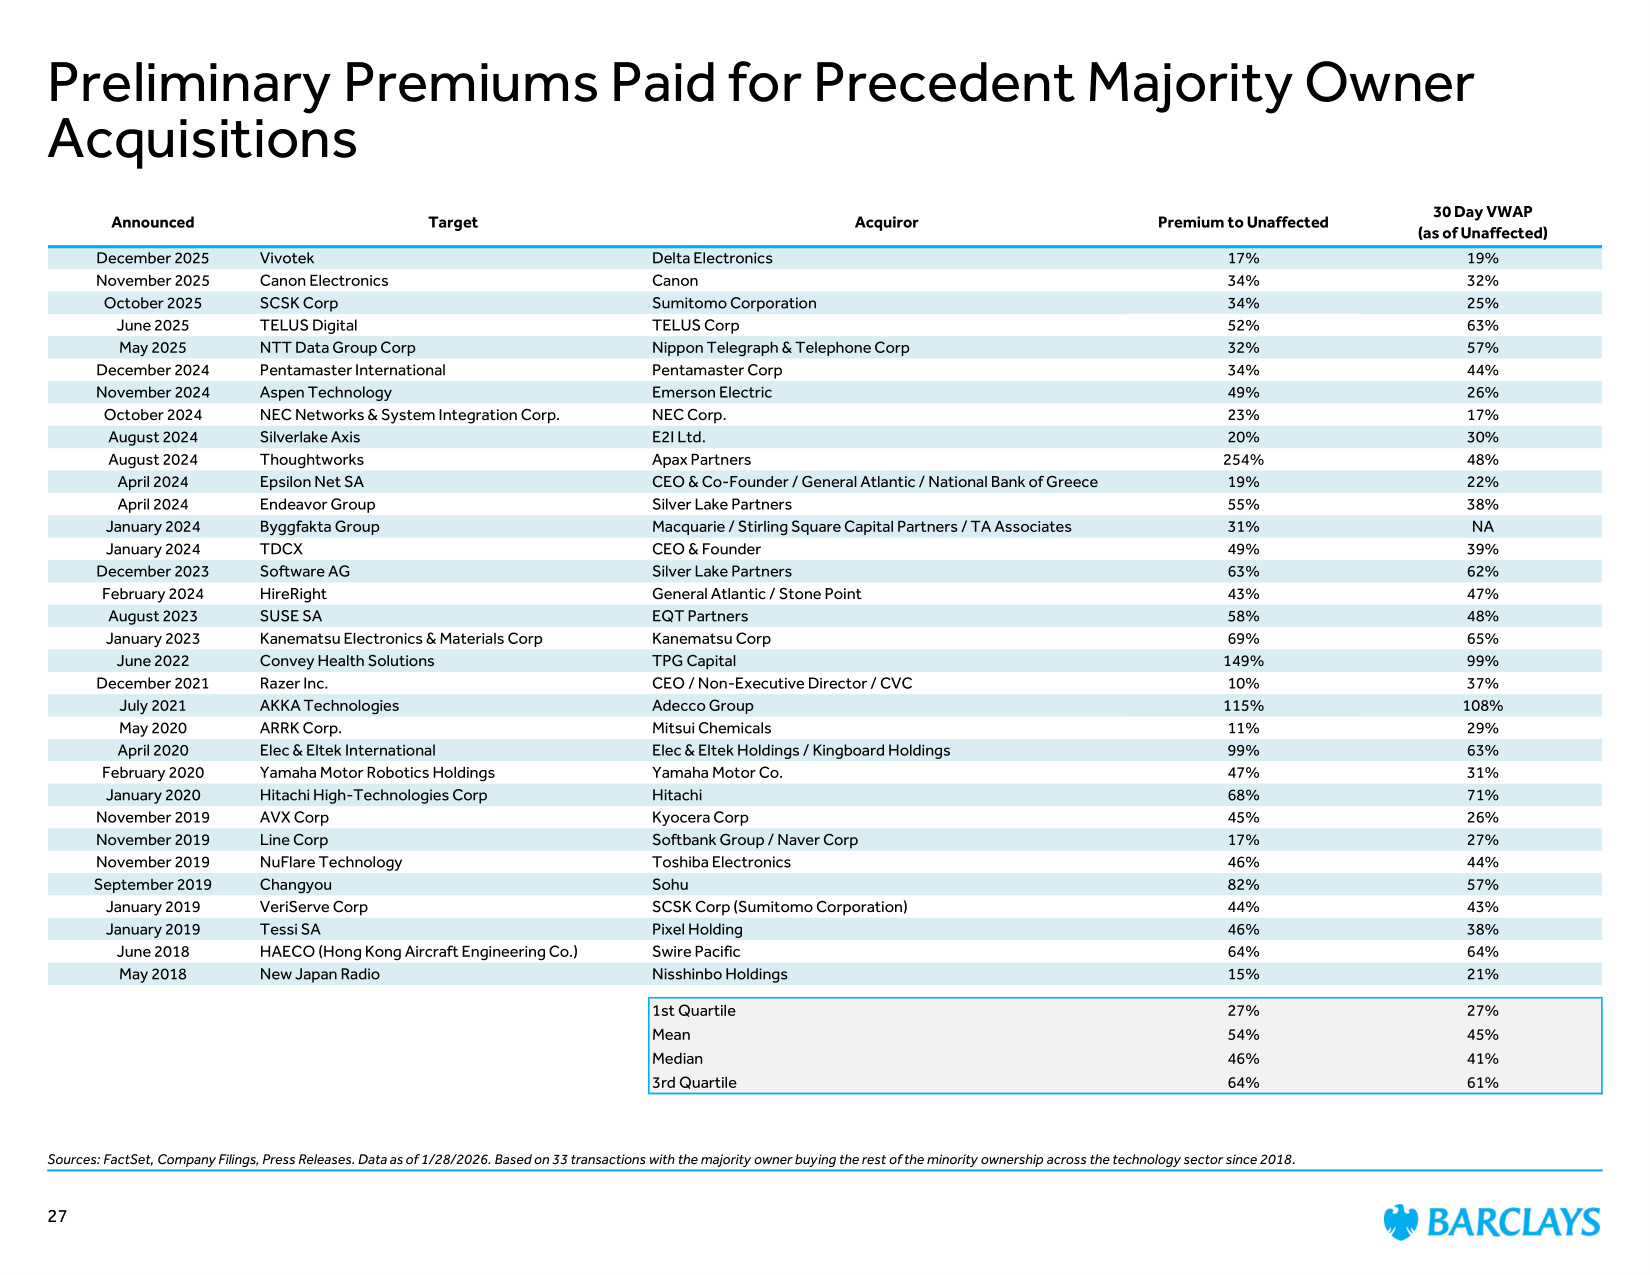
Sources: FactSet, Company Filings, Press Releases. Data as of 1/28/2026. Based on 33 transactions with the majority owner buying the rest of the minority ownership across the technology sector since 2018. Preliminary Premiums Paid for Precedent Majority Owner Acquisitions 27 Announced Target Acquiror Premium to Unaffected 30 Day VWAP (as of Unaffected) December 2025 Vivotek Delta Electronics 17% 19% November 2025 Canon Electronics Canon 34% 32% October 2025 SCSK Corp Sumitomo Corporation 34% 25% June 2025 TELUS Digital TELUS Corp 52% 63% May 2025 NTT Data Group Corp Nippon Telegraph & Telephone Corp 32% 57% December 2024 Pentamaster International Pentamaster Corp 34% 44% November 2024 Aspen Technology Emerson Electric 49% 26% October 2024 NEC Networks & System Integration Corp. NEC Corp. 23% 17% August 2024 Silverlake Axis E2I Ltd. 20% 30% August 2024 Thoughtworks Apax Partners 254% 48% April 2024 Epsilon Net SA CEO & Co-Founder / General Atlantic / National Bank of Greece 19% 22% April 2024 Endeavor Group Silver Lake Partners 55% 38% January 2024 Byggfakta Group Macquarie / Stirling Square Capital Partners / TA Associates 31% NA January 2024 TDCX CEO & Founder 49% 39% December 2023 Software AG Silver Lake Partners 63% 62% February 2024 HireRight General Atlantic / Stone Point 43% 47% August 2023 SUSE SA EQT Partners 58% 48% January 2023 Kanematsu Electronics & Materials Corp Kanematsu Corp 69% 65% June 2022 Convey Health Solutions TPG Capital 149% 99% December 2021 Razer Inc. CEO / Non-Executive Director / CVC 10% 37% July 2021 AKKA Technologies Adecco Group 115% 108% May 2020 ARRK Corp. Mitsui Chemicals 11% 29% April 2020 Elec & Eltek International Elec & Eltek Holdings / Kingboard Holdings 99% 63% February 2020 Yamaha Motor Robotics Holdings Yamaha Motor Co. 47% 31% January 2020 Hitachi High-Technologies Corp Hitachi 68% 71% November 2019 AVX Corp Kyocera Corp 45% 26% November 2019 Line Corp Softbank Group / Naver Corp 17% 27% November 2019 NuFlare Technology Toshiba Electronics 46% 44% September 2019 Changyou Sohu 82% 57% January 2019 VeriServe Corp SCSK Corp (Sumitomo Corporation) 44% 43% January 2019 Tessi SA Pixel Holding 46% 38% June 2018 HAECO (Hong Kong Aircraft Engineering Co.) Swire Pacific 64% 64% May 2018 New Japan Radio Nisshinbo Holdings 15% 21% 1st Quartile 27% 27% Mean 54% 45% Median 46% 41% 3rd Quartile 64% 61%
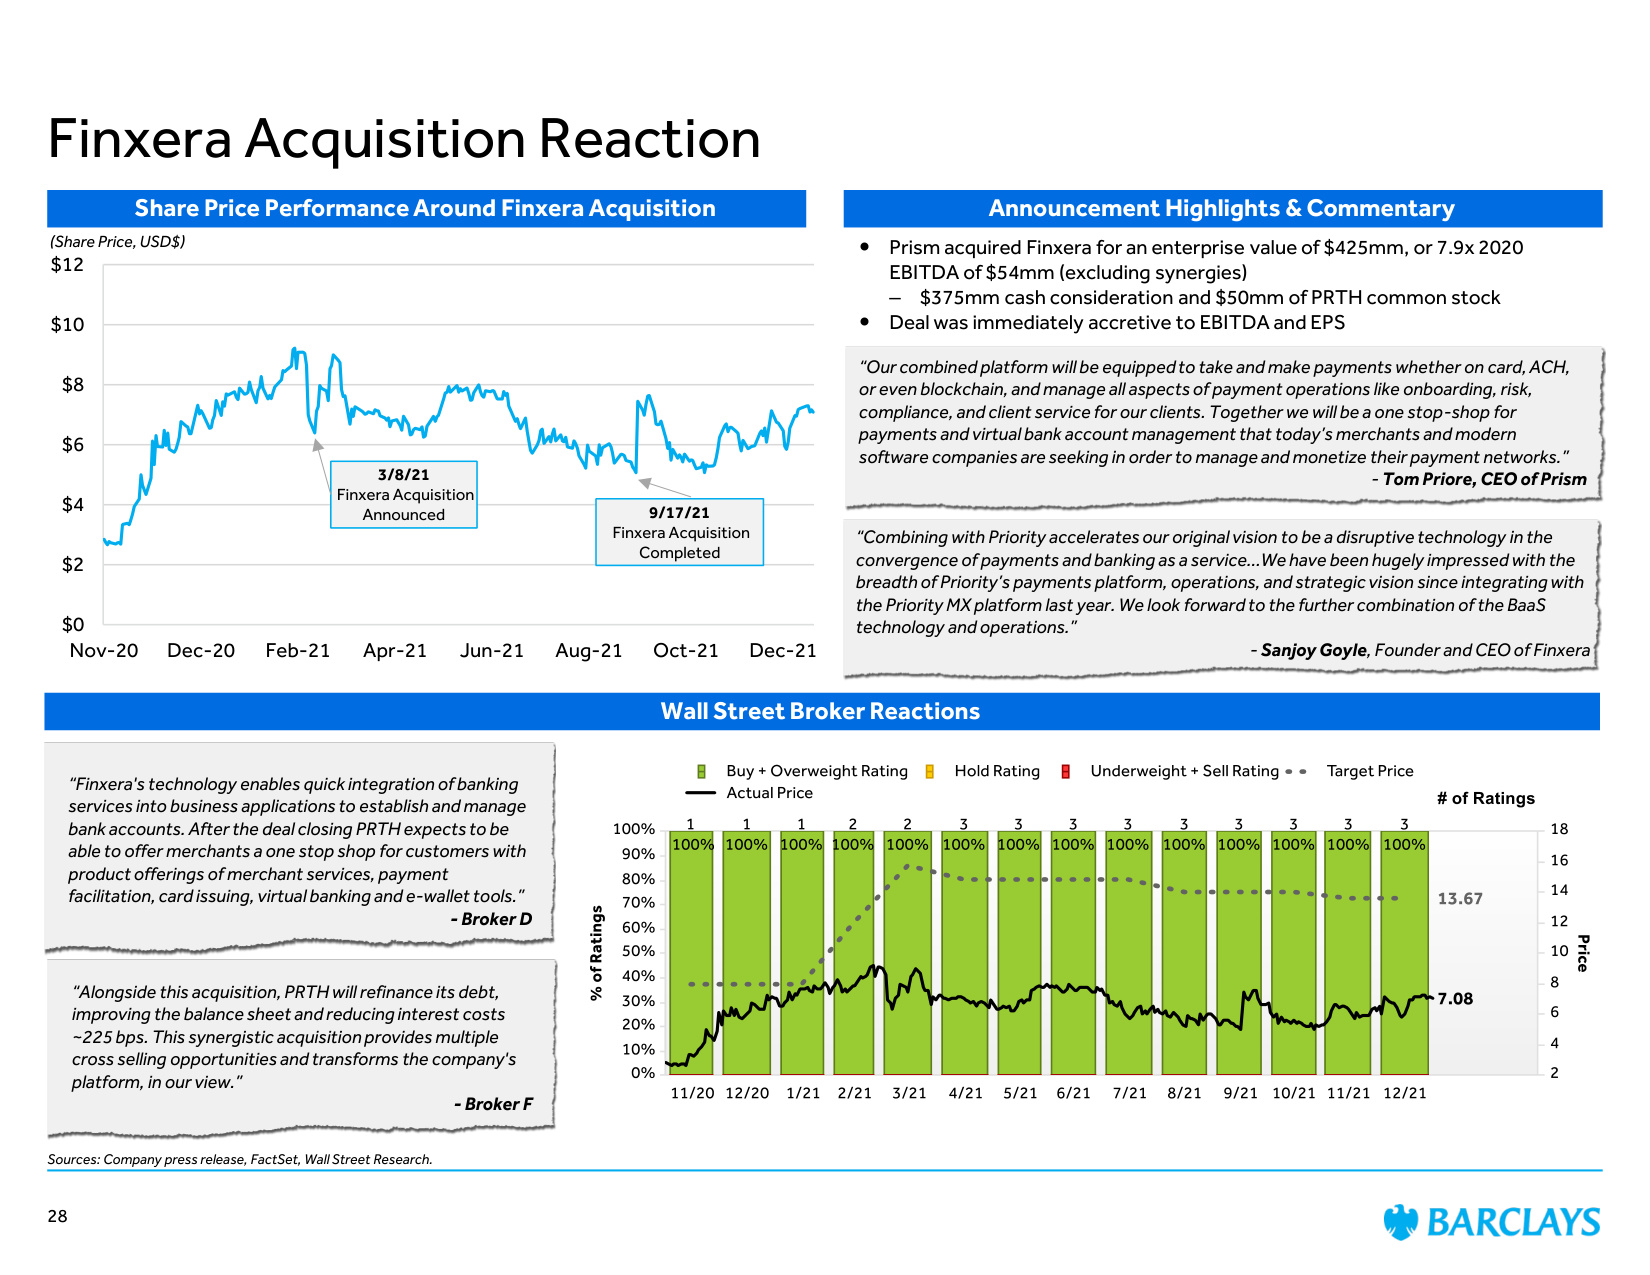
Sources: Company press release, FactSet, Wall Street Research. Finxera Acquisition Reaction Share Price Performance Around Finxera Acquisition (Share Price, USD$) Announcement Highlights & Commentary Wall Street Broker Reactions $0 $2 $4 $6 $8 $10 $12 Nov-20 Dec-20 Feb-21 Apr-21 Jun-21 Aug-21 Oct-21 Dec-21 3/8/21 Finxera Acquisition Announced 9/17/21 Finxera Acquisition Completed "Our combined platform will be equipped to take and make payments whether on card, ACH, or even blockchain, and manage all aspects of payment operations like onboarding, risk, compliance, and client service for our clients. Together we will be a one stop-shop for payments and virtual bank account management that today's merchants and modern software companies are seeking in order to manage and monetize their payment networks." - Tom Priore, CEO of Prism Prism acquired Finxera for an enterprise value of $425mm, or 7.9x 2020 EBITDA of $54mm (excluding synergies) – $375mm cash consideration and $50mm of PRTH common stock Deal was immediately accretive to EBITDA and EPS "Combining with Priority accelerates our original vision to be a disruptive technology in the convergence of payments and banking as a service...We have been hugely impressed with the breadth of Priority's payments platform, operations, and strategic vision since integrating with the Priority MX platform last year. We look forward to the further combination of the BaaS technology and operations." - Sanjoy Goyle, Founder and CEO of Finxera "Finxera's technology enables quick integration of banking services into business applications to establish and manage bank accounts. After the deal closing PRTH expects to be able to offer merchants a one stop shop for customers with product offerings of merchant services, payment facilitation, card issuing, virtual banking and e-wallet tools." - Broker D "Alongside this acquisition, PRTH will refinance its debt, improving the balance sheet and reducing interest costs ~225 bps. This synergistic acquisition provides multiple cross selling opportunities and transforms the company's platform, in our view." - Broker F 28
The following pages contain material that was provided to the Board of Directors (the "Board") of Prism (the "Company") by Barclays Capital Inc. ("Barclays"). The accompanying material and any Barclays presentation related to the material was compiled or prepared on a confidential basis solely for consideration by the Board and no part of it may be reproduced, distributed or transmitted without the prior written consent of Barclays. The information contained in this material was obtained from the Company and/or publicly available sources, and Barclays has relied upon such information without independent verification thereof and does not assume any liability for any such information. These materials are being provided in connection with an actual corporate engagement and may not be used or relied upon for any purpose other than as specifically contemplated by a written agreement with Barclays. Moreover, any information provided herein was not prepared for or intended for use by any individual for personal, family or household purposes. Any estimates, historical financial information, projections and other information contained herein have been prepared by management of the Company or were obtained from publicly available sources (approved for Barclays' use by the Company) or are based upon such estimates and projections. With respect to such estimates and projections, Barclays has assumed that they have been reasonably prepared on a basis reflecting the best currently available estimates, projections and judgment of the management of the Company. The projections contained herein may or may not be achieved and differences between projected results and those actually achieved may be material. No representation or warranty, expressed or implied, is made as to the accuracy or completeness of such information and nothing contained herein is, or shall be relied upon as, a promise or representation, whether as to the past or the future. The analysis contained herein is based on current market conditions which are subject to change and Barclays assumes no obligation to update or otherwise revise these materials. Nothing in these materials shall be deemed to constitute a recommendation or investment, legal, tax, financial, accounting or other advice. Because these materials were prepared for use in the context of a presentation to the Board, these materials are incomplete without reference to, and should be assessed solely in conjunction with, the oral briefing provided by Barclays to the Board (in their capacity as directors and not in any individual capacity and is not for the benefit of any individual, including any individual officer, director, shareholder or any other person). These materials were not prepared for or intended for use by any individual for personal, family or household purposes nor were they prepared to comply with the disclosure standards under state and federal securities laws or any other applicable laws and, to the extent the material may be considered by readers not as familiar with the business and affairs of the Company as the Board, none of the Company, Barclays, their respective affiliates or any of their respective legal or financial advisors or accountants takes any responsibility for the accuracy or completeness of any of the material if used by persons other than the Board. These materials are not intended to provide the sole basis for evaluation of the proposed corporate transaction and do not purport to contain all information that may be required and should not be considered a recommendation with respect to the proposed corporate transaction. Barclays has not made or obtained any evaluations or appraisals of the assets or liabilities of the Company or any other party to any corporate transaction or any of their respective affiliates and has no obligation to evaluate the solvency of the Company or any other party to any transaction under any state or federal laws relating to bankruptcy, insolvency or similar matters. The analyses contained herein do not purport to be appraisals nor do they necessarily reflect the prices at which businesses or securities actually may be sold or purchased. Barclays' role in any due diligence review is limited solely to performing such a review as it shall deem necessary to support its own advice and analysis and shall not be on behalf of the Company, the Board or any individual officer, director, shareholder or any other person. Barclays, its subsidiaries and affiliates engage in a wide range of businesses from investment and commercial banking, lending, asset management and other financial and non-financial services. In the ordinary course of its business, Barclays and its affiliates may actively trade and effect transactions in the equity, debt and/or other securities (and any derivatives thereof) and financial instruments (including loans and other obligations) of the Company for its own account and for the accounts of its customers and, accordingly, may at any time hold long or short positions and investments in such securities and financial instruments or in other financial products and instruments. Unless otherwise expressly agreed or provided for in other applicable Barclays disclosures governing such corporate transactions or required by law or regulation, Barclays conducts these activities as principal and executes its principal transactions as an arm's length counterparty. Barclays does not act as a fiduciary in relation to these corporate transactions. These materials do not constitute investment advice nor do they form part of an offer to sell or purchase, or the solicitation of an offer to sell or purchase, any securities or any of the businesses or assets described herein or an offer of financing or an offer or recommendation to enter into any corporate transaction described herein. Barclays Capital Inc. is the United States investment bank of Barclays Bank PLC. Barclays Bank PLC is authorised by the Prudential Regulation Authority and regulated by the Financial Conduct Authority and the Prudential Regulation Authority (Financial Services Register No. 122702). Registered in England. Registered No. 1026167. Registered office: 1 Churchill Place, London E14 5HP. Neither Barclays Bank PLC, New York Branch nor Barclays Bank Delaware is responsible for the obligations of its affiliates. Copyright Barclays Bank PLC, 2026 (all rights reserved). Disclaimer 29
Exhibit (C)(4)
Discussion Materials February 2026
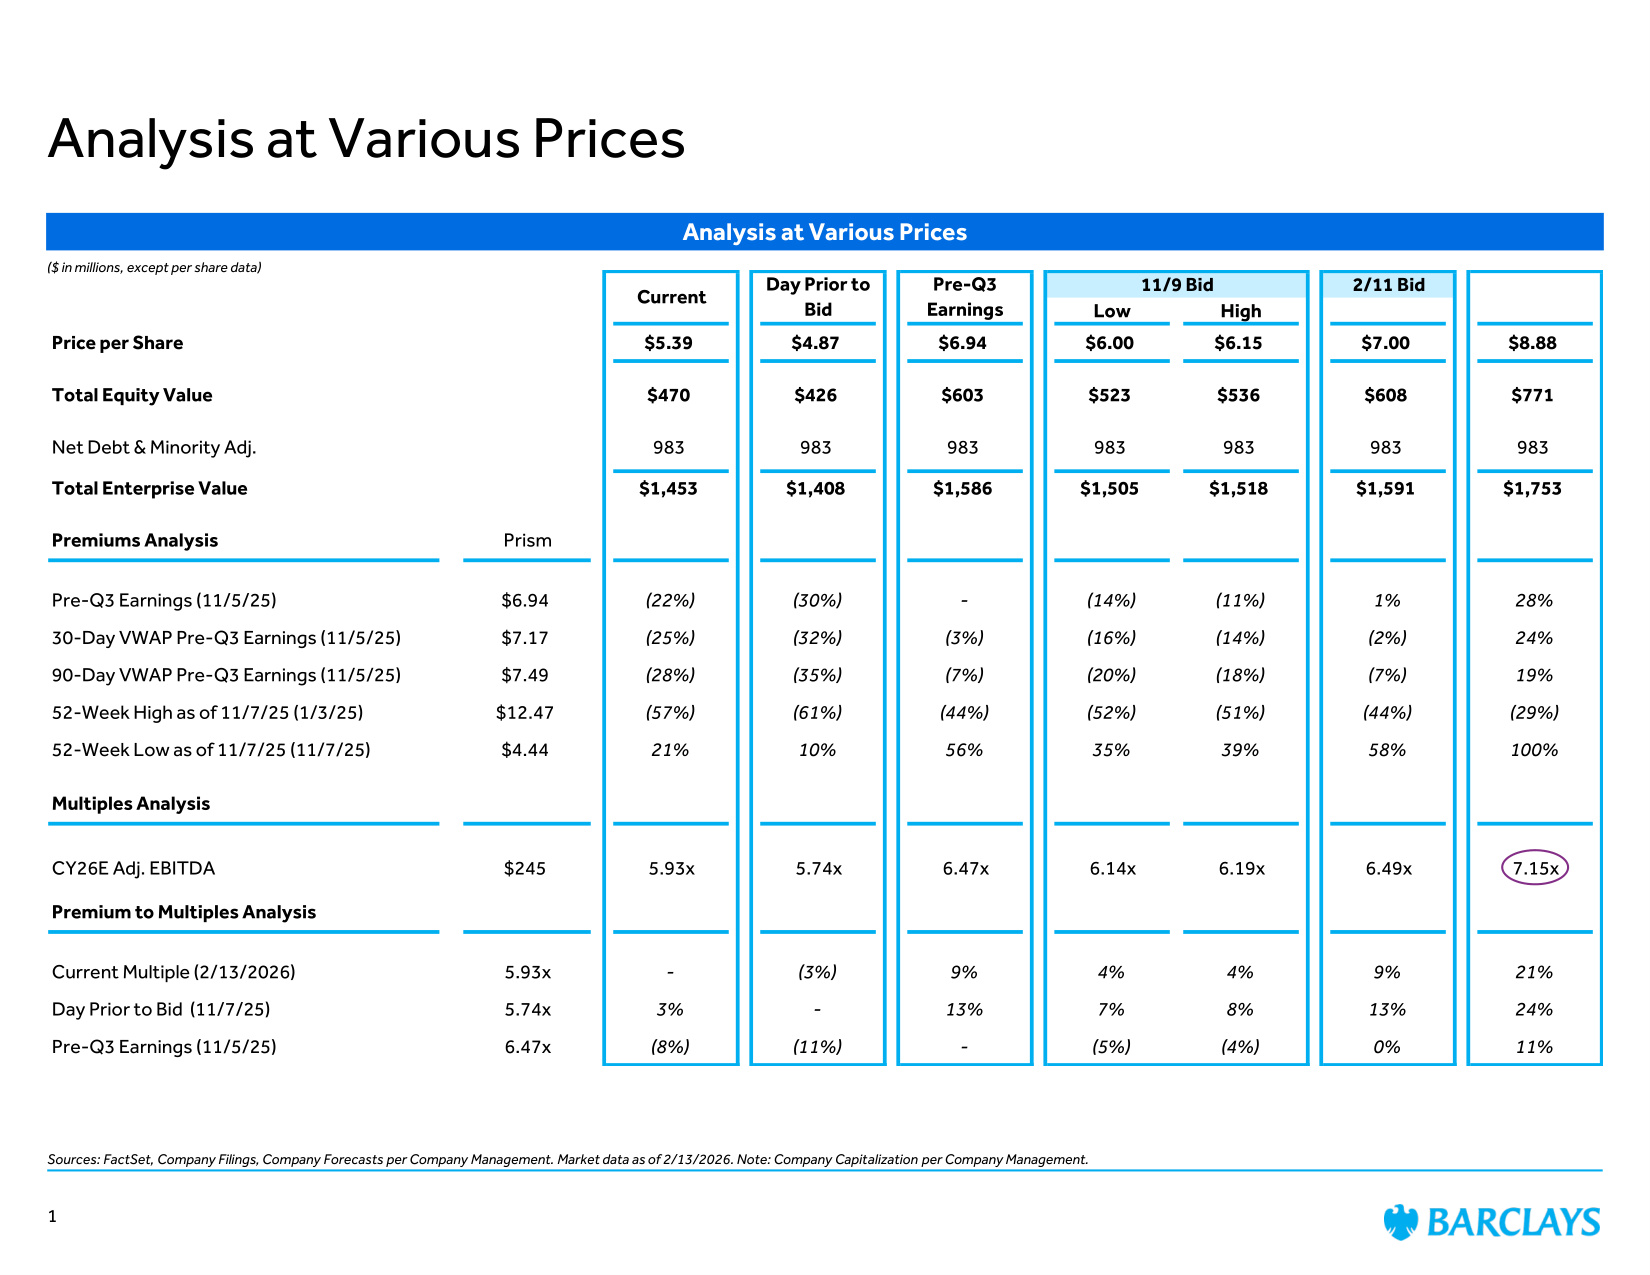
Analysis at Various Prices Sources: FactSet, Company Filings, Company Forecasts per Company Management. Market data as of 2/13/2026. Note: Company Capitalization per Company Management. Analysis at Various Prices ($ in millions, except per share data) 1 11/9 Bid 2/11 Bid Low High Price per Share $5.39 $4.87 $6.94 $6.00 $6.15 $7.00 $8.88 Total Equity Value $470 $426 $603 $523 $536 $608 $771 Net Debt & Minority Adj. 983 983 983 983 983 983 983 Total Enterprise Value $1,453 $1,408 $1,586 $1,505 $1,518 $1,591 $1,753 Premiums Analysis Prism Pre-Q3 Earnings (11/5/25) $6.94 (22%) (30%) - (14%) (11%) 1% 28% 30-Day VWAP Pre-Q3 Earnings (11/5/25) $7.17 (25%) (32%) (3%) (16%) (14%) (2%) 24% 90-Day VWAP Pre-Q3 Earnings (11/5/25) $7.49 (28%) (35%) (7%) (20%) (18%) (7%) 19% 52-Week High as of 11/7/25 (1/3/25) $12.47 (57%) (61%) (44%) (52%) (51%) (44%) (29%) 52-Week Low as of 11/7/25 (11/7/25) $4.44 21% 10% 56% 35% 39% 58% 100% Multiples Analysis CY26E Adj. EBITDA $245 5.93x 5.74x 6.47x 6.14x 6.19x 6.49x 7.15x Premium to Multiples Analysis Current Multiple (2/13/2026) 5.93x - (3%) 9% 4% 4% 9% 21% Day Prior to Bid (11/7/25) 5.74x 3% - 13% 7% 8% 13% 24% Pre-Q3 Earnings (11/5/25) 6.47x (8%) (11%) - (5%) (4%) 0% 11% Current Day Prior to Bid Pre-Q3 Earnings
The following pages contain material that was provided to the Board of Directors (the "Board") of Prism (the "Company") by Barclays Capital Inc. ("Barclays"). The accompanying material and any Barclays presentation related to the material was compiled or prepared on a confidential basis solely for consideration by the Board and no part of it may be reproduced, distributed or transmitted without the prior written consent of Barclays. The information contained in this material was obtained from the Company and/or publicly available sources, and Barclays has relied upon such information without independent verification thereof and does not assume any liability for any such information. These materials are being provided in connection with an actual corporate engagement and may not be used or relied upon for any purpose other than as specifically contemplated by a written agreement with Barclays. Moreover, any information provided herein was not prepared for or intended for use by any individual for personal, family or household purposes. Any estimates, historical financial information, projections and other information contained herein have been prepared by management of the Company or were obtained from publicly available sources (approved for Barclays' use by the Company) or are based upon such estimates and projections. With respect to such estimates and projections, Barclays has assumed that they have been reasonably prepared on a basis reflecting the best currently available estimates, projections and judgment of the management of the Company. The projections contained herein may or may not be achieved and differences between projected results and those actually achieved may be material. No representation or warranty, expressed or implied, is made as to the accuracy or completeness of such information and nothing contained herein is, or shall be relied upon as, a promise or representation, whether as to the past or the future. The analysis contained herein is based on current market conditions which are subject to change and Barclays assumes no obligation to update or otherwise revise these materials. Nothing in these materials shall be deemed to constitute a recommendation or investment, legal, tax, financial, accounting or other advice. Because these materials were prepared for use in the context of a presentation to the Board, these materials are incomplete without reference to, and should be assessed solely in conjunction with, the oral briefing provided by Barclays to the Board (in their capacity as directors and not in any individual capacity and is not for the benefit of any individual, including any individual officer, director, shareholder or any other person). These materials were not prepared for or intended for use by any individual for personal, family or household purposes nor were they prepared to comply with the disclosure standards under state and federal securities laws or any other applicable laws and, to the extent the material may be considered by readers not as familiar with the business and affairs of the Company as the Board, none of the Company, Barclays, their respective affiliates or any of their respective legal or financial advisors or accountants takes any responsibility for the accuracy or completeness of any of the material if used by persons other than the Board. These materials are not intended to provide the sole basis for evaluation of the proposed corporate transaction and do not purport to contain all information that may be required and should not be considered a recommendation with respect to the proposed corporate transaction. Barclays has not made or obtained any evaluations or appraisals of the assets or liabilities of the Company or any other party to any corporate transaction or any of their respective affiliates and has no obligation to evaluate the solvency of the Company or any other party to any transaction under any state or federal laws relating to bankruptcy, insolvency or similar matters. The analyses contained herein do not purport to be appraisals nor do they necessarily reflect the prices at which businesses or securities actually may be sold or purchased. Barclays' role in any due diligence review is limited solely to performing such a review as it shall deem necessary to support its own advice and analysis and shall not be on behalf of the Company, the Board or any individual officer, director, shareholder or any other person. Barclays, its subsidiaries and affiliates engage in a wide range of businesses from investment and commercial banking, lending, asset management and other financial and non-financial services. In the ordinary course of its business, Barclays and its affiliates may actively trade and effect transactions in the equity, debt and/or other securities (and any derivatives thereof) and financial instruments (including loans and other obligations) of the Company for its own account and for the accounts of its customers and, accordingly, may at any time hold long or short positions and investments in such securities and financial instruments or in other financial products and instruments. Unless otherwise expressly agreed or provided for in other applicable Barclays disclosures governing such corporate transactions or required by law or regulation, Barclays conducts these activities as principal and executes its principal transactions as an arm's length counterparty. Barclays does not act as a fiduciary in relation to these corporate transactions. These materials do not constitute investment advice nor do they form part of an offer to sell or purchase, or the solicitation of an offer to sell or purchase, any securities or any of the businesses or assets described herein or an offer of financing or an offer or recommendation to enter into any corporate transaction described herein. Barclays Capital Inc. is the United States investment bank of Barclays Bank PLC. Barclays Bank PLC is authorised by the Prudential Regulation Authority and regulated by the Financial Conduct Authority and the Prudential Regulation Authority (Financial Services Register No. 122702). Registered in England. Registered No. 1026167. Registered office: 1 Churchill Place, London E14 5HP. Neither Barclays Bank PLC, New York Branch nor Barclays Bank Delaware is responsible for the obligations of its affiliates. Copyright Barclays Bank PLC, 2026 (all rights reserved). Disclaimer 2
Exhibit (C)(5)
Discussion Materials February 2026
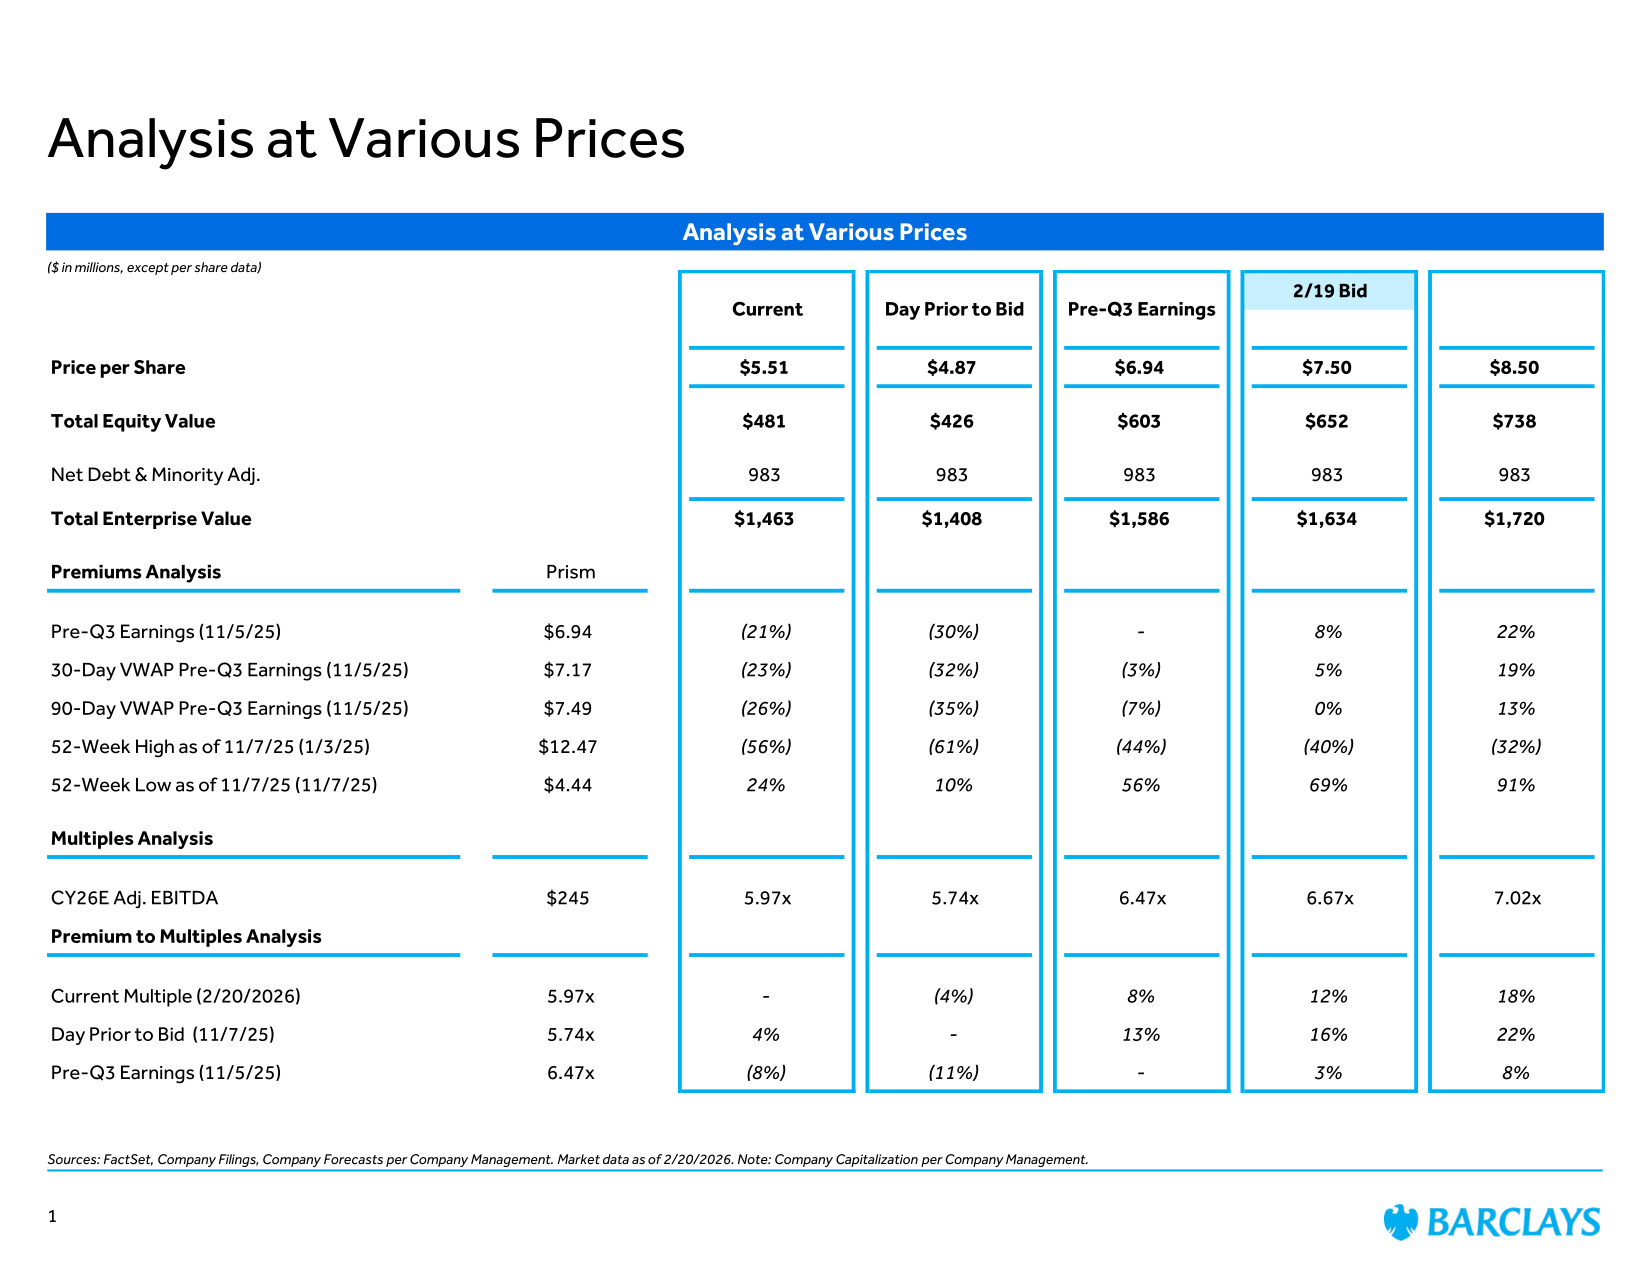
Analysis at Various Prices Sources: FactSet, Company Filings, Company Forecasts per Company Management. Market data as of 2/20/2026. Note: Company Capitalization per Company Management. Analysis at Various Prices ($ in millions, except per share data) 1 2/19 Bid Price per Share $5.51 $4.87 $6.94 $7.50 $8.50 Total Equity Value $481 $426 $603 $652 $738 Net Debt & Minority Adj. 983 983 983 983 983 Total Enterprise Value $1,463 $1,408 $1,586 $1,634 $1,720 Premiums Analysis Prism Pre-Q3 Earnings (11/5/25) $6.94 (21%) (30%) - 8% 22% 30-Day VWAP Pre-Q3 Earnings (11/5/25) $7.17 (23%) (32%) (3%) 5% 19% 90-Day VWAP Pre-Q3 Earnings (11/5/25) $7.49 (26%) (35%) (7%) 0% 13% 52-Week High as of 11/7/25 (1/3/25) $12.47 (56%) (61%) (44%) (40%) (32%) 52-Week Low as of 11/7/25 (11/7/25) $4.44 24% 10% 56% 69% 91% Multiples Analysis CY26E Adj. EBITDA $245 5.97x 5.74x 6.47x 6.67x 7.02x Premium to Multiples Analysis Current Multiple (2/20/2026) 5.97x - (4%) 8% 12% 18% Day Prior to Bid (11/7/25) 5.74x 4% - 13% 16% 22% Pre-Q3 Earnings (11/5/25) 6.47x (8%) (11%) - 3% 8% Current Day Prior to Bid Pre-Q3 Earnings
The following pages contain material that was provided to the Board of Directors (the "Board") of Prism (the "Company") by Barclays Capital Inc. ("Barclays"). The accompanying material and any Barclays presentation related to the material was compiled or prepared on a confidential basis solely for consideration by the Board and no part of it may be reproduced, distributed or transmitted without the prior written consent of Barclays. The information contained in this material was obtained from the Company and/or publicly available sources, and Barclays has relied upon such information without independent verification thereof and does not assume any liability for any such information. These materials are being provided in connection with an actual corporate engagement and may not be used or relied upon for any purpose other than as specifically contemplated by a written agreement with Barclays. Moreover, any information provided herein was not prepared for or intended for use by any individual for personal, family or household purposes. Any estimates, historical financial information, projections and other information contained herein have been prepared by management of the Company or were obtained from publicly available sources (approved for Barclays' use by the Company) or are based upon such estimates and projections. With respect to such estimates and projections, Barclays has assumed that they have been reasonably prepared on a basis reflecting the best currently available estimates, projections and judgment of the management of the Company. The projections contained herein may or may not be achieved and differences between projected results and those actually achieved may be material. No representation or warranty, expressed or implied, is made as to the accuracy or completeness of such information and nothing contained herein is, or shall be relied upon as, a promise or representation, whether as to the past or the future. The analysis contained herein is based on current market conditions which are subject to change and Barclays assumes no obligation to update or otherwise revise these materials. Nothing in these materials shall be deemed to constitute a recommendation or investment, legal, tax, financial, accounting or other advice. Because these materials were prepared for use in the context of a presentation to the Board, these materials are incomplete without reference to, and should be assessed solely in conjunction with, the oral briefing provided by Barclays to the Board (in their capacity as directors and not in any individual capacity and is not for the benefit of any individual, including any individual officer, director, shareholder or any other person). These materials were not prepared for or intended for use by any individual for personal, family or household purposes nor were they prepared to comply with the disclosure standards under state and federal securities laws or any other applicable laws and, to the extent the material may be considered by readers not as familiar with the business and affairs of the Company as the Board, none of the Company, Barclays, their respective affiliates or any of their respective legal or financial advisors or accountants takes any responsibility for the accuracy or completeness of any of the material if used by persons other than the Board. These materials are not intended to provide the sole basis for evaluation of the proposed corporate transaction and do not purport to contain all information that may be required and should not be considered a recommendation with respect to the proposed corporate transaction. Barclays has not made or obtained any evaluations or appraisals of the assets or liabilities of the Company or any other party to any corporate transaction or any of their respective affiliates and has no obligation to evaluate the solvency of the Company or any other party to any transaction under any state or federal laws relating to bankruptcy, insolvency or similar matters. The analyses contained herein do not purport to be appraisals nor do they necessarily reflect the prices at which businesses or securities actually may be sold or purchased. Barclays' role in any due diligence review is limited solely to performing such a review as it shall deem necessary to support its own advice and analysis and shall not be on behalf of the Company, the Board or any individual officer, director, shareholder or any other person. Barclays, its subsidiaries and affiliates engage in a wide range of businesses from investment and commercial banking, lending, asset management and other financial and non-financial services. In the ordinary course of its business, Barclays and its affiliates may actively trade and effect transactions in the equity, debt and/or other securities (and any derivatives thereof) and financial instruments (including loans and other obligations) of the Company for its own account and for the accounts of its customers and, accordingly, may at any time hold long or short positions and investments in such securities and financial instruments or in other financial products and instruments. Unless otherwise expressly agreed or provided for in other applicable Barclays disclosures governing such corporate transactions or required by law or regulation, Barclays conducts these activities as principal and executes its principal transactions as an arm's length counterparty. Barclays does not act as a fiduciary in relation to these corporate transactions. These materials do not constitute investment advice nor do they form part of an offer to sell or purchase, or the solicitation of an offer to sell or purchase, any securities or any of the businesses or assets described herein or an offer of financing or an offer or recommendation to enter into any corporate transaction described herein. Barclays Capital Inc. is the United States investment bank of Barclays Bank PLC. Barclays Bank PLC is authorised by the Prudential Regulation Authority and regulated by the Financial Conduct Authority and the Prudential Regulation Authority (Financial Services Register No. 122702). Registered in England. Registered No. 1026167. Registered office: 1 Churchill Place, London E14 5HP. Neither Barclays Bank PLC, New York Branch nor Barclays Bank Delaware is responsible for the obligations of its affiliates. Copyright Barclays Bank PLC, 2026 (all rights reserved). Disclaimer 2
Exhibit (C)(6)
Project Prism Update February 2026
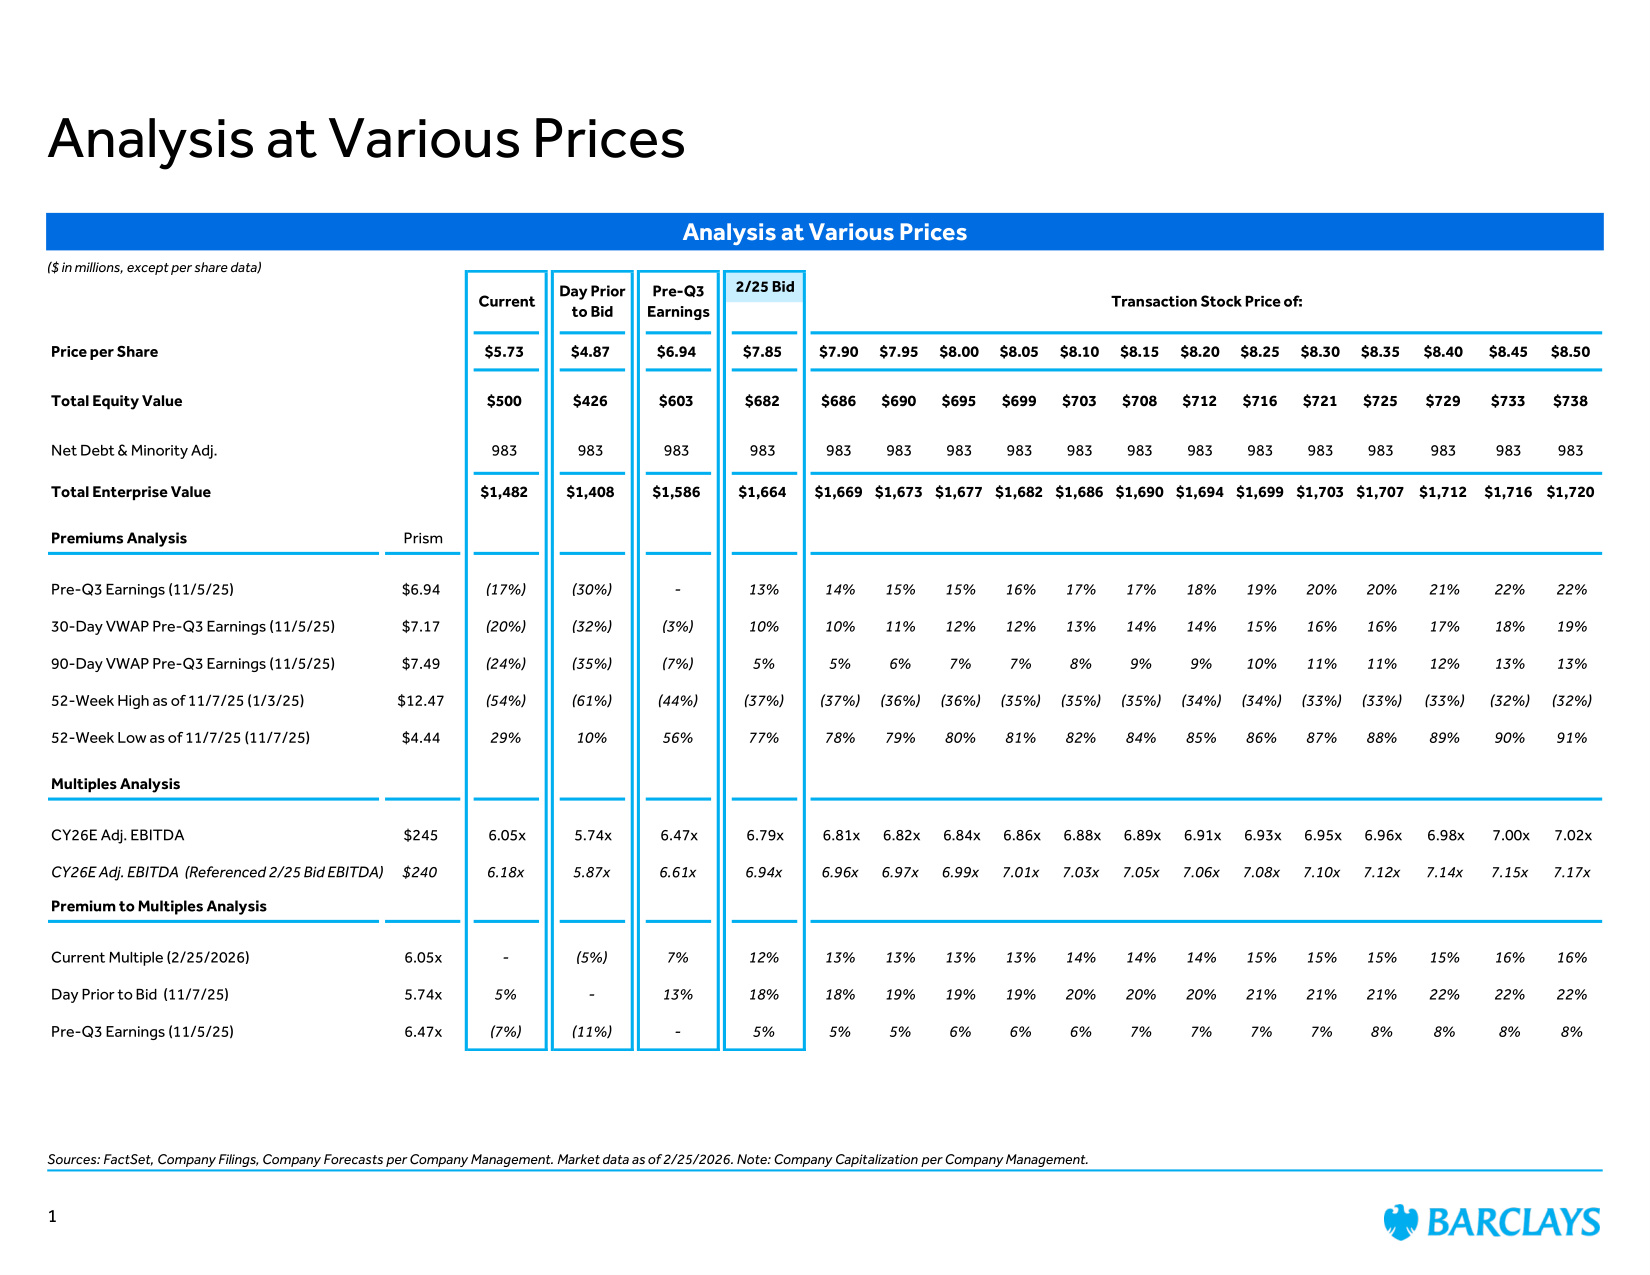
Analysis at Various Prices Sources: FactSet, Company Filings, Company Forecasts per Company Management. Market data as of 2/25/2026. Note: Company Capitalization per Company Management. Analysis at Various Prices ($ in millions, except per share data) 1 2/25 Bid Price per Share $5.73 $4.87 $6.94 $7.85 $7.90 $7.95 $8.00 $8.05 $8.10 $8.15 $8.20 $8.25 $8.30 $8.35 $8.40 $8.45 $8.50 Total Equity Value $500 $426 $603 $682 $686 $690 $695 $699 $703 $708 $712 $716 $721 $725 $729 $733 $738 Net Debt & Minority Adj. 983 983 983 983 983 983 983 983 983 983 983 983 983 983 983 983 983 Total Enterprise Value $1,482 $1,408 $1,586 $1,664 $1,669 $1,673 $1,677 $1,682 $1,686 $1,690 $1,694 $1,699 $1,703 $1,707 $1,712 $1,716 $1,720 Premiums Analysis Prism Pre-Q3 Earnings (11/5/25) $6.94 (17%) (30%) - 13% 14% 15% 15% 16% 17% 17% 18% 19% 20% 20% 21% 22% 22% 30-Day VWAP Pre-Q3 Earnings (11/5/25) $7.17 (20%) (32%) (3%) 10% 10% 11% 12% 12% 13% 14% 14% 15% 16% 16% 17% 18% 19% 90-Day VWAP Pre-Q3 Earnings (11/5/25) $7.49 (24%) (35%) (7%) 5% 5% 6% 7% 7% 8% 9% 9% 10% 11% 11% 12% 13% 13% 52-Week High as of 11/7/25 (1/3/25) $12.47 (54%) (61%) (44%) (37%) (37%) (36%) (36%) (35%) (35%) (35%) (34%) (34%) (33%) (33%) (33%) (32%) (32%) 52-Week Low as of 11/7/25 (11/7/25) $4.44 29% 10% 56% 77% 78% 79% 80% 81% 82% 84% 85% 86% 87% 88% 89% 90% 91% Multiples Analysis CY26E Adj. EBITDA $245 6.05x 5.74x 6.47x 6.79x 6.81x 6.82x 6.84x 6.86x 6.88x 6.89x 6.91x 6.93x 6.95x 6.96x 6.98x 7.00x 7.02x CY26E Adj. EBITDA (Referenced 2/25 Bid EBITDA) $240 6.18x 5.87x 6.61x 6.94x 6.96x 6.97x 6.99x 7.01x 7.03x 7.05x 7.06x 7.08x 7.10x 7.12x 7.14x 7.15x 7.17x Premium to Multiples Analysis Current Multiple (2/25/2026) 6.05x - (5%) 7% 12% 13% 13% 13% 13% 14% 14% 14% 15% 15% 15% 15% 16% 16% Day Prior to Bid (11/7/25) 5.74x 5% - 13% 18% 18% 19% 19% 19% 20% 20% 20% 21% 21% 21% 22% 22% 22% Pre-Q3 Earnings (11/5/25) 6.47x (7%) (11%) - 5% 5% 5% 6% 6% 6% 7% 7% 7% 7% 8% 8% 8% 8% Current Day Prior to Bid Pre-Q3 Earnings Transaction Stock Price of:
The following pages contain material that was provided to the Board of Directors (the "Board") of Prism (the "Company") by Barclays Capital Inc. ("Barclays"). The accompanying material and any Barclays presentation related to the material was compiled or prepared on a confidential basis solely for consideration by the Board and no part of it may be reproduced, distributed or transmitted without the prior written consent of Barclays. The information contained in this material was obtained from the Company and/or publicly available sources, and Barclays has relied upon such information without independent verification thereof and does not assume any liability for any such information. These materials are being provided in connection with an actual corporate engagement and may not be used or relied upon for any purpose other than as specifically contemplated by a written agreement with Barclays. Moreover, any information provided herein was not prepared for or intended for use by any individual for personal, family or household purposes. Any estimates, historical financial information, projections and other information contained herein have been prepared by management of the Company or were obtained from publicly available sources (approved for Barclays' use by the Company) or are based upon such estimates and projections. With respect to such estimates and projections, Barclays has assumed that they have been reasonably prepared on a basis reflecting the best currently available estimates, projections and judgment of the management of the Company. The projections contained herein may or may not be achieved and differences between projected results and those actually achieved may be material. No representation or warranty, expressed or implied, is made as to the accuracy or completeness of such information and nothing contained herein is, or shall be relied upon as, a promise or representation, whether as to the past or the future. The analysis contained herein is based on current market conditions which are subject to change and Barclays assumes no obligation to update or otherwise revise these materials. Nothing in these materials shall be deemed to constitute a recommendation or investment, legal, tax, financial, accounting or other advice. Because these materials were prepared for use in the context of a presentation to the Board, these materials are incomplete without reference to, and should be assessed solely in conjunction with, the oral briefing provided by Barclays to the Board (in their capacity as directors and not in any individual capacity and is not for the benefit of any individual, including any individual officer, director, shareholder or any other person). These materials were not prepared for or intended for use by any individual for personal, family or household purposes nor were they prepared to comply with the disclosure standards under state and federal securities laws or any other applicable laws and, to the extent the material may be considered by readers not as familiar with the business and affairs of the Company as the Board, none of the Company, Barclays, their respective affiliates or any of their respective legal or financial advisors or accountants takes any responsibility for the accuracy or completeness of any of the material if used by persons other than the Board. These materials are not intended to provide the sole basis for evaluation of the proposed corporate transaction and do not purport to contain all information that may be required and should not be considered a recommendation with respect to the proposed corporate transaction. Barclays has not made or obtained any evaluations or appraisals of the assets or liabilities of the Company or any other party to any corporate transaction or any of their respective affiliates and has no obligation to evaluate the solvency of the Company or any other party to any transaction under any state or federal laws relating to bankruptcy, insolvency or similar matters. The analyses contained herein do not purport to be appraisals nor do they necessarily reflect the prices at which businesses or securities actually may be sold or purchased. Barclays' role in any due diligence review is limited solely to performing such a review as it shall deem necessary to support its own advice and analysis and shall not be on behalf of the Company, the Board or any individual officer, director, shareholder or any other person. Barclays, its subsidiaries and affiliates engage in a wide range of businesses from investment and commercial banking, lending, asset management and other financial and non-financial services. In the ordinary course of its business, Barclays and its affiliates may actively trade and effect transactions in the equity, debt and/or other securities (and any derivatives thereof) and financial instruments (including loans and other obligations) of the Company for its own account and for the accounts of its customers and, accordingly, may at any time hold long or short positions and investments in such securities and financial instruments or in other financial products and instruments. Unless otherwise expressly agreed or provided for in other applicable Barclays disclosures governing such corporate transactions or required by law or regulation, Barclays conducts these activities as principal and executes its principal transactions as an arm's length counterparty. Barclays does not act as a fiduciary in relation to these corporate transactions. These materials do not constitute investment advice nor do they form part of an offer to sell or purchase, or the solicitation of an offer to sell or purchase, any securities or any of the businesses or assets described herein or an offer of financing or an offer or recommendation to enter into any corporate transaction described herein. Barclays Capital Inc. is the United States investment bank of Barclays Bank PLC. Barclays Bank PLC is authorised by the Prudential Regulation Authority and regulated by the Financial Conduct Authority and the Prudential Regulation Authority (Financial Services Register No. 122702). Registered in England. Registered No. 1026167. Registered office: 1 Churchill Place, London E14 5HP. Neither Barclays Bank PLC, New York Branch nor Barclays Bank Delaware is responsible for the obligations of its affiliates. Copyright Barclays Bank PLC, 2026 (all rights reserved). Disclaimer 2
Exhibit (C)(7)
Project Prism Update May 2026
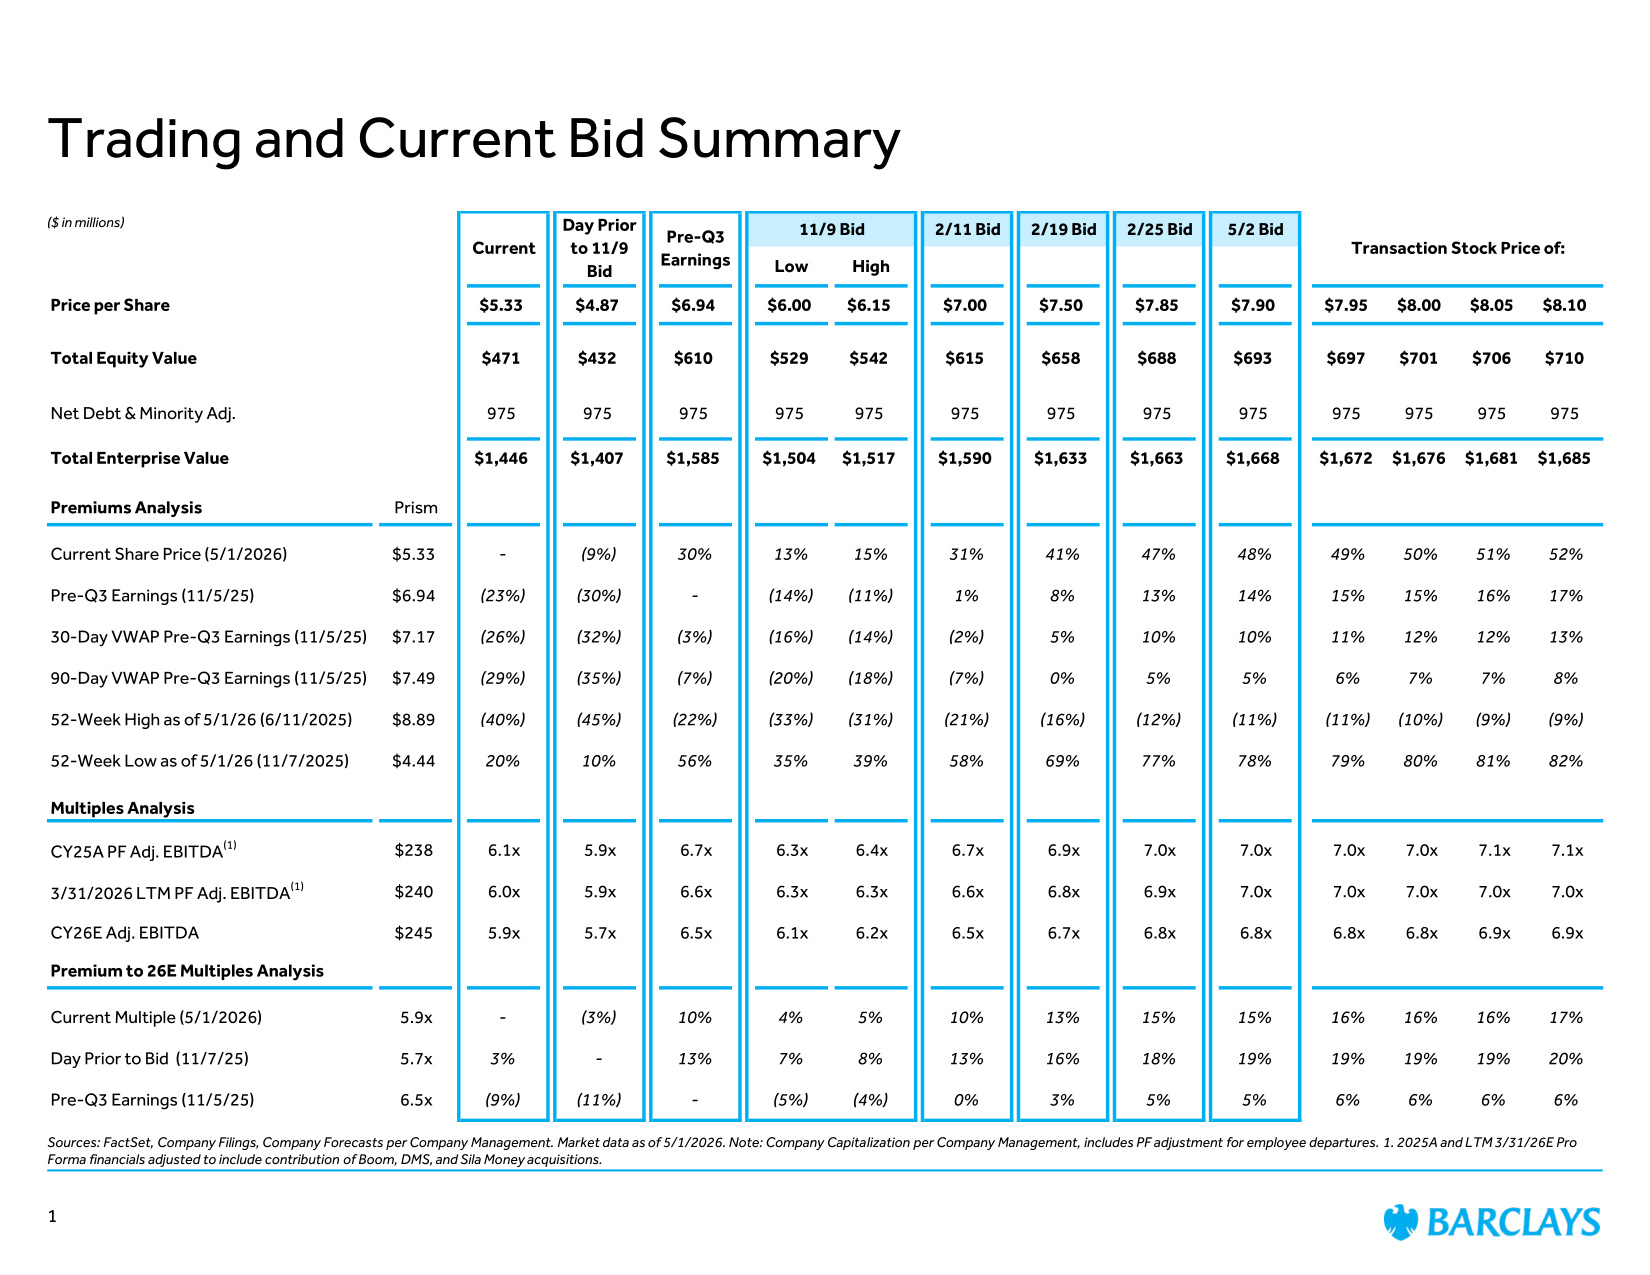
Trading and Current Bid Summary Sources: FactSet, Company Filings, Company Forecasts per Company Management. Market data as of 5/1/2026. Note: Company Capitalization per Company Management, includes PF adjustment for employee departures. 1. 2025A and LTM 3/31/26E Pro Forma financials adjusted to include contribution of Boom, DMS, and Sila Money acquisitions. 11/9 Bid 2/11 Bid 2/19 Bid 2/25 Bid 5/2 Bid Low High Price per Share $5.33 $4.87 $6.94 $6.00 $6.15 $7.00 $7.50 $7.85 $7.90 $7.95 $8.00 $8.05 $8.10 Total Equity Value $471 $432 $610 $529 $542 $615 $658 $688 $693 $697 $701 $706 $710 Net Debt & Minority Adj. 975 975 975 975 975 975 975 975 975 975 975 975 975 Total Enterprise Value $1,446 $1,407 $1,585 $1,504 $1,517 $1,590 $1,633 $1,663 $1,668 $1,672 $1,676 $1,681 $1,685 Premiums Analysis Prism Current Share Price (5/1/2026) $5.33 - (9%) 30% 13% 15% 31% 41% 47% 48% 49% 50% 51% 52% Pre-Q3 Earnings (11/5/25) $6.94 (23%) (30%) - (14%) (11%) 1% 8% 13% 14% 15% 15% 16% 17% 30-Day VWAP Pre-Q3 Earnings (11/5/25) $7.17 (26%) (32%) (3%) (16%) (14%) (2%) 5% 10% 10% 11% 12% 12% 13% 90-Day VWAP Pre-Q3 Earnings (11/5/25) $7.49 (29%) (35%) (7%) (20%) (18%) (7%) 0% 5% 5% 6% 7% 7% 8% 52-Week High as of 5/1/26 (6/11/2025) $8.89 (40%) (45%) (22%) (33%) (31%) (21%) (16%) (12%) (11%) (11%) (10%) (9%) (9%) 52-Week Low as of 5/1/26 (11/7/2025) $4.44 20% 10% 56% 35% 39% 58% 69% 77% 78% 79% 80% 81% 82% Multiples Analysis CY25A PF Adj. EBITDA(1) $238 6.1x 5.9x 6.7x 6.3x 6.4x 6.7x 6.9x 7.0x 7.0x 7.0x 7.0x 7.1x 7.1x 3/31/2026 LTM PF Adj. EBITDA(1) $240 6.0x 5.9x 6.6x 6.3x 6.3x 6.6x 6.8x 6.9x 7.0x 7.0x 7.0x 7.0x 7.0x CY26E Adj. EBITDA $245 5.9x 5.7x 6.5x 6.1x 6.2x 6.5x 6.7x 6.8x 6.8x 6.8x 6.8x 6.9x 6.9x Premium to 26E Multiples Analysis Current Multiple (5/1/2026) 5.9x - (3%) 10% 4% 5% 10% 13% 15% 15% 16% 16% 16% 17% Day Prior to Bid (11/7/25) 5.7x 3% - 13% 7% 8% 13% 16% 18% 19% 19% 19% 19% 20% Pre-Q3 Earnings (11/5/25) 6.5x (9%) (11%) - (5%) (4%) 0% 3% 5% 5% 6% 6% 6% 6% Transaction Stock Price of: Current Day Prior to 11/9 Bid Pre-Q3 Earnings ($ in millions) 1
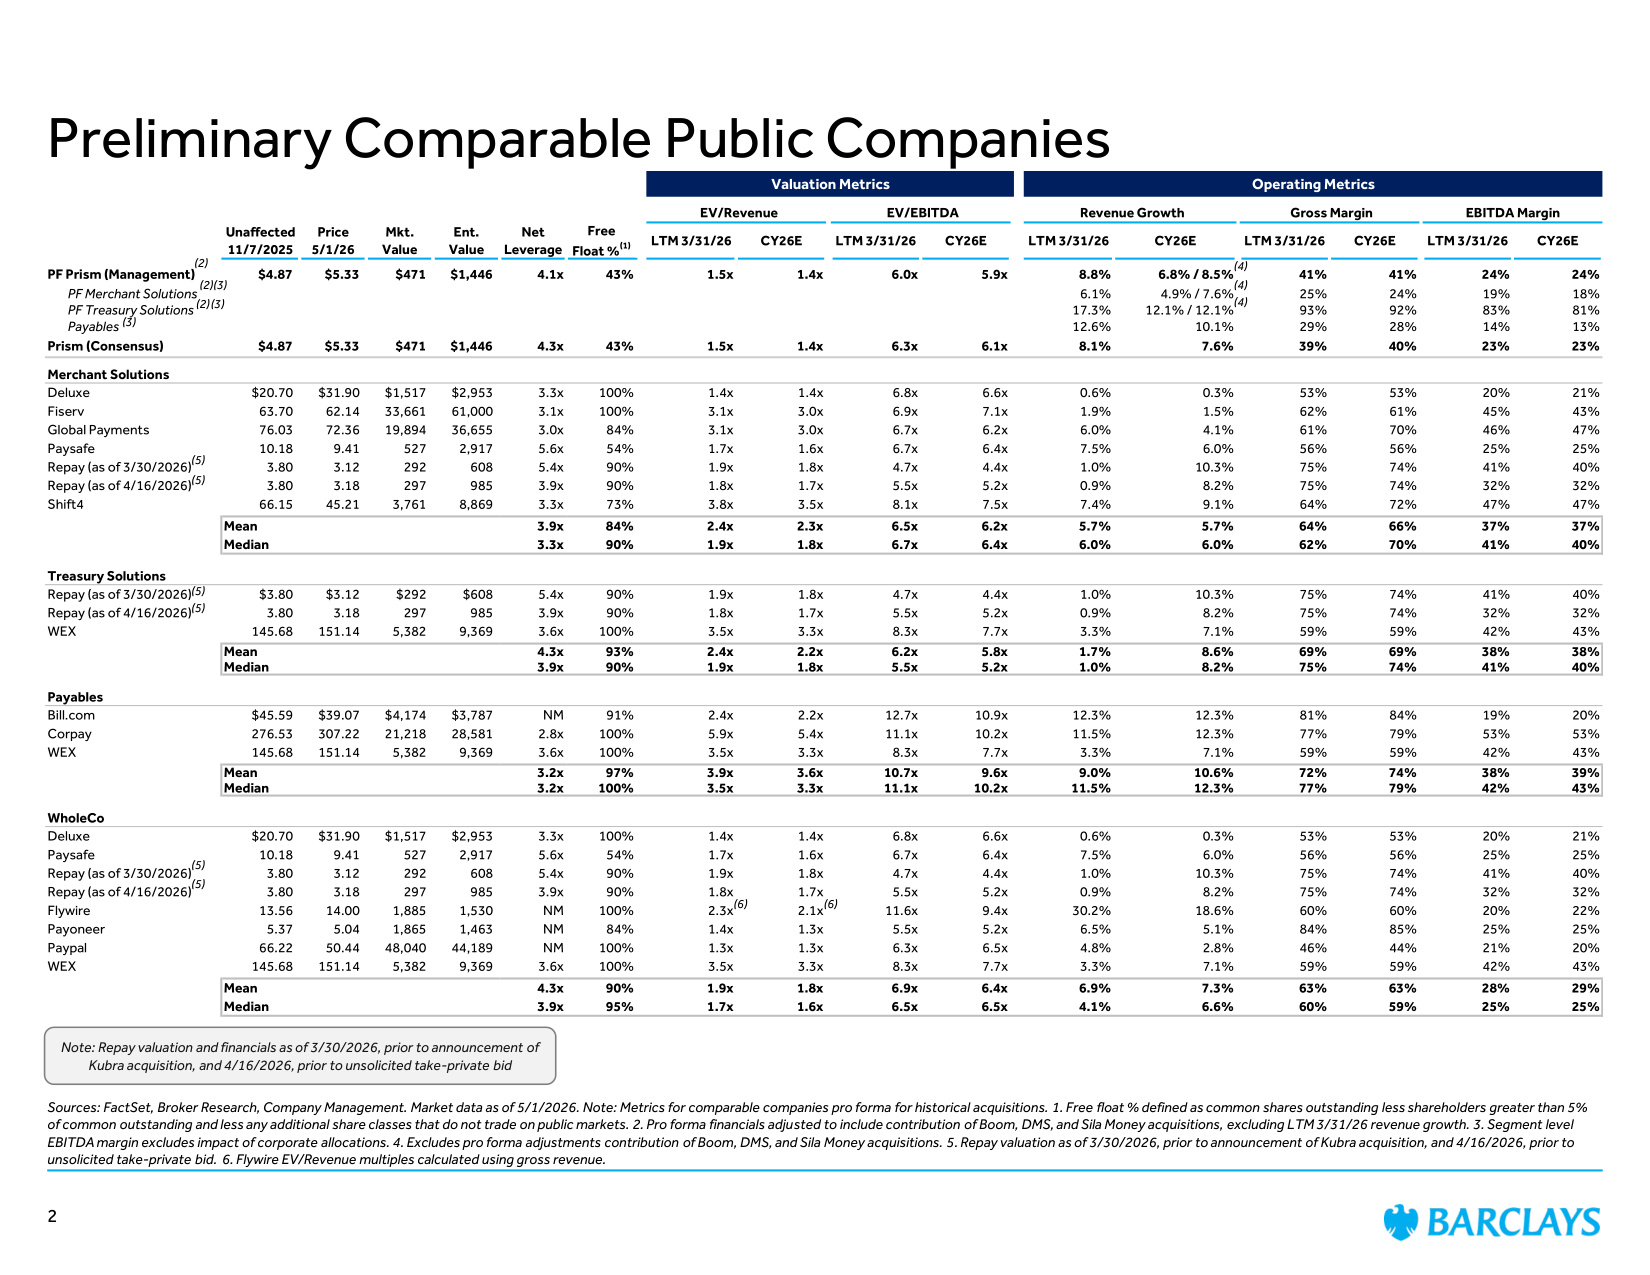
Valuation Metrics Operating Metrics EV/Revenue EV/EBITDA Revenue Growth Gross Margin EBITDA Margin Unaffected 11/7/2025 Price 5/1/26 Mkt. Value Ent. Value Net Leverage Free Float %(1) LTM 3/31/26 CY26E LTM 3/31/26 CY26E LTM 3/31/26 CY26E LTM 3/31/26 CY26E LTM 3/31/26 CY26E PF Prism (Management) $4.87 $5.33 $471 $1,446 4.1x 43% 1.5x 1.4x 6.0x 5.9x 8.8% 6.8% / 8.5% 41% 41% 24% 24% PF Merchant Solutions 6.1% 4.9% / 7.6% 25% 24% 19% 18% PF Treasury Solutions 17.3% 12.1% / 12.1% 93% 92% 83% 81% Payables 12.6% 10.1% 29% 28% 14% 13% Prism (Consensus) $4.87 $5.33 $471 $1,446 4.3x 43% 1.5x 1.4x 6.3x 6.1x 8.1% 7.6% 39% 40% 23% 23% Merchant Solutions Deluxe $20.70 $31.90 $1,517 $2,953 3.3x 100% 1.4x 1.4x 6.8x 6.6x 0.6% 0.3% 53% 53% 20% 21% Fiserv 63.70 62.14 33,661 61,000 3.1x 100% 3.1x 3.0x 6.9x 7.1x 1.9% 1.5% 62% 61% 45% 43% Global Payments 76.03 72.36 19,894 36,655 3.0x 84% 3.1x 3.0x 6.7x 6.2x 6.0% 4.1% 61% 70% 46% 47% Paysafe 10.18 9.41 527 2,917 5.6x 54% 1.7x 1.6x 6.7x 6.4x 7.5% 6.0% 56% 56% 25% 25% Repay (as of 3/30/2026) 3.80 3.12 292 608 5.4x 90% 1.9x 1.8x 4.7x 4.4x 1.0% 10.3% 75% 74% 41% 40% Repay (as of 4/16/2026) 3.80 3.18 297 985 3.9x 90% 1.8x 1.7x 5.5x 5.2x 0.9% 8.2% 75% 74% 32% 32% Shift4 66.15 45.21 3,761 8,869 3.3x 73% 3.8x 3.5x 8.1x 7.5x 7.4% 9.1% 64% 72% 47% 47% Mean 3.9x 84% 2.4x 2.3x 6.5x 6.2x 5.7% 5.7% 64% 66% 37% 37% Median 3.3x 90% 1.9x 1.8x 6.7x 6.4x 6.0% 6.0% 62% 70% 41% 40% Treasury Solutions Repay (as of 3/30/2026) $3.80 $3.12 $292 $608 5.4x 90% 1.9x 1.8x 4.7x 4.4x 1.0% 10.3% 75% 74% 41% 40% Repay (as of 4/16/2026) 3.80 3.18 297 985 3.9x 90% 1.8x 1.7x 5.5x 5.2x 0.9% 8.2% 75% 74% 32% 32% WEX 145.68 151.14 5,382 9,369 3.6x 100% 3.5x 3.3x 8.3x 7.7x 3.3% 7.1% 59% 59% 42% 43% Mean 4.3x 93% 2.4x 2.2x 6.2x 5.8x 1.7% 8.6% 69% 69% 38% 38% Median 3.9x 90% 1.9x 1.8x 5.5x 5.2x 1.0% 8.2% 75% 74% 41% 40% Payables Bill.com $45.59 $39.07 $4,174 $3,787 NM 91% 2.4x 2.2x 12.7x 10.9x 12.3% 12.3% 81% 84% 19% 20% Corpay 276.53 307.22 21,218 28,581 2.8x 100% 5.9x 5.4x 11.1x 10.2x 11.5% 12.3% 77% 79% 53% 53% WEX 145.68 151.14 5,382 9,369 3.6x 100% 3.5x 3.3x 8.3x 7.7x 3.3% 7.1% 59% 59% 42% 43% Mean 3.2x 97% 3.9x 3.6x 10.7x 9.6x 9.0% 10.6% 72% 74% 38% 39% Median 3.2x 100% 3.5x 3.3x 11.1x 10.2x 11.5% 12.3% 77% 79% 42% 43% WholeCo Deluxe $20.70 $31.90 $1,517 $2,953 3.3x 100% 1.4x 1.4x 6.8x 6.6x 0.6% 0.3% 53% 53% 20% 21% Paysafe 10.18 9.41 527 2,917 5.6x 54% 1.7x 1.6x 6.7x 6.4x 7.5% 6.0% 56% 56% 25% 25% Repay (as of 3/30/2026) 3.80 3.12 292 608 5.4x 90% 1.9x 1.8x 4.7x 4.4x 1.0% 10.3% 75% 74% 41% 40% Repay (as of 4/16/2026) 3.80 3.18 297 985 3.9x 90% 1.8x 1.7x 5.5x 5.2x 0.9% 8.2% 75% 74% 32% 32% Flywire 13.56 14.00 1,885 1,530 NM 100% 2.3x 2.1x 11.6x 9.4x 30.2% 18.6% 60% 60% 20% 22% Payoneer 5.37 5.04 1,865 1,463 NM 84% 1.4x 1.3x 5.5x 5.2x 6.5% 5.1% 84% 85% 25% 25% Paypal 66.22 50.44 48,040 44,189 NM 100% 1.3x 1.3x 6.3x 6.5x 4.8% 2.8% 46% 44% 21% 20% WEX 145.68 151.14 5,382 9,369 3.6x 100% 3.5x 3.3x 8.3x 7.7x 3.3% 7.1% 59% 59% 42% 43% Mean 4.3x 90% 1.9x 1.8x 6.9x 6.4x 6.9% 7.3% 63% 63% 28% 29% Median 3.9x 95% 1.7x 1.6x 6.5x 6.5x 4.1% 6.6% 60% 59% 25% 25% Preliminary Comparable Public Companies Sources: FactSet, Broker Research, Company Management. Market data as of 5/1/2026. Note: Metrics for comparable companies pro forma for historical acquisitions. 1. Free float % defined as common shares outstanding less shareholders greater than 5% of common outstanding and less any additional share classes that do not trade on public markets. 2. Pro forma financials adjusted to include contribution of Boom, DMS, and Sila Money acquisitions, excluding LTM 3/31/26 revenue growth. 3. Segment level EBITDA margin excludes impact of corporate allocations. 4. Excludes pro forma adjustments contribution of Boom, DMS, and Sila Money acquisitions. 5. Repay valuation as of 3/30/2026, prior to announcement of Kubra acquisition, and 4/16/2026, prior to unsolicited take-private bid. 6. Flywire EV/Revenue multiples calculated using gross revenue. (6) (2) (2) (2) (3) (3) (3) (4) (4) (4) 2 (6) (5) (5) (5) Note: Repay valuation and financials as of 3/30/2026, prior to announcement of Kubra acquisition, and 4/16/2026, prior to unsolicited take-private bid (5) (5) (5)
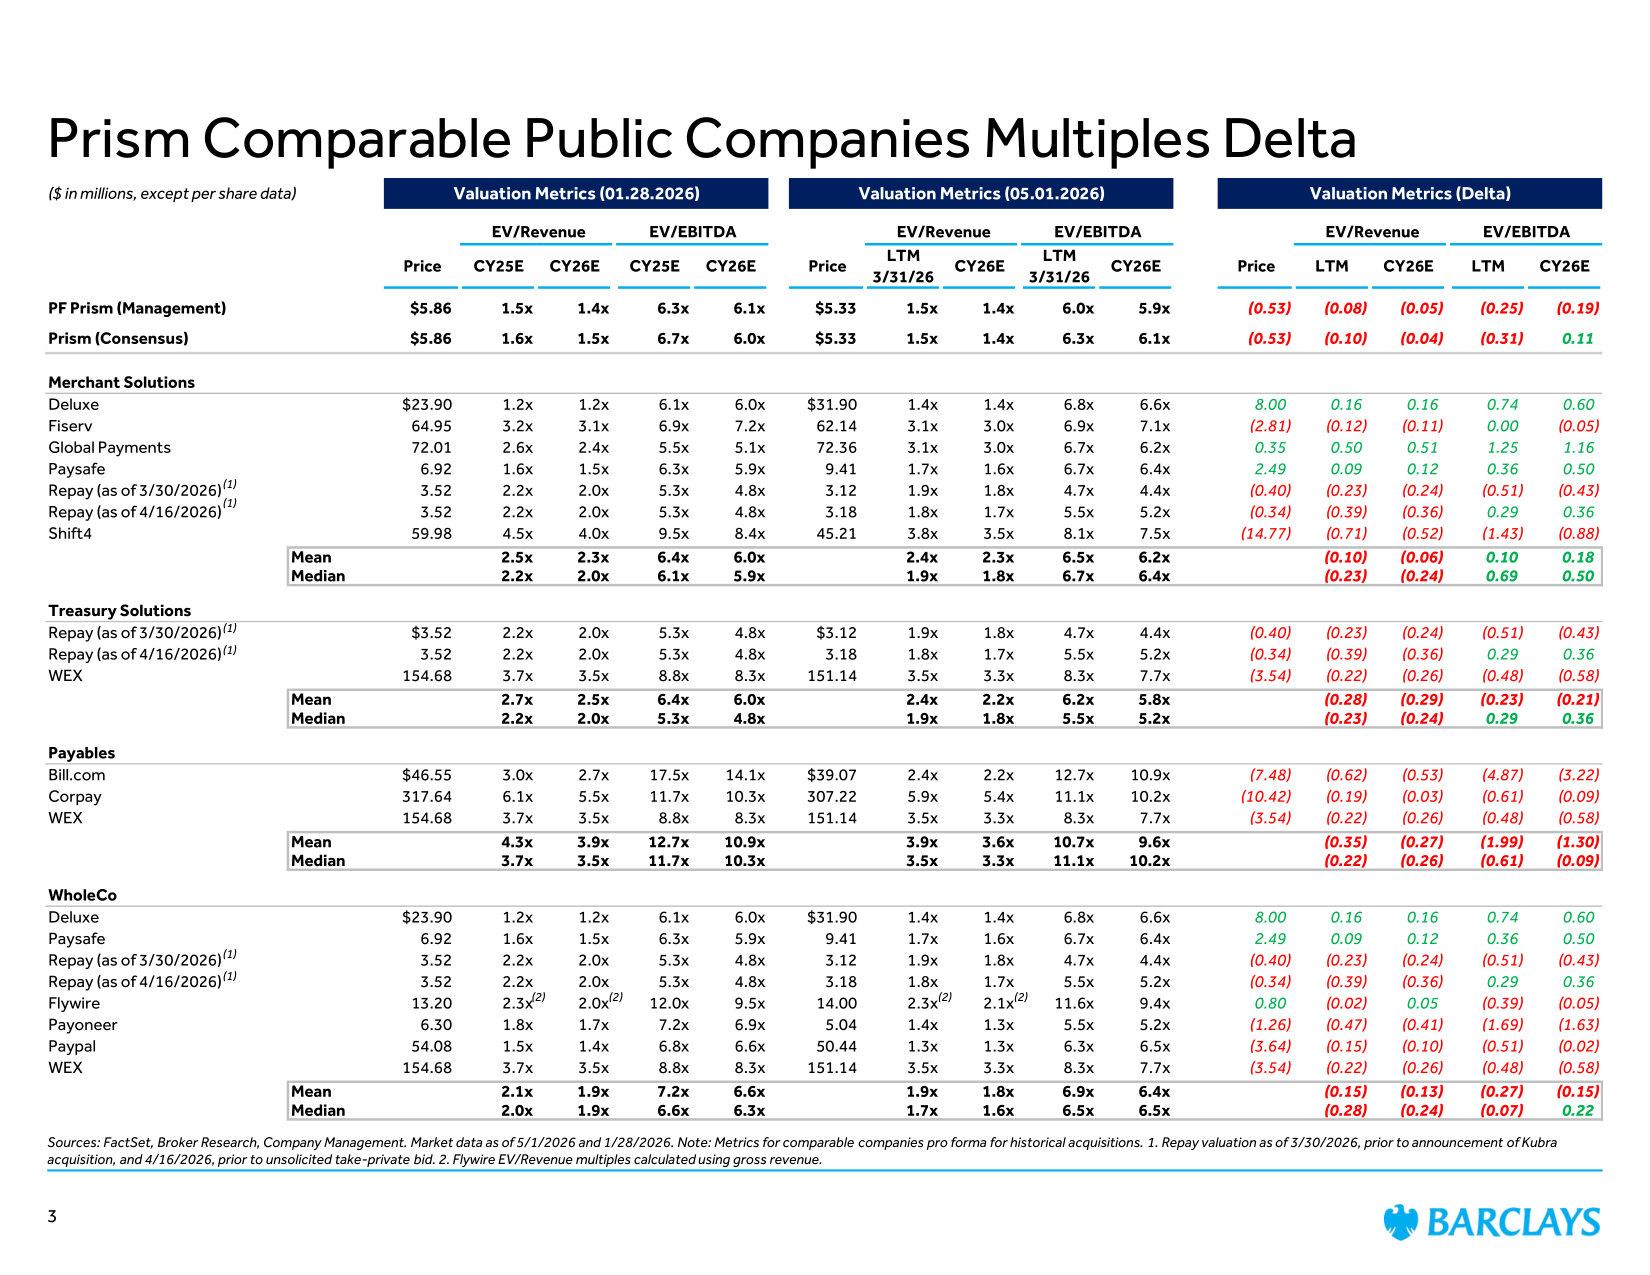
($ in millions, except per share data) Valuation Metrics (01.28.2026) Valuation Metrics (05.01.2026) Valuation Metrics (Delta) EV/Revenue EV/EBITDA EV/Revenue EV/EBITDA EV/Revenue EV/EBITDA Price CY25E CY26E CY25E CY26E Price LTM 3/31/26 CY26E LTM 3/31/26 CY26E Price LTM CY26E LTM CY26E PF Prism (Management) $5.86 1.5x 1.4x 6.3x 6.1x $5.33 1.5x 1.4x 6.0x 5.9x (0.53) (0.08) (0.05) (0.25) (0.19) Prism (Consensus) $5.86 1.6x 1.5x 6.7x 6.0x $5.33 1.5x 1.4x 6.3x 6.1x (0.53) (0.10) (0.04) (0.31) 0.11 Merchant Solutions Deluxe $23.90 1.2x 1.2x 6.1x 6.0x $31.90 1.4x 1.4x 6.8x 6.6x 8.00 0.16 0.16 0.74 0.60 Fiserv 64.95 3.2x 3.1x 6.9x 7.2x 62.14 3.1x 3.0x 6.9x 7.1x (2.81) (0.12) (0.11) 0.00 (0.05) Global Payments 72.01 2.6x 2.4x 5.5x 5.1x 72.36 3.1x 3.0x 6.7x 6.2x 0.35 0.50 0.51 1.25 1.16 Paysafe 6.92 1.6x 1.5x 6.3x 5.9x 9.41 1.7x 1.6x 6.7x 6.4x 2.49 0.09 0.12 0.36 0.50 Repay (as of 3/30/2026) 3.52 2.2x 2.0x 5.3x 4.8x 3.12 1.9x 1.8x 4.7x 4.4x (0.40) (0.23) (0.24) (0.51) (0.43) Repay (as of 4/16/2026) 3.52 2.2x 2.0x 5.3x 4.8x 3.18 1.8x 1.7x 5.5x 5.2x (0.34) (0.39) (0.36) 0.29 0.36 Shift4 59.98 4.5x 4.0x 9.5x 8.4x 45.21 3.8x 3.5x 8.1x 7.5x (14.77) (0.71) (0.52) (1.43) (0.88) Mean 2.5x 2.3x 6.4x 6.0x 2.4x 2.3x 6.5x 6.2x (0.10) (0.06) 0.10 0.18 Median 2.2x 2.0x 6.1x 5.9x 1.9x 1.8x 6.7x 6.4x (0.23) (0.24) 0.69 0.50 Treasury Solutions Repay (as of 3/30/2026) $3.52 2.2x 2.0x 5.3x 4.8x $3.12 1.9x 1.8x 4.7x 4.4x (0.40) (0.23) (0.24) (0.51) (0.43) Repay (as of 4/16/2026) 3.52 2.2x 2.0x 5.3x 4.8x 3.18 1.8x 1.7x 5.5x 5.2x (0.34) (0.39) (0.36) 0.29 0.36 WEX 154.68 3.7x 3.5x 8.8x 8.3x 151.14 3.5x 3.3x 8.3x 7.7x (3.54) (0.22) (0.26) (0.48) (0.58) Mean 2.7x 2.5x 6.4x 6.0x 2.4x 2.2x 6.2x 5.8x (0.28) (0.29) (0.23) (0.21) Median 2.2x 2.0x 5.3x 4.8x 1.9x 1.8x 5.5x 5.2x (0.23) (0.24) 0.29 0.36 Payables Bill.com $46.55 3.0x 2.7x 17.5x 14.1x $39.07 2.4x 2.2x 12.7x 10.9x (7.48) (0.62) (0.53) (4.87) (3.22) Corpay 317.64 6.1x 5.5x 11.7x 10.3x 307.22 5.9x 5.4x 11.1x 10.2x (10.42) (0.19) (0.03) (0.61) (0.09) WEX 154.68 3.7x 3.5x 8.8x 8.3x 151.14 3.5x 3.3x 8.3x 7.7x (3.54) (0.22) (0.26) (0.48) (0.58) Mean 4.3x 3.9x 12.7x 10.9x 3.9x 3.6x 10.7x 9.6x (0.35) (0.27) (1.99) (1.30) Median 3.7x 3.5x 11.7x 10.3x 3.5x 3.3x 11.1x 10.2x (0.22) (0.26) (0.61) (0.09) WholeCo Deluxe $23.90 1.2x 1.2x 6.1x 6.0x $31.90 1.4x 1.4x 6.8x 6.6x 8.00 0.16 0.16 0.74 0.60 Paysafe 6.92 1.6x 1.5x 6.3x 5.9x 9.41 1.7x 1.6x 6.7x 6.4x 2.49 0.09 0.12 0.36 0.50 Repay (as of 3/30/2026) 3.52 2.2x 2.0x 5.3x 4.8x 3.12 1.9x 1.8x 4.7x 4.4x (0.40) (0.23) (0.24) (0.51) (0.43) Repay (as of 4/16/2026) 3.52 2.2x 2.0x 5.3x 4.8x 3.18 1.8x 1.7x 5.5x 5.2x (0.34) (0.39) (0.36) 0.29 0.36 Flywire 13.20 2.3x 2.0x 12.0x 9.5x 14.00 2.3x 2.1x 11.6x 9.4x 0.80 (0.02) 0.05 (0.39) (0.05) Payoneer 6.30 1.8x 1.7x 7.2x 6.9x 5.04 1.4x 1.3x 5.5x 5.2x (1.26) (0.47) (0.41) (1.69) (1.63) Paypal 54.08 1.5x 1.4x 6.8x 6.6x 50.44 1.3x 1.3x 6.3x 6.5x (3.64) (0.15) (0.10) (0.51) (0.02) WEX 154.68 3.7x 3.5x 8.8x 8.3x 151.14 3.5x 3.3x 8.3x 7.7x (3.54) (0.22) (0.26) (0.48) (0.58) Mean 2.1x 1.9x 7.2x 6.6x 1.9x 1.8x 6.9x 6.4x (0.15) (0.13) (0.27) (0.15) Median 2.0x 1.9x 6.6x 6.3x 1.7x 1.6x 6.5x 6.5x (0.28) (0.24) (0.07) 0.22 Prism Comparable Public Companies Multiples Delta Sources: FactSet, Broker Research, Company Management. Market data as of 5/1/2026 and 1/28/2026. Note: Metrics for comparable companies pro forma for historical acquisitions. 1. Repay valuation as of 3/30/2026, prior to announcement of Kubra acquisition, and 4/16/2026, prior to unsolicited take-private bid. 2. Flywire EV/Revenue multiples calculated using gross revenue. (2) (2) (2) (2) 3 (1) (1) (1) (1) (1) (1)
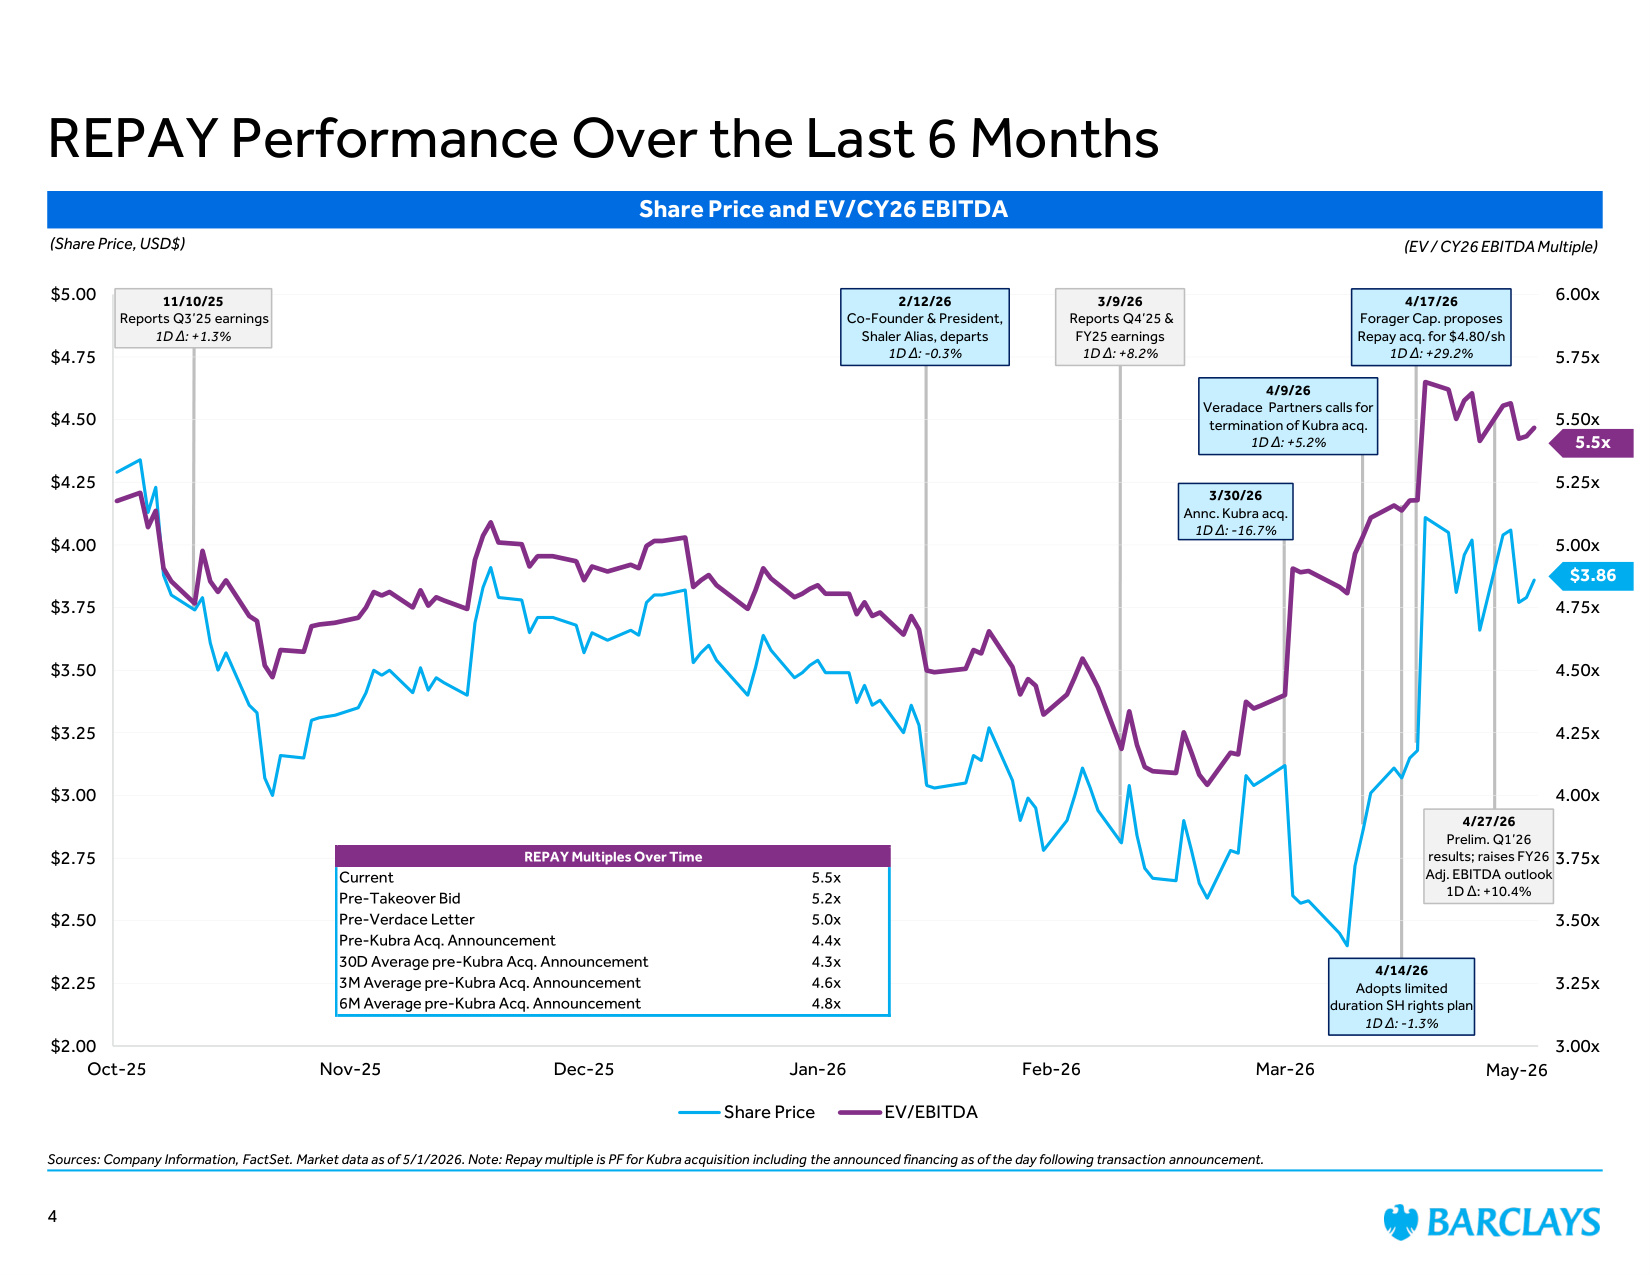
Sources: Company Information, FactSet. Market data as of 5/1/2026. Note: Repay multiple is PF for Kubra acquisition including the announced financing as of the day following transaction announcement. REPAY Performance Over the Last 6 Months Share Price and EV/CY26 EBITDA (Share Price, USD$) 4 (EV / CY26 EBITDA Multiple) 3.00x 3.25x 3.50x 3.75x 4.00x 4.25x 4.50x 4.75x 5.00x 5.25x 5.50x 5.75x 6.00x $2.00 $2.25 $2.50 $2.75 $3.00 $3.25 $3.50 $3.75 $4.00 $4.25 $4.50 $4.75 $5.00 Oct-25 Nov-25 Dec-25 Jan-26 Feb-26 Mar-26 Apr-26 Share Price EV/EBITDA REPAY Multiples Over Time Current 5.5x Pre-Takeover Bid 5.2x Pre-Verdace Letter 5.0x Pre-Kubra Acq. Announcement 4.4x 30D Average pre-Kubra Acq. Announcement 4.3x 3M Average pre-Kubra Acq. Announcement 4.6x 6M Average pre-Kubra Acq. Announcement 4.8x $3.86 5.5x 4/27/26 Prelim. Q1'26 results; raises FY26 Adj. EBITDA outlook 1D Δ: +10.4% 2/12/26 Co-Founder & President, Shaler Alias, departs 1D Δ: -0.3% 3/9/26 Reports Q4'25 & FY25 earnings 1D Δ: +8.2% 3/30/26 Annc. Kubra acq. 1D Δ: -16.7% 4/9/26 Veradace Partners calls for termination of Kubra acq. 1D Δ: +5.2% 4/17/26 Forager Cap. proposes Repay acq. for $4.80/sh 1D Δ: +29.2% 11/10/25 Reports Q3'25 earnings 1D Δ: +1.3% 4/14/26 Adopts limited duration SH rights plan 1D Δ: -1.3% May-26
The following pages contain material that was provided to the Board of Directors (the "Board") of Prism (the "Company") by Barclays Capital Inc. ("Barclays"). The accompanying material and any Barclays presentation related to the material was compiled or prepared on a confidential basis solely for consideration by the Board and no part of it may be reproduced, distributed or transmitted without the prior written consent of Barclays. The information contained in this material was obtained from the Company and/or publicly available sources, and Barclays has relied upon such information without independent verification thereof and does not assume any liability for any such information. These materials are being provided in connection with an actual corporate engagement and may not be used or relied upon for any purpose other than as specifically contemplated by a written agreement with Barclays. Moreover, any information provided herein was not prepared for or intended for use by any individual for personal, family or household purposes. Any estimates, historical financial information, projections and other information contained herein have been prepared by management of the Company or were obtained from publicly available sources (approved for Barclays' use by the Company) or are based upon such estimates and projections. With respect to such estimates and projections, Barclays has assumed that they have been reasonably prepared on a basis reflecting the best currently available estimates, projections and judgment of the management of the Company. The projections contained herein may or may not be achieved and differences between projected results and those actually achieved may be material. No representation or warranty, expressed or implied, is made as to the accuracy or completeness of such information and nothing contained herein is, or shall be relied upon as, a promise or representation, whether as to the past or the future. The analysis contained herein is based on current market conditions which are subject to change and Barclays assumes no obligation to update or otherwise revise these materials. Nothing in these materials shall be deemed to constitute a recommendation or investment, legal, tax, financial, accounting or other advice. Because these materials were prepared for use in the context of a presentation to the Board, these materials are incomplete without reference to, and should be assessed solely in conjunction with, the oral briefing provided by Barclays to the Board (in their capacity as directors and not in any individual capacity and is not for the benefit of any individual, including any individual officer, director, shareholder or any other person). These materials were not prepared for or intended for use by any individual for personal, family or household purposes nor were they prepared to comply with the disclosure standards under state and federal securities laws or any other applicable laws and, to the extent the material may be considered by readers not as familiar with the business and affairs of the Company as the Board, none of the Company, Barclays, their respective affiliates or any of their respective legal or financial advisors or accountants takes any responsibility for the accuracy or completeness of any of the material if used by persons other than the Board. These materials are not intended to provide the sole basis for evaluation of the proposed corporate transaction and do not purport to contain all information that may be required and should not be considered a recommendation with respect to the proposed corporate transaction. Barclays has not made or obtained any evaluations or appraisals of the assets or liabilities of the Company or any other party to any corporate transaction or any of their respective affiliates and has no obligation to evaluate the solvency of the Company or any other party to any transaction under any state or federal laws relating to bankruptcy, insolvency or similar matters. The analyses contained herein do not purport to be appraisals nor do they necessarily reflect the prices at which businesses or securities actually may be sold or purchased. Barclays' role in any due diligence review is limited solely to performing such a review as it shall deem necessary to support its own advice and analysis and shall not be on behalf of the Company, the Board or any individual officer, director, shareholder or any other person. Barclays, its subsidiaries and affiliates engage in a wide range of businesses from investment and commercial banking, lending, asset management and other financial and non-financial services. In the ordinary course of its business, Barclays and its affiliates may actively trade and effect transactions in the equity, debt and/or other securities (and any derivatives thereof) and financial instruments (including loans and other obligations) of the Company for its own account and for the accounts of its customers and, accordingly, may at any time hold long or short positions and investments in such securities and financial instruments or in other financial products and instruments. Unless otherwise expressly agreed or provided for in other applicable Barclays disclosures governing such corporate transactions or required by law or regulation, Barclays conducts these activities as principal and executes its principal transactions as an arm's length counterparty. Barclays does not act as a fiduciary in relation to these corporate transactions. These materials do not constitute investment advice nor do they form part of an offer to sell or purchase, or the solicitation of an offer to sell or purchase, any securities or any of the businesses or assets described herein or an offer of financing or an offer or recommendation to enter into any corporate transaction described herein. Barclays Capital Inc. is the United States investment bank of Barclays Bank PLC. Barclays Bank PLC is authorised by the Prudential Regulation Authority and regulated by the Financial Conduct Authority and the Prudential Regulation Authority (Financial Services Register No. 122702). Registered in England. Registered No. 1026167. Registered office: 1 Churchill Place, London E14 5HP. Neither Barclays Bank PLC, New York Branch nor Barclays Bank Delaware is responsible for the obligations of its affiliates. Copyright Barclays Bank PLC, 2026 (all rights reserved). Disclaimer 5
Exhibit (C)(8)

Project Prism: Discussion Materials July 2026
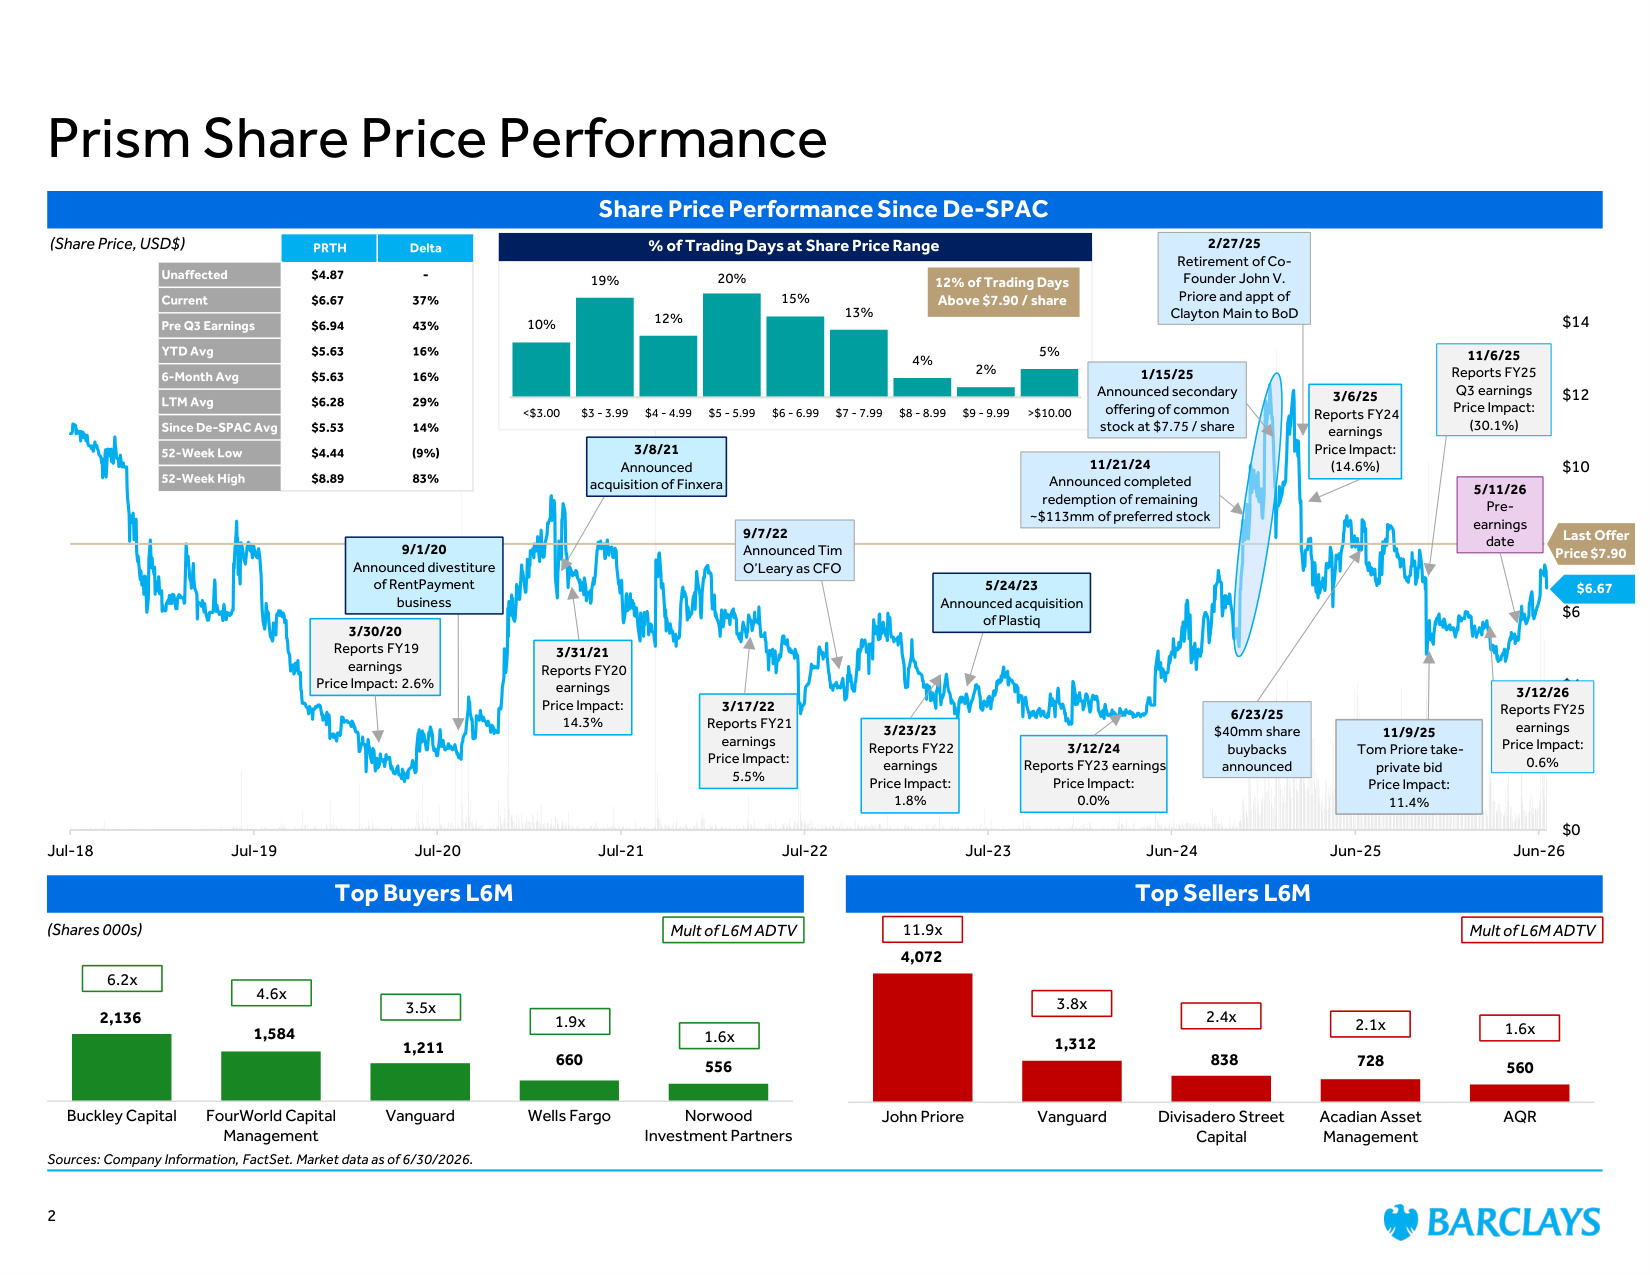
2,136 1,584 1,211 660 556 Buckley Capital FourWorld Capital Management Vanguard Wells Fargo Norwood Investment Partners 4,072 1,312 838 728 560 John Priore Vanguard Divisadero Street Capital Acadian Asset Management AQR Jul-18 Jul-19 Jul-20 Jul-21 Jul-22 Jul-23 Jun-24 Jun-25 Jun-26 $0 $2 $4 $6 $8 $10 $12 $14 Sources: Company Information, FactSet. Market data as of 6/30/2026. Prism Share Price Performance Share Price Performance Since De-SPAC (Share Price, USD$) 2 6/23/25 $40mm share buybacks announced 3/17/22 Reports FY21 earnings Price Impact: 5.5% $6.67 3/23/23 Reports FY22 earnings Price Impact: 1.8% 3/12/24 Reports FY23 earnings Price Impact: 0.0% 2/27/25 Retirement of Co- Founder John V. Priore and appt of Clayton Main to BoD Last Offer Price $7.90 9/7/22 Announced Tim O'Leary as CFO 5/24/23 Announced acquisition of Plastiq 3/31/21 Reports FY20 earnings Price Impact: 14.3% 3/30/20 Reports FY19 earnings Price Impact: 2.6% 9/1/20 Announced divestiture of RentPayment business 10% 19% 12% 20% 15% 13% 4% 2% 5% <$3.00 $3 - 3.99 $4 - 4.99 $5 - 5.99 $6 - 6.99 $7 - 7.99 $8 - 8.99 $9 - 9.99 >$10.00 % of Trading Days at Share Price Range 3/6/25 Reports FY24 earnings Price Impact: (14.6%) PRTH Delta Unaffected $4.87 - Current $6.67 37% Pre Q3 Earnings $6.94 43% YTD Avg $5.63 16% 6-Month Avg $5.63 16% LTM Avg $6.28 29% Since De-SPAC Avg $5.53 14% 52-Week Low $4.44 (9%) 52-Week High $8.89 83% 11/6/25 Reports FY25 Q3 earnings Price Impact: (30.1%) 11/9/25 Tom Priore take- private bid Price Impact: 11.4% 3/12/26 Reports FY25 earnings Price Impact: 0.6% 3/8/21 Announced acquisition of Finxera 1/15/25 Announced secondary offering of common stock at $7.75 / share 11/21/24 Announced completed redemption of remaining ~$113mm of preferred stock 12% of Trading Days Above $7.90 / share Top Buyers L6M Top Sellers L6M 5/11/26 Pre- earnings date (Shares 000s) 6.2x 4.6x 3.5x 1.9x 1.6x Mult of L6M ADTV 11.9x 3.8x 2.4x 2.1x 1.6x Mult of L6M ADTV
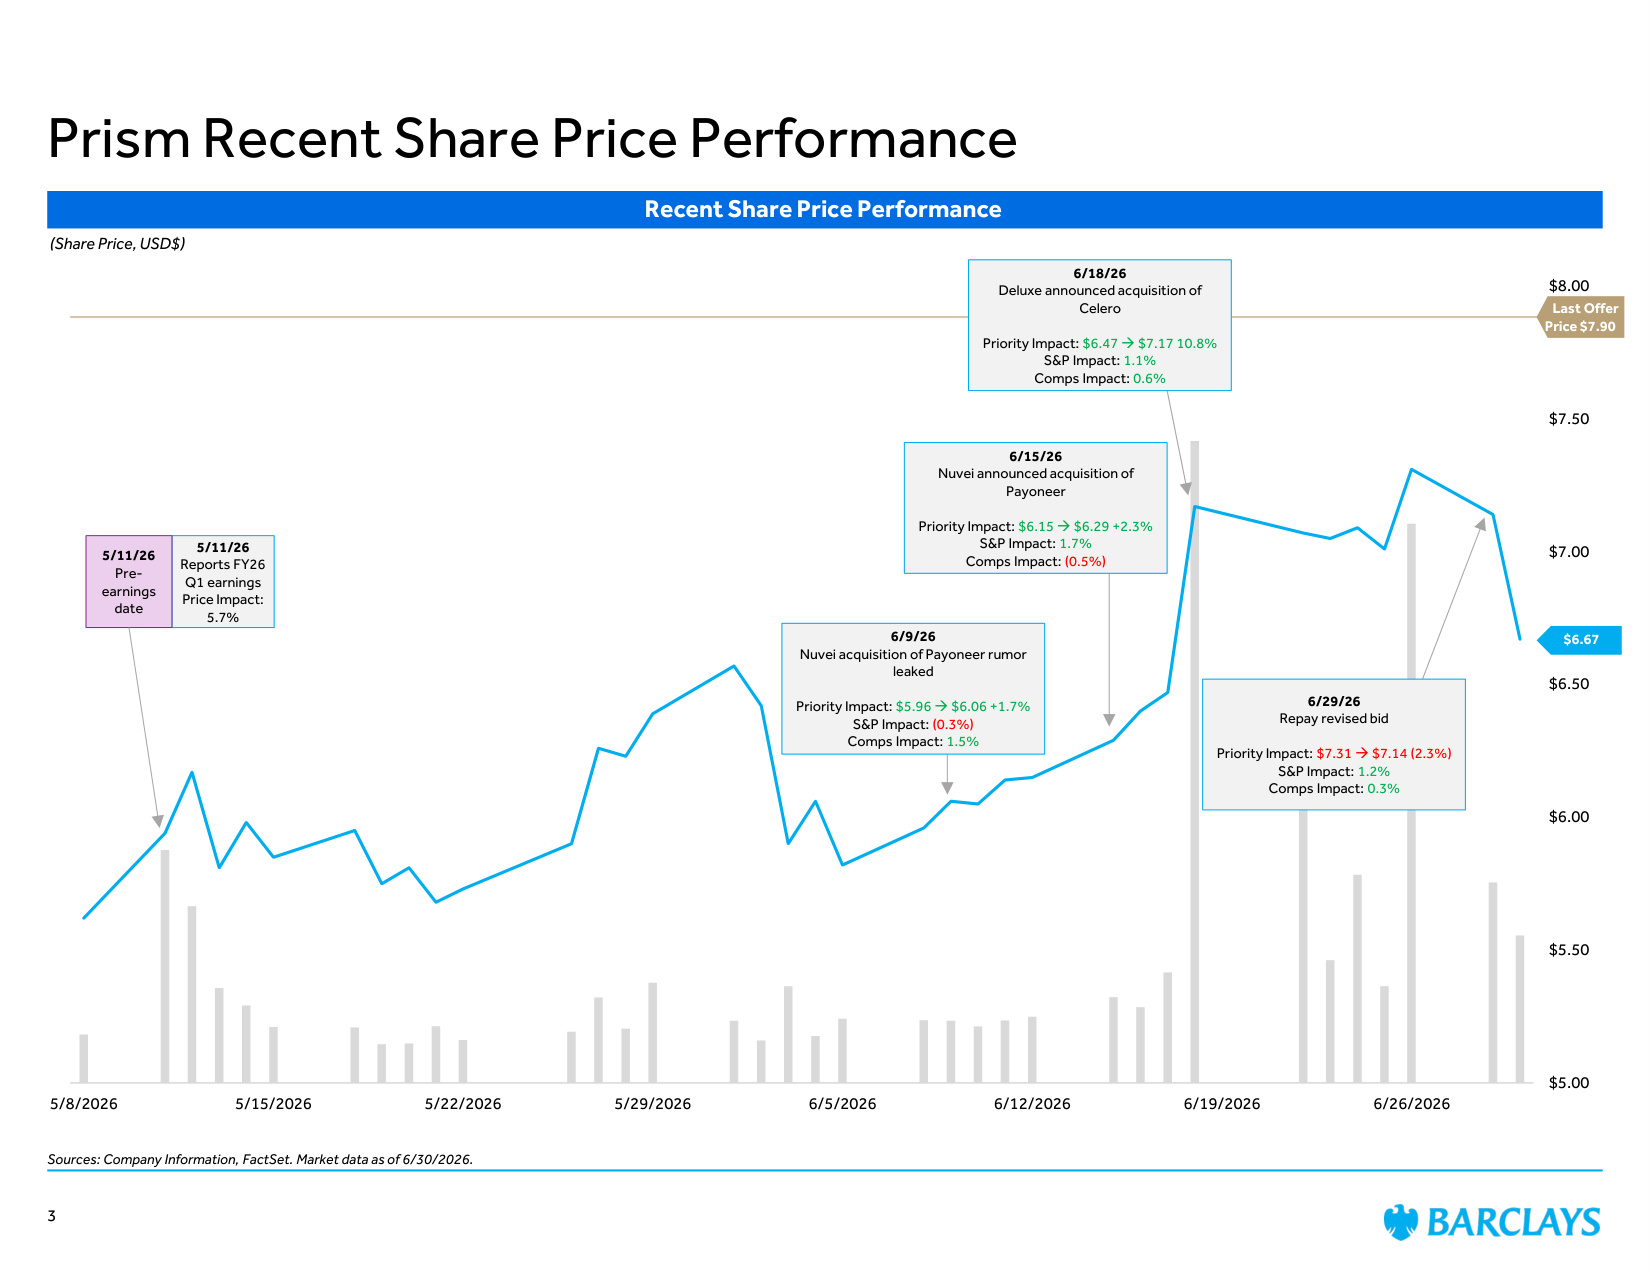
5/8/2026 5/15/2026 5/22/2026 5/29/2026 6/5/2026 6/12/2026 6/19/2026 6/26/2026 $5.00 $5.50 $6.00 $6.50 $7.00 $7.50 $8.00 Sources: Company Information, FactSet. Market data as of 6/30/2026. Prism Recent Share Price Performance Recent Share Price Performance (Share Price, USD$) $6.67 Last Offer Price $7.90 5/11/26 Reports FY26 Q1 earnings Price Impact: 5.7% 5/11/26 Pre- earnings date 3 6/18/26 Deluxe announced acquisition of Celero Priority Impact: $6.47 → $7.17 10.8% S&P Impact: 1.1% Comps Impact: 0.6% 6/15/26 Nuvei announced acquisition of Payoneer Priority Impact: $6.15 → $6.29 +2.3% S&P Impact: 1.7% Comps Impact: (0.5%) 6/9/26 Nuvei acquisition of Payoneer rumor leaked Priority Impact: $5.96 → $6.06 +1.7% S&P Impact: (0.3%) Comps Impact: 1.5% 6/29/26 Repay revised bid Priority Impact: $7.31 → $7.14 (2.3%) S&P Impact: 1.2% Comps Impact: 0.3%
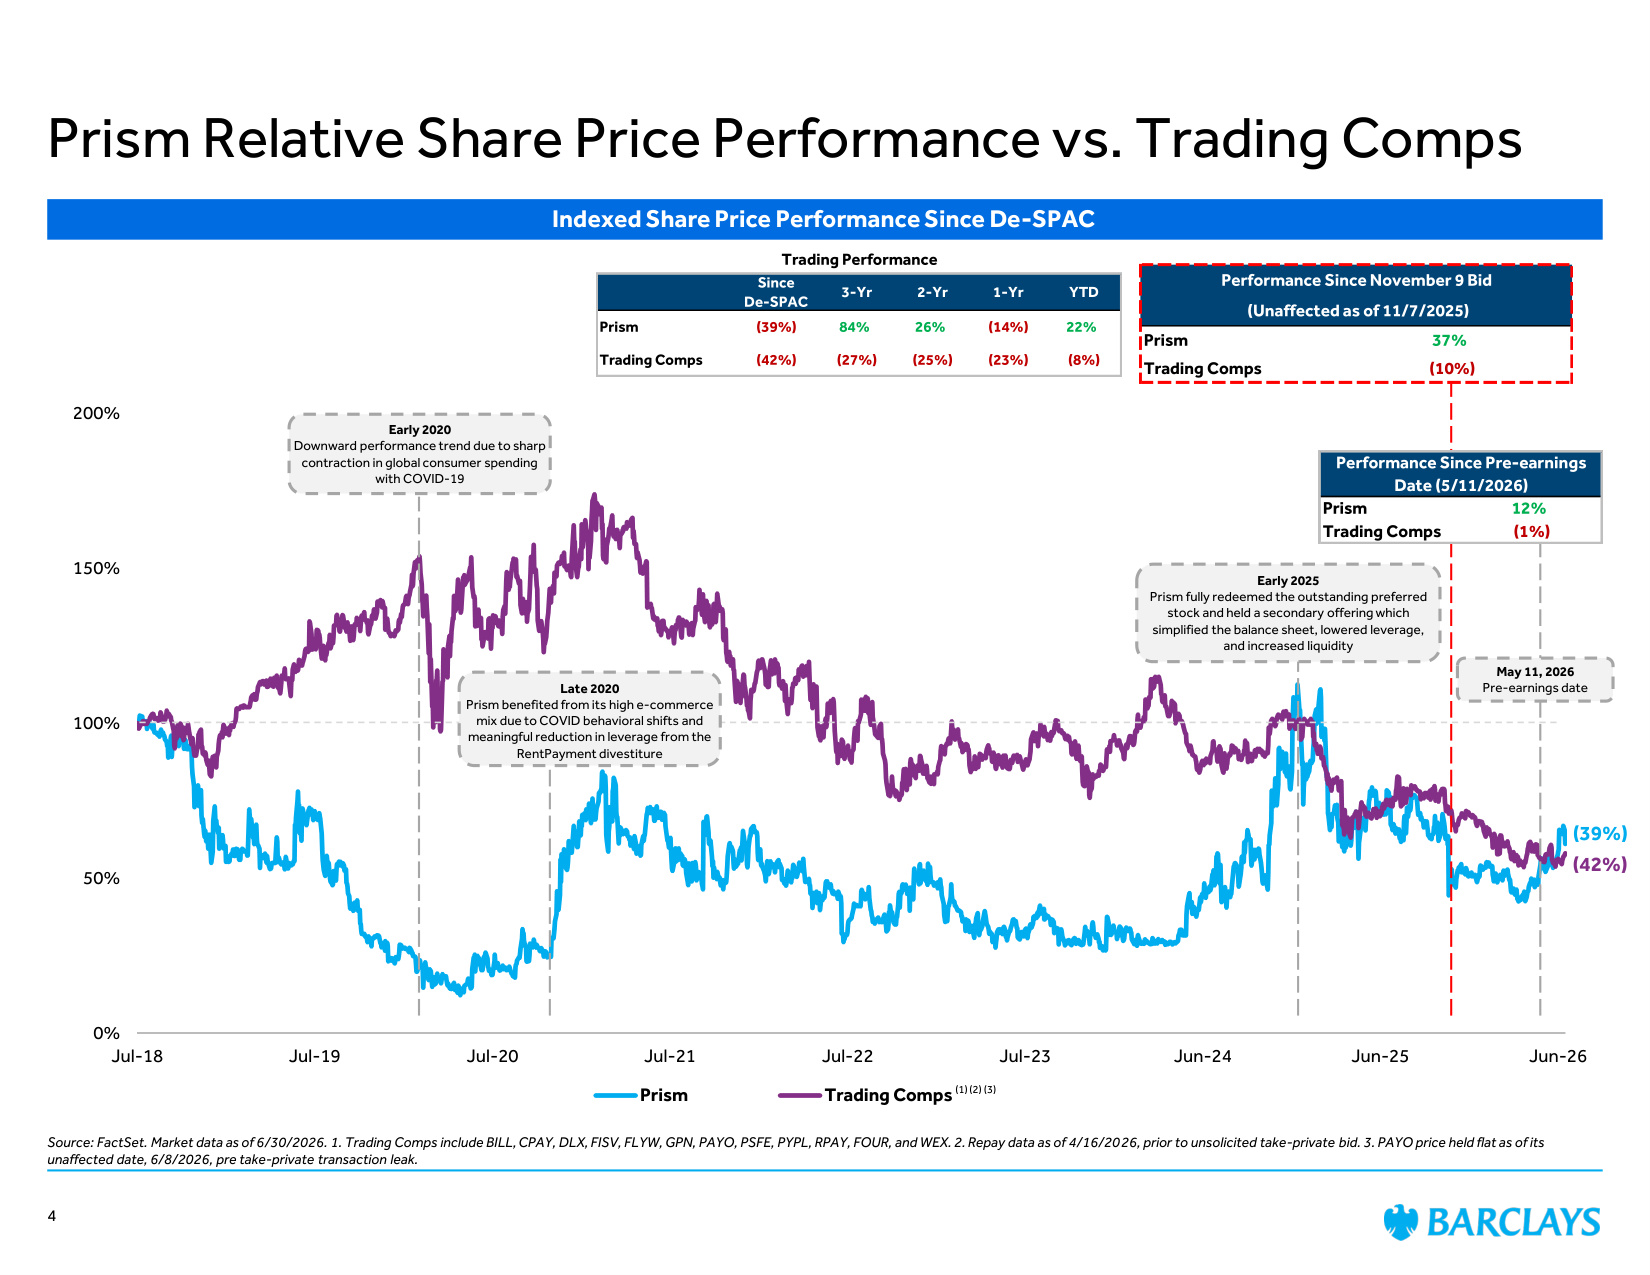
0% 50% 100% 150% 200% Jul-18 Jul-19 Jul-20 Jul-21 Jul-22 Jul-23 Jun-24 Jun-25 Jun-26 Prism Trading Comps Indexed Share Price Performance Since De-SPAC (42%) (39%) (1) Performance Since November 9 Bid (Unaffected as of 11/7/2025) Prism 37% Trading Comps (10%) Trading Performance Since De-SPAC 3-Yr 2-Yr 1-Yr YTD Prism (39%) 84% 26% (14%) 22% Trading Comps (42%) (27%) (25%) (23%) (8%) Prism Relative Share Price Performance vs. Trading Comps Source: FactSet. Market data as of 6/30/2026. 1. Trading Comps include BILL, CPAY, DLX, FISV, FLYW, GPN, PAYO, PSFE, PYPL, RPAY, FOUR, and WEX. 2. Repay data as of 4/16/2026, prior to unsolicited take-private bid. 3. PAYO price held flat as of its unaffected date, 6/8/2026, pre take-private transaction leak. Early 2020 Downward performance trend due to sharp contraction in global consumer spending with COVID-19 Early 2025 Prism fully redeemed the outstanding preferred stock and held a secondary offering which simplified the balance sheet, lowered leverage, and increased liquidity Late 2020 Prism benefited from its high e-commerce mix due to COVID behavioral shifts and meaningful reduction in leverage from the RentPayment divestiture (2) May 11, 2026 Pre-earnings date (3) 4 Performance Since Pre-earnings Date (5/11/2026) Prism 12% Trading Comps (1%)
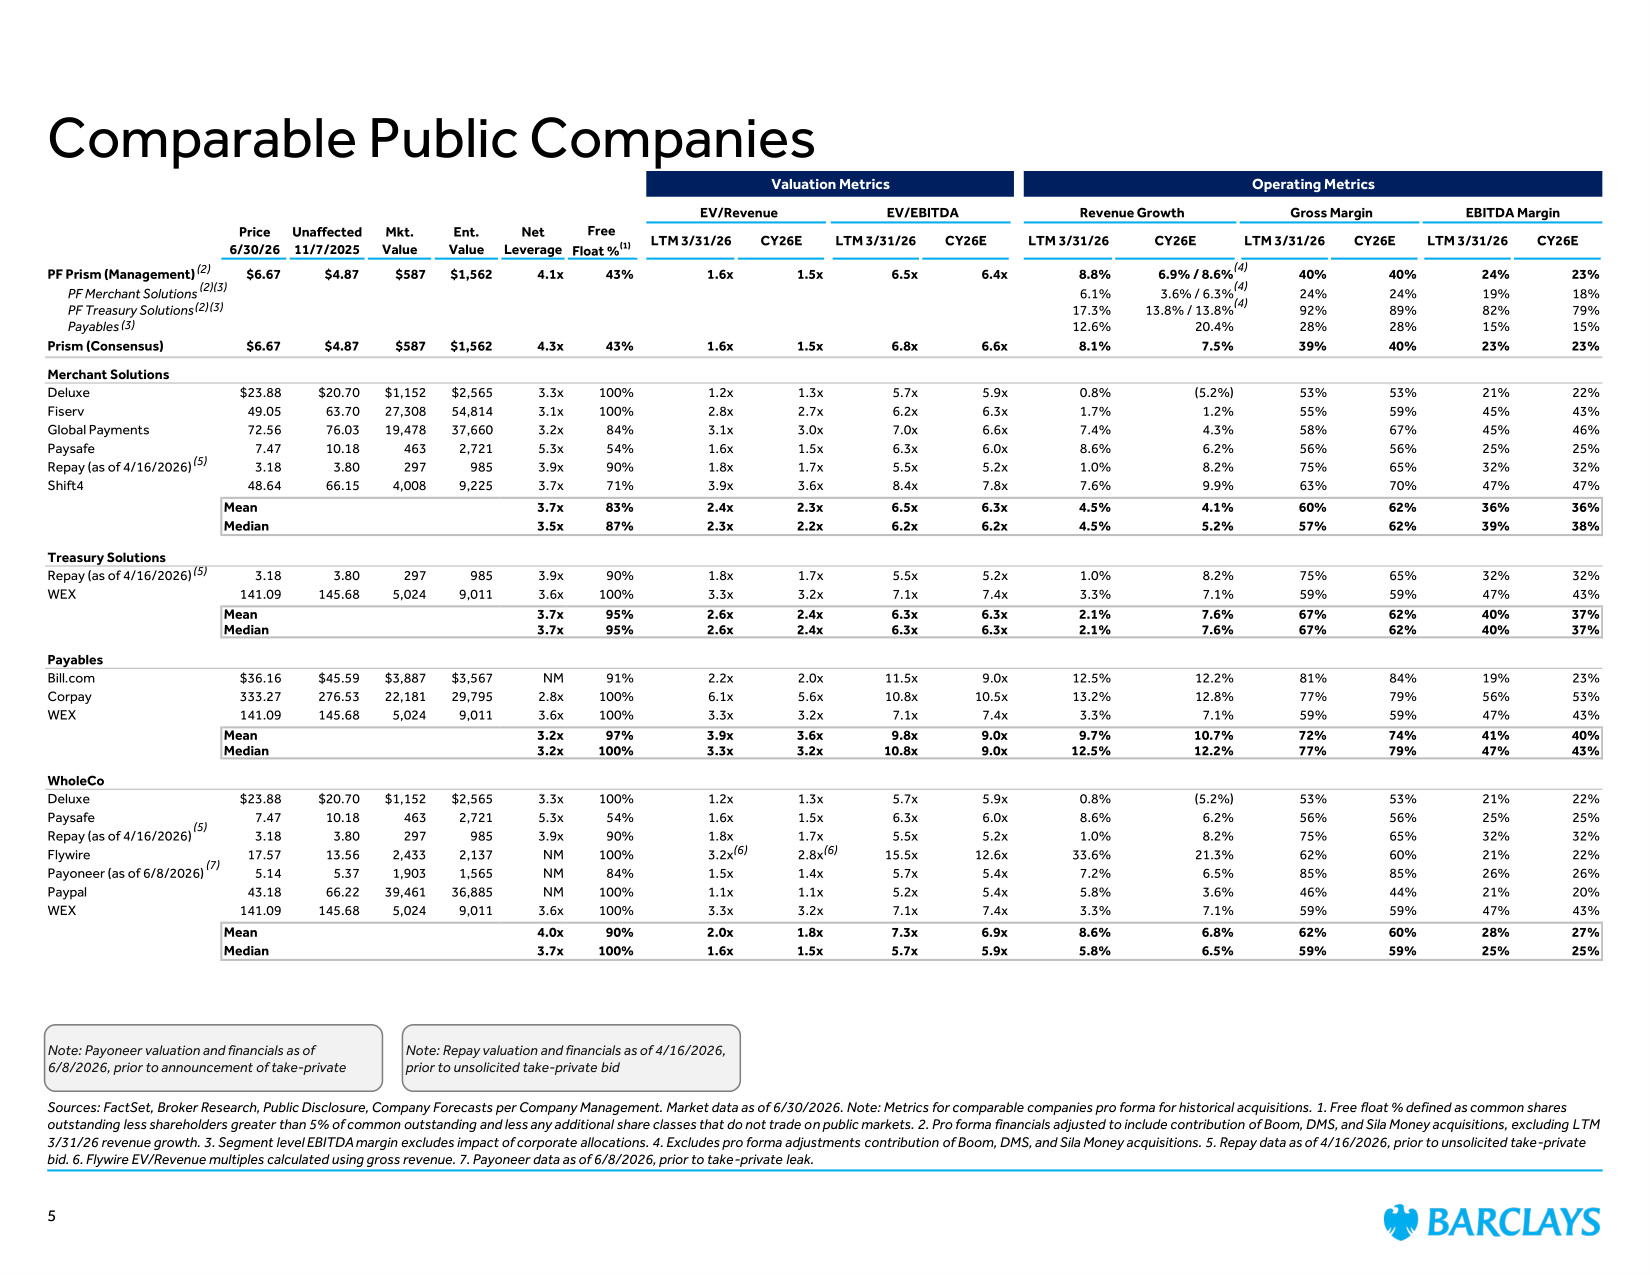
Comparable Public Companies Sources: FactSet, Broker Research, Public Disclosure, Company Forecasts per Company Management. Market data as of 6/30/2026. Note: Metrics for comparable companies pro forma for historical acquisitions. 1. Free float % defined as common shares outstanding less shareholders greater than 5% of common outstanding and less any additional share classes that do not trade on public markets. 2. Pro forma financials adjusted to include contribution of Boom, DMS, and Sila Money acquisitions, excluding LTM 3/31/26 revenue growth. 3. Segment level EBITDA margin excludes impact of corporate allocations. 4. Excludes pro forma adjustments contribution of Boom, DMS, and Sila Money acquisitions. 5. Repay data as of 4/16/2026, prior to unsolicited take-private bid. 6. Flywire EV/Revenue multiples calculated using gross revenue. 7. Payoneer data as of 6/8/2026, prior to take-private leak. (6) (2) (2) (2) (3) (3) (3) (4) (4) (4) (6) 5 (7) (5) (5) (5) Note: Repay valuation and financials as of 4/16/2026, prior to unsolicited take-private bid Note: Payoneer valuation and financials as of 6/8/2026, prior to announcement of take-private Valuation Metrics Operating Metrics EV/Revenue EV/EBITDA Revenue Growth Gross Margin EBITDA Margin Price 6/30/26 Unaffected 11/7/2025 Mkt. Value Ent. Value Net Leverage Free Float %(1) LTM 3/31/26 CY26E LTM 3/31/26 CY26E LTM 3/31/26 CY26E LTM 3/31/26 CY26E LTM 3/31/26 CY26E PF Prism (Management) $6.67 $4.87 $587 $1,562 4.1x 43% 1.6x 1.5x 6.5x 6.4x 8.8% 6.9% / 8.6% 40% 40% 24% 23% PF Merchant Solutions 6.1% 3.6% / 6.3% 24% 24% 19% 18% PF Treasury Solutions 17.3% 13.8% / 13.8% 92% 89% 82% 79% Payables 12.6% 20.4% 28% 28% 15% 15% Prism (Consensus) $6.67 $4.87 $587 $1,562 4.3x 43% 1.6x 1.5x 6.8x 6.6x 8.1% 7.5% 39% 40% 23% 23% Merchant Solutions Deluxe $23.88 $20.70 $1,152 $2,565 3.3x 100% 1.2x 1.3x 5.7x 5.9x 0.8% (5.2%) 53% 53% 21% 22% Fiserv 49.05 63.70 27,308 54,814 3.1x 100% 2.8x 2.7x 6.2x 6.3x 1.7% 1.2% 55% 59% 45% 43% Global Payments 72.56 76.03 19,478 37,660 3.2x 84% 3.1x 3.0x 7.0x 6.6x 7.4% 4.3% 58% 67% 45% 46% Paysafe 7.47 10.18 463 2,721 5.3x 54% 1.6x 1.5x 6.3x 6.0x 8.6% 6.2% 56% 56% 25% 25% Repay (as of 4/16/2026) 3.18 3.80 297 985 3.9x 90% 1.8x 1.7x 5.5x 5.2x 1.0% 8.2% 75% 65% 32% 32% Shift4 48.64 66.15 4,008 9,225 3.7x 71% 3.9x 3.6x 8.4x 7.8x 7.6% 9.9% 63% 70% 47% 47% Mean 3.7x 83% 2.4x 2.3x 6.5x 6.3x 4.5% 4.1% 60% 62% 36% 36% Median 3.5x 87% 2.3x 2.2x 6.2x 6.2x 4.5% 5.2% 57% 62% 39% 38% Treasury Solutions Repay (as of 4/16/2026) 3.18 3.80 297 985 3.9x 90% 1.8x 1.7x 5.5x 5.2x 1.0% 8.2% 75% 65% 32% 32% WEX 141.09 145.68 5,024 9,011 3.6x 100% 3.3x 3.2x 7.1x 7.4x 3.3% 7.1% 59% 59% 47% 43% Mean 3.7x 95% 2.6x 2.4x 6.3x 6.3x 2.1% 7.6% 67% 62% 40% 37% Median 3.7x 95% 2.6x 2.4x 6.3x 6.3x 2.1% 7.6% 67% 62% 40% 37% Payables Bill.com $36.16 $45.59 $3,887 $3,567 NM 91% 2.2x 2.0x 11.5x 9.0x 12.5% 12.2% 81% 84% 19% 23% Corpay 333.27 276.53 22,181 29,795 2.8x 100% 6.1x 5.6x 10.8x 10.5x 13.2% 12.8% 77% 79% 56% 53% WEX 141.09 145.68 5,024 9,011 3.6x 100% 3.3x 3.2x 7.1x 7.4x 3.3% 7.1% 59% 59% 47% 43% Mean 3.2x 97% 3.9x 3.6x 9.8x 9.0x 9.7% 10.7% 72% 74% 41% 40% Median 3.2x 100% 3.3x 3.2x 10.8x 9.0x 12.5% 12.2% 77% 79% 47% 43% WholeCo Deluxe $23.88 $20.70 $1,152 $2,565 3.3x 100% 1.2x 1.3x 5.7x 5.9x 0.8% (5.2%) 53% 53% 21% 22% Paysafe 7.47 10.18 463 2,721 5.3x 54% 1.6x 1.5x 6.3x 6.0x 8.6% 6.2% 56% 56% 25% 25% Repay (as of 4/16/2026) 3.18 3.80 297 985 3.9x 90% 1.8x 1.7x 5.5x 5.2x 1.0% 8.2% 75% 65% 32% 32% Flywire 17.57 13.56 2,433 2,137 NM 100% 3.2x 2.8x 15.5x 12.6x 33.6% 21.3% 62% 60% 21% 22% Payoneer (as of 6/8/2026) 5.14 5.37 1,903 1,565 NM 84% 1.5x 1.4x 5.7x 5.4x 7.2% 6.5% 85% 85% 26% 26% Paypal 43.18 66.22 39,461 36,885 NM 100% 1.1x 1.1x 5.2x 5.4x 5.8% 3.6% 46% 44% 21% 20% WEX 141.09 145.68 5,024 9,011 3.6x 100% 3.3x 3.2x 7.1x 7.4x 3.3% 7.1% 59% 59% 47% 43% Mean 4.0x 90% 2.0x 1.8x 7.3x 6.9x 8.6% 6.8% 62% 60% 28% 27% Median 3.7x 100% 1.6x 1.5x 5.7x 5.9x 5.8% 6.5% 59% 59% 25% 25%
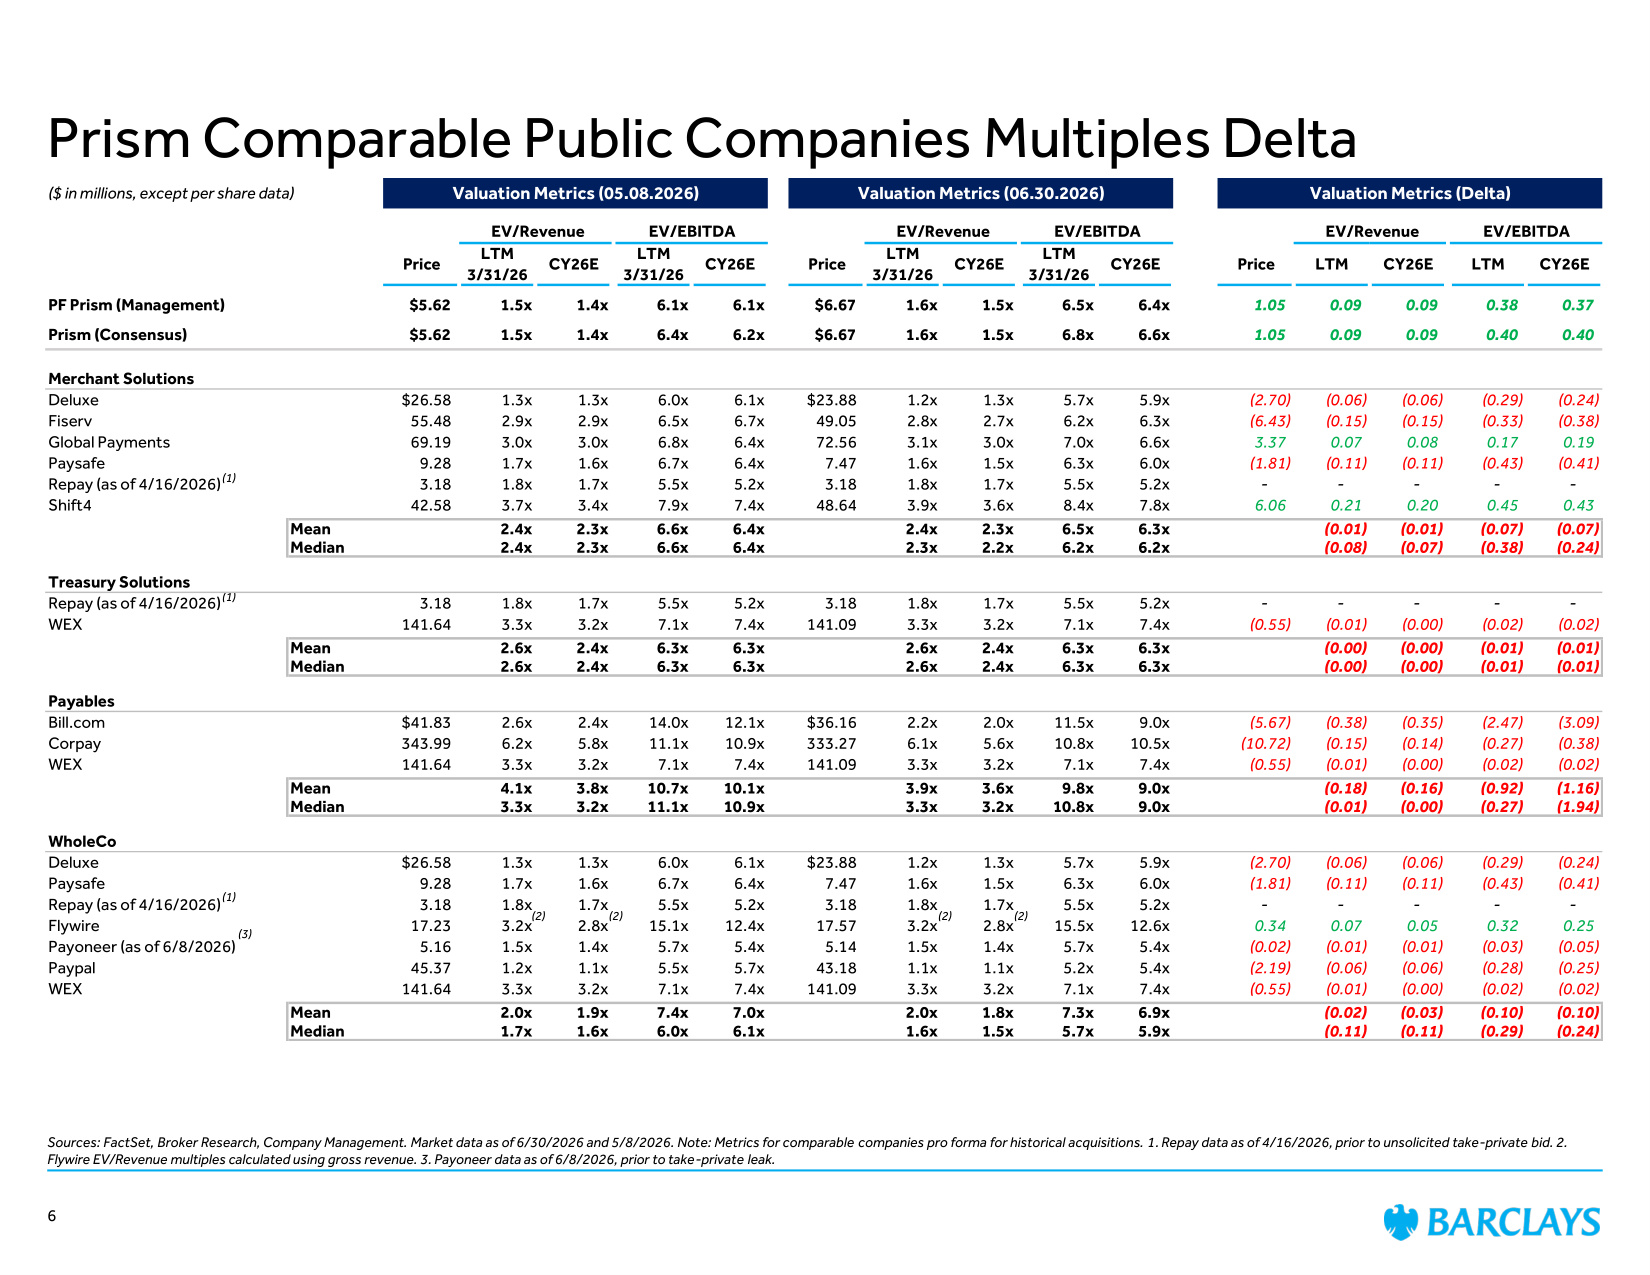
Prism Comparable Public Companies Multiples Delta Sources: FactSet, Broker Research, Company Management. Market data as of 6/30/2026 and 5/8/2026. Note: Metrics for comparable companies pro forma for historical acquisitions. 1. Repay data as of 4/16/2026, prior to unsolicited take-private bid. 2. Flywire EV/Revenue multiples calculated using gross revenue. 3. Payoneer data as of 6/8/2026, prior to take-private leak. (2) (2) (2) (2) (3) 6 (1) (1) (1) ($ in millions, except per share data) Valuation Metrics (05.08.2026) Valuation Metrics (06.30.2026) Valuation Metrics (Delta) EV/Revenue EV/EBITDA EV/Revenue EV/EBITDA EV/Revenue EV/EBITDA Price LTM 3/31/26 CY26E LTM 3/31/26 CY26E Price LTM 3/31/26 CY26E LTM 3/31/26 CY26E Price LTM CY26E LTM CY26E PF Prism (Management) $5.62 1.5x 1.4x 6.1x 6.1x $6.67 1.6x 1.5x 6.5x 6.4x 1.05 0.09 0.09 0.38 0.37 Prism (Consensus) $5.62 1.5x 1.4x 6.4x 6.2x $6.67 1.6x 1.5x 6.8x 6.6x 1.05 0.09 0.09 0.40 0.40 Merchant Solutions Deluxe $26.58 1.3x 1.3x 6.0x 6.1x $23.88 1.2x 1.3x 5.7x 5.9x (2.70) (0.06) (0.06) (0.29) (0.24) Fiserv 55.48 2.9x 2.9x 6.5x 6.7x 49.05 2.8x 2.7x 6.2x 6.3x (6.43) (0.15) (0.15) (0.33) (0.38) Global Payments 69.19 3.0x 3.0x 6.8x 6.4x 72.56 3.1x 3.0x 7.0x 6.6x 3.37 0.07 0.08 0.17 0.19 Paysafe 9.28 1.7x 1.6x 6.7x 6.4x 7.47 1.6x 1.5x 6.3x 6.0x (1.81) (0.11) (0.11) (0.43) (0.41) Repay (as of 4/16/2026) 3.18 1.8x 1.7x 5.5x 5.2x 3.18 1.8x 1.7x 5.5x 5.2x - - - - - Shift4 42.58 3.7x 3.4x 7.9x 7.4x 48.64 3.9x 3.6x 8.4x 7.8x 6.06 0.21 0.20 0.45 0.43 Mean 2.4x 2.3x 6.6x 6.4x 2.4x 2.3x 6.5x 6.3x (0.01) (0.01) (0.07) (0.07) Median 2.4x 2.3x 6.6x 6.4x 2.3x 2.2x 6.2x 6.2x (0.08) (0.07) (0.38) (0.24) Treasury Solutions Repay (as of 4/16/2026) 3.18 1.8x 1.7x 5.5x 5.2x 3.18 1.8x 1.7x 5.5x 5.2x - - - - - WEX 141.64 3.3x 3.2x 7.1x 7.4x 141.09 3.3x 3.2x 7.1x 7.4x (0.55) (0.01) (0.00) (0.02) (0.02) Mean 2.6x 2.4x 6.3x 6.3x 2.6x 2.4x 6.3x 6.3x (0.00) (0.00) (0.01) (0.01) Median 2.6x 2.4x 6.3x 6.3x 2.6x 2.4x 6.3x 6.3x (0.00) (0.00) (0.01) (0.01) Payables Bill.com $41.83 2.6x 2.4x 14.0x 12.1x $36.16 2.2x 2.0x 11.5x 9.0x (5.67) (0.38) (0.35) (2.47) (3.09) Corpay 343.99 6.2x 5.8x 11.1x 10.9x 333.27 6.1x 5.6x 10.8x 10.5x (10.72) (0.15) (0.14) (0.27) (0.38) WEX 141.64 3.3x 3.2x 7.1x 7.4x 141.09 3.3x 3.2x 7.1x 7.4x (0.55) (0.01) (0.00) (0.02) (0.02) Mean 4.1x 3.8x 10.7x 10.1x 3.9x 3.6x 9.8x 9.0x (0.18) (0.16) (0.92) (1.16) Median 3.3x 3.2x 11.1x 10.9x 3.3x 3.2x 10.8x 9.0x (0.01) (0.00) (0.27) (1.94) WholeCo Deluxe $26.58 1.3x 1.3x 6.0x 6.1x $23.88 1.2x 1.3x 5.7x 5.9x (2.70) (0.06) (0.06) (0.29) (0.24) Paysafe 9.28 1.7x 1.6x 6.7x 6.4x 7.47 1.6x 1.5x 6.3x 6.0x (1.81) (0.11) (0.11) (0.43) (0.41) Repay (as of 4/16/2026) 3.18 1.8x 1.7x 5.5x 5.2x 3.18 1.8x 1.7x 5.5x 5.2x - - - - - Flywire 17.23 3.2x 2.8x 15.1x 12.4x 17.57 3.2x 2.8x 15.5x 12.6x 0.34 0.07 0.05 0.32 0.25 Payoneer (as of 6/8/2026) 5.16 1.5x 1.4x 5.7x 5.4x 5.14 1.5x 1.4x 5.7x 5.4x (0.02) (0.01) (0.01) (0.03) (0.05) Paypal 45.37 1.2x 1.1x 5.5x 5.7x 43.18 1.1x 1.1x 5.2x 5.4x (2.19) (0.06) (0.06) (0.28) (0.25) WEX 141.64 3.3x 3.2x 7.1x 7.4x 141.09 3.3x 3.2x 7.1x 7.4x (0.55) (0.01) (0.00) (0.02) (0.02) Mean 2.0x 1.9x 7.4x 7.0x 2.0x 1.8x 7.3x 6.9x (0.02) (0.03) (0.10) (0.10) Median 1.7x 1.6x 6.0x 6.1x 1.6x 1.5x 5.7x 5.9x (0.11) (0.11) (0.29) (0.24)
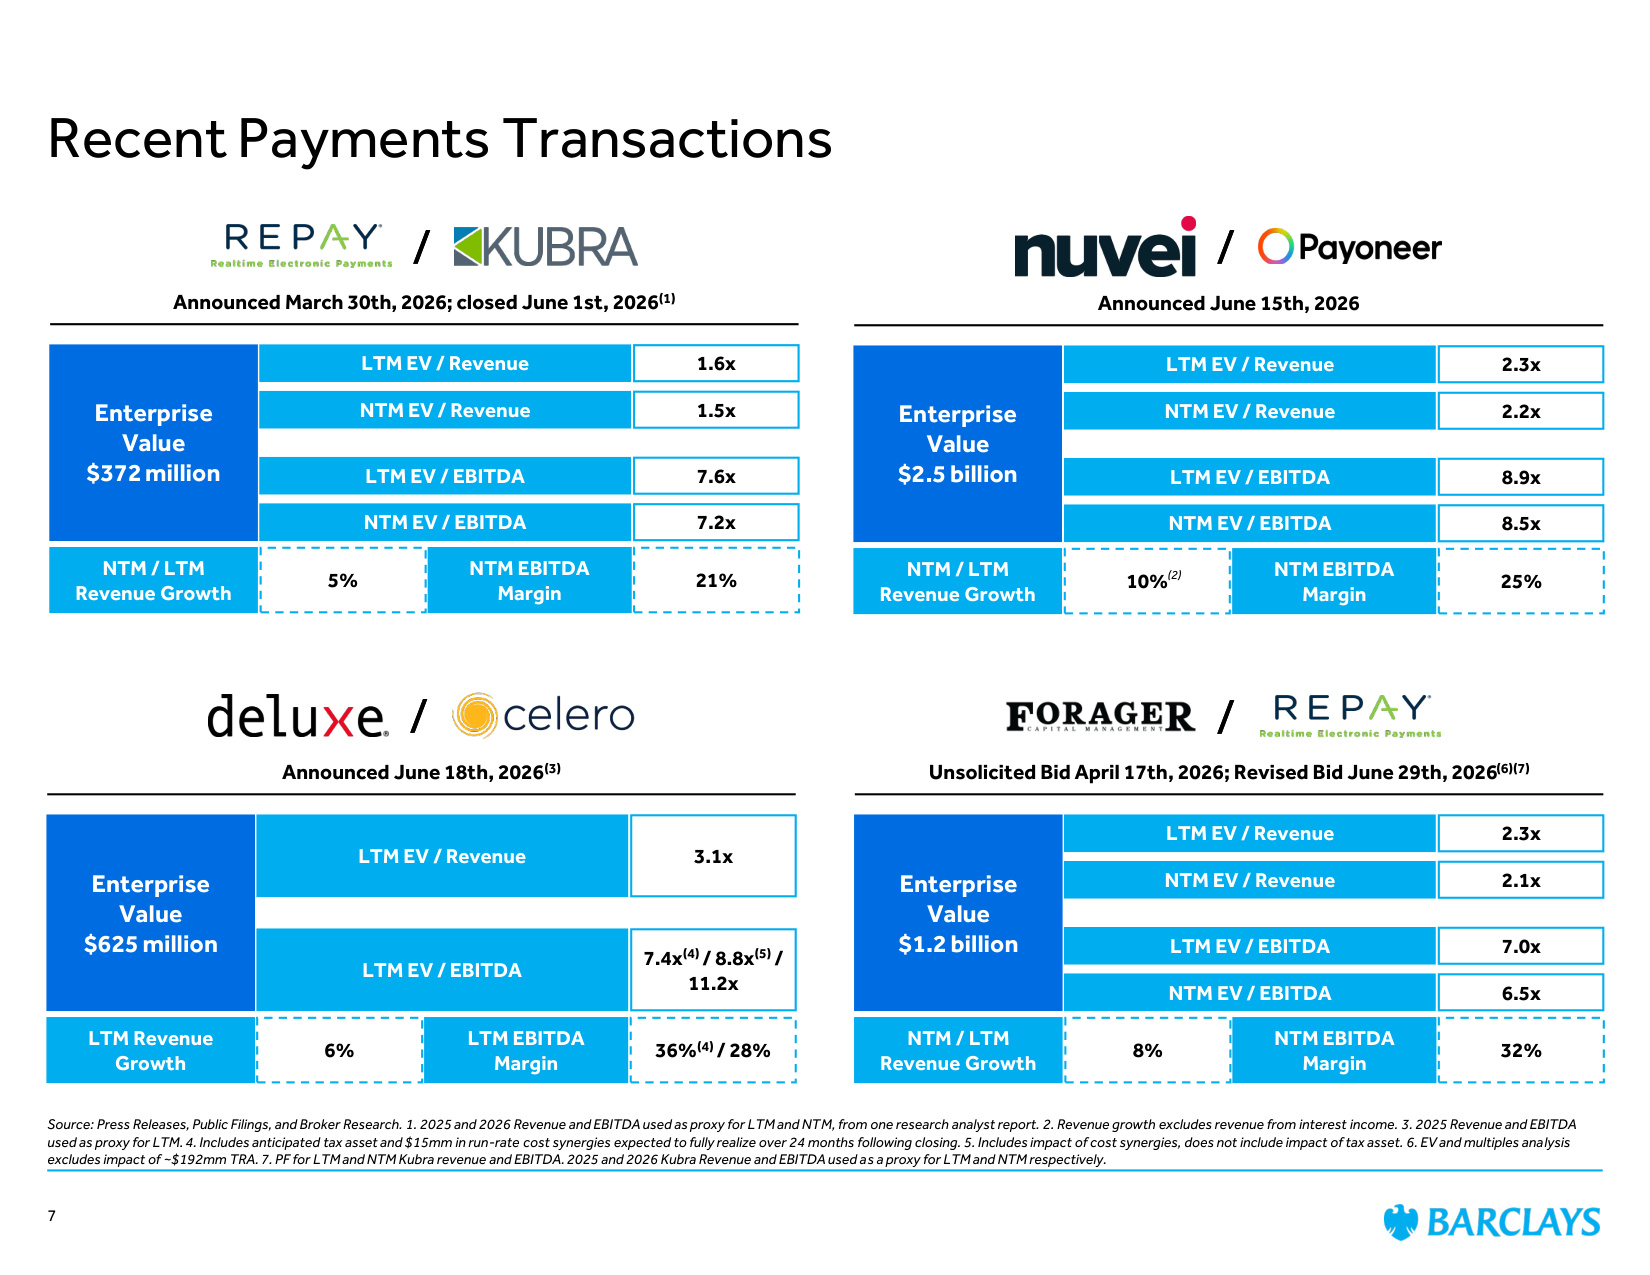
Recent Payments Transactions Source: Press Releases, Public Filings, and Broker Research. 1. 2025 and 2026 Revenue and EBITDA used as proxy for LTM and NTM, from one research analyst report. 2. Revenue growth excludes revenue from interest income. 3. 2025 Revenue and EBITDA used as proxy for LTM. 4. Includes anticipated tax asset and $15mm in run-rate cost synergies expected to fully realize over 24 months following closing. 5. Includes impact of cost synergies, does not include impact of tax asset. 6. EV and multiples analysis excludes impact of ~$192mm TRA. 7. PF for LTM and NTM Kubra revenue and EBITDA. 2025 and 2026 Kubra Revenue and EBITDA used as a proxy for LTM and NTM respectively. 7 / Announced June 18th, 2026(3) Enterprise Value $625 million LTM Revenue Growth LTM EV / Revenue 3.1x LTM EV / EBITDA 7.4x(4) / 8.8x(5) / 11.2x LTM EBITDA Margin 6% 36%(4) / 28% / Announced March 30th, 2026; closed June 1st, 2026(1) Enterprise Value $372 million NTM / LTM Revenue Growth LTM EV / Revenue 1.6x NTM EV / Revenue 1.5x LTM EV / EBITDA 7.6x NTM EV / EBITDA 7.2x NTM EBITDA Margin 5% 21% / Announced June 15th, 2026 Enterprise Value $2.5 billion NTM / LTM Revenue Growth LTM EV / Revenue 2.3x NTM EV / Revenue 2.2x LTM EV / EBITDA 8.9x NTM EV / EBITDA 8.5x NTM EBITDA Margin 10% 25% (2) / Unsolicited Bid April 17th, 2026; Revised Bid June 29th, 2026(6)(7) Enterprise Value $1.2 billion NTM / LTM Revenue Growth LTM EV / Revenue 2.3x NTM EV / Revenue 2.1x LTM EV / EBITDA 7.0x NTM EV / EBITDA 6.5x NTM EBITDA Margin 8% 32% / / / /
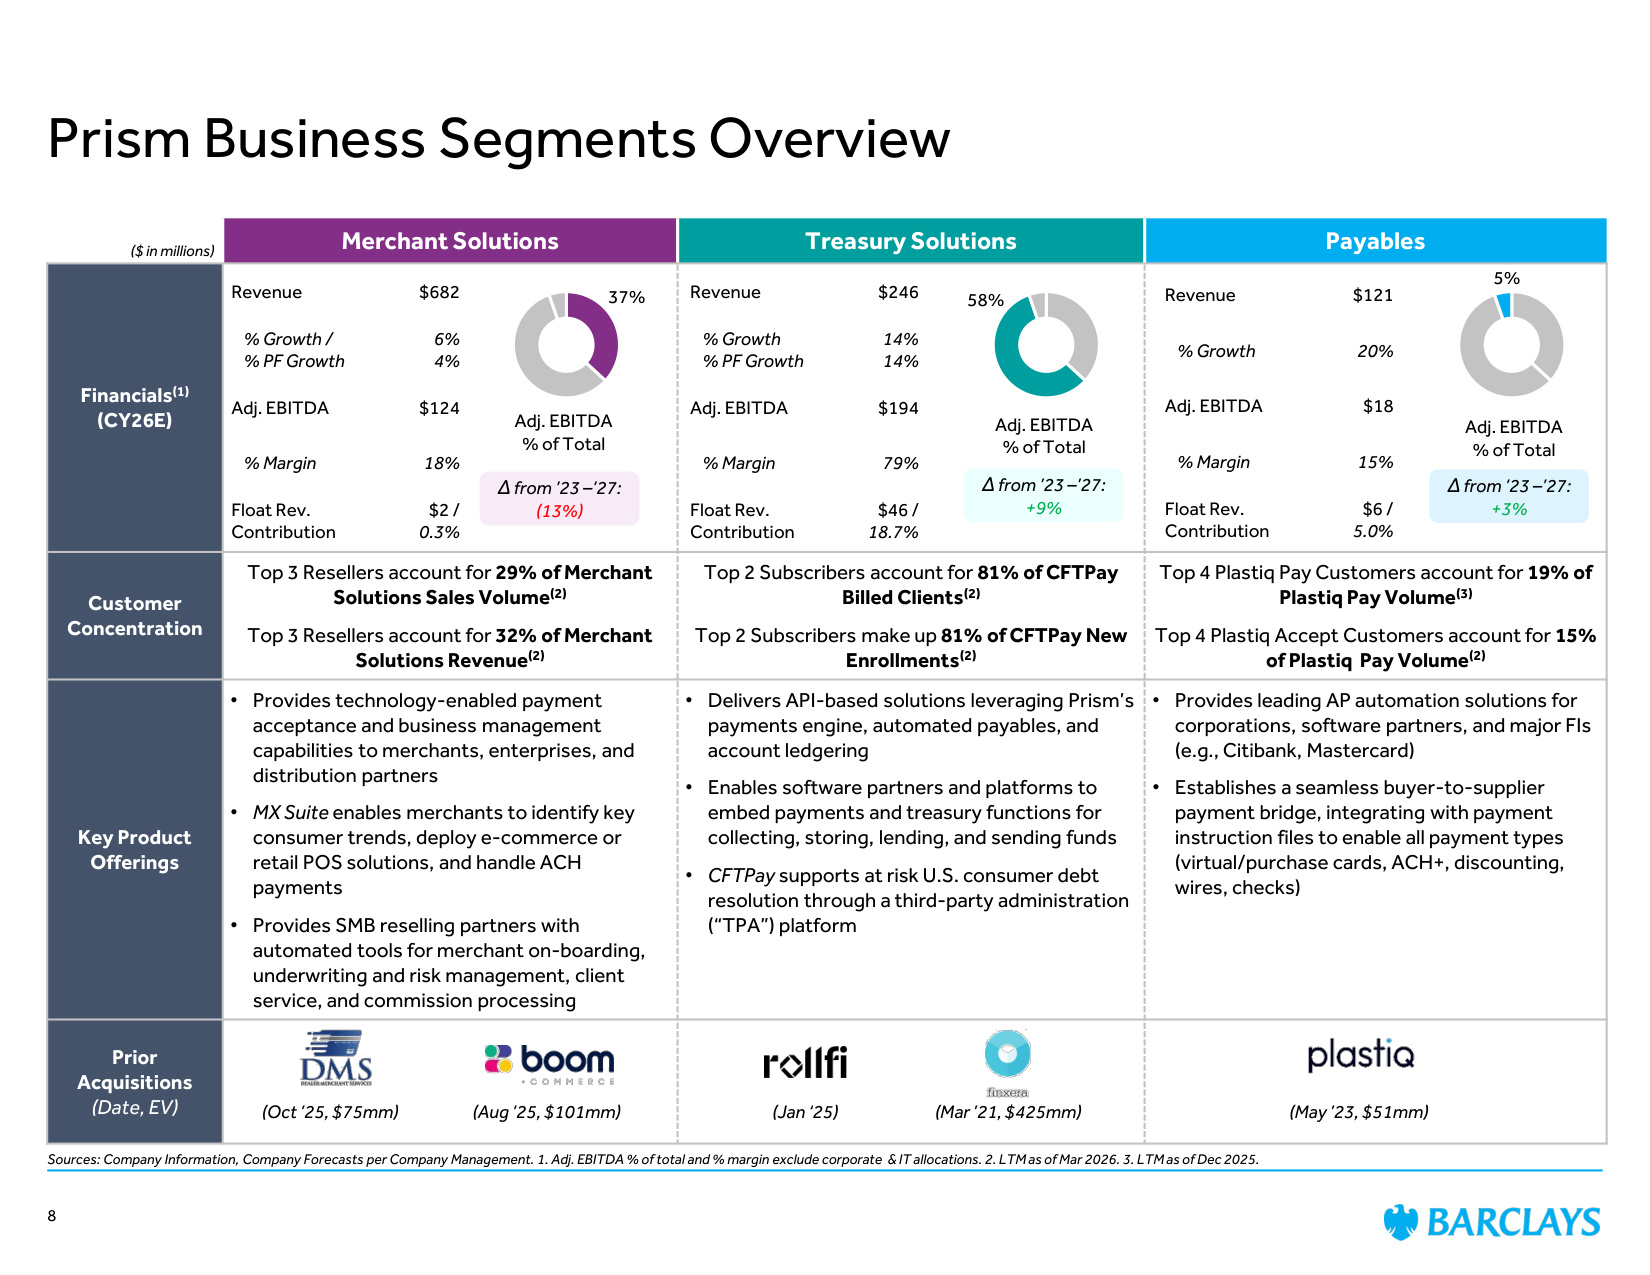
Prism Business Segments Overview Sources: Company Information, Company Forecasts per Company Management. 1. Adj. EBITDA % of total and % margin exclude corporate & IT allocations. 2. LTM as of Mar 2026. 3. LTM as of Dec 2025. Merchant Solutions Treasury Solutions Payables Financials(1) (CY26E) Customer Concentration Top 3 Resellers account for 29% of Merchant Solutions Sales Volume(2) Top 3 Resellers account for 32% of Merchant Solutions Revenue(2) Top 2 Subscribers account for 81% of CFTPay Billed Clients(2) Top 2 Subscribers make up 81% of CFTPay New Enrollments(2) Top 4 Plastiq Pay Customers account for 19% of Plastiq Pay Volume(3) Top 4 Plastiq Accept Customers account for 15% of Plastiq Pay Volume(2) Key Product Offerings • Provides technology-enabled payment acceptance and business management capabilities to merchants, enterprises, and distribution partners • MX Suite enables merchants to identify key consumer trends, deploy e-commerce or retail POS solutions, and handle ACH payments • Provides SMB reselling partners with automated tools for merchant on-boarding, underwriting and risk management, client service, and commission processing • Delivers API-based solutions leveraging Prism's payments engine, automated payables, and account ledgering • Enables software partners and platforms to embed payments and treasury functions for collecting, storing, lending, and sending funds • CFTPay supports at risk U.S. consumer debt resolution through a third-party administration ("TPA") platform • Provides leading AP automation solutions for corporations, software partners, and major FIs (e.g., Citibank, Mastercard) • Establishes a seamless buyer-to-supplier payment bridge, integrating with payment instruction files to enable all payment types (virtual/purchase cards, ACH+, discounting, wires, checks) Prior Acquisitions (Date, EV) ($ in millions) (Oct '25, $75mm) (Aug '25, $101mm) (Jan '25) (Mar '21, $425mm) (May '23, $51mm) 37% 58% 5% Adj. EBITDA % of Total Adj. EBITDA % of Total Adj. EBITDA % of Total Revenue $682 % Growth / % PF Growth 6% 4% Adj. EBITDA $124 % Margin 18% Float Rev. Contribution $2 / 0.3% Revenue $246 % Growth % PF Growth 14% 14% Adj. EBITDA $194 % Margin 79% Float Rev. Contribution $46 / 18.7% Revenue $121 % Growth 20% Adj. EBITDA $18 % Margin 15% Float Rev. Contribution $6 / 5.0% Δ from '23 –'27: (13%) Δ from '23 –'27: +9% Δ from '23 –'27: +3% 8
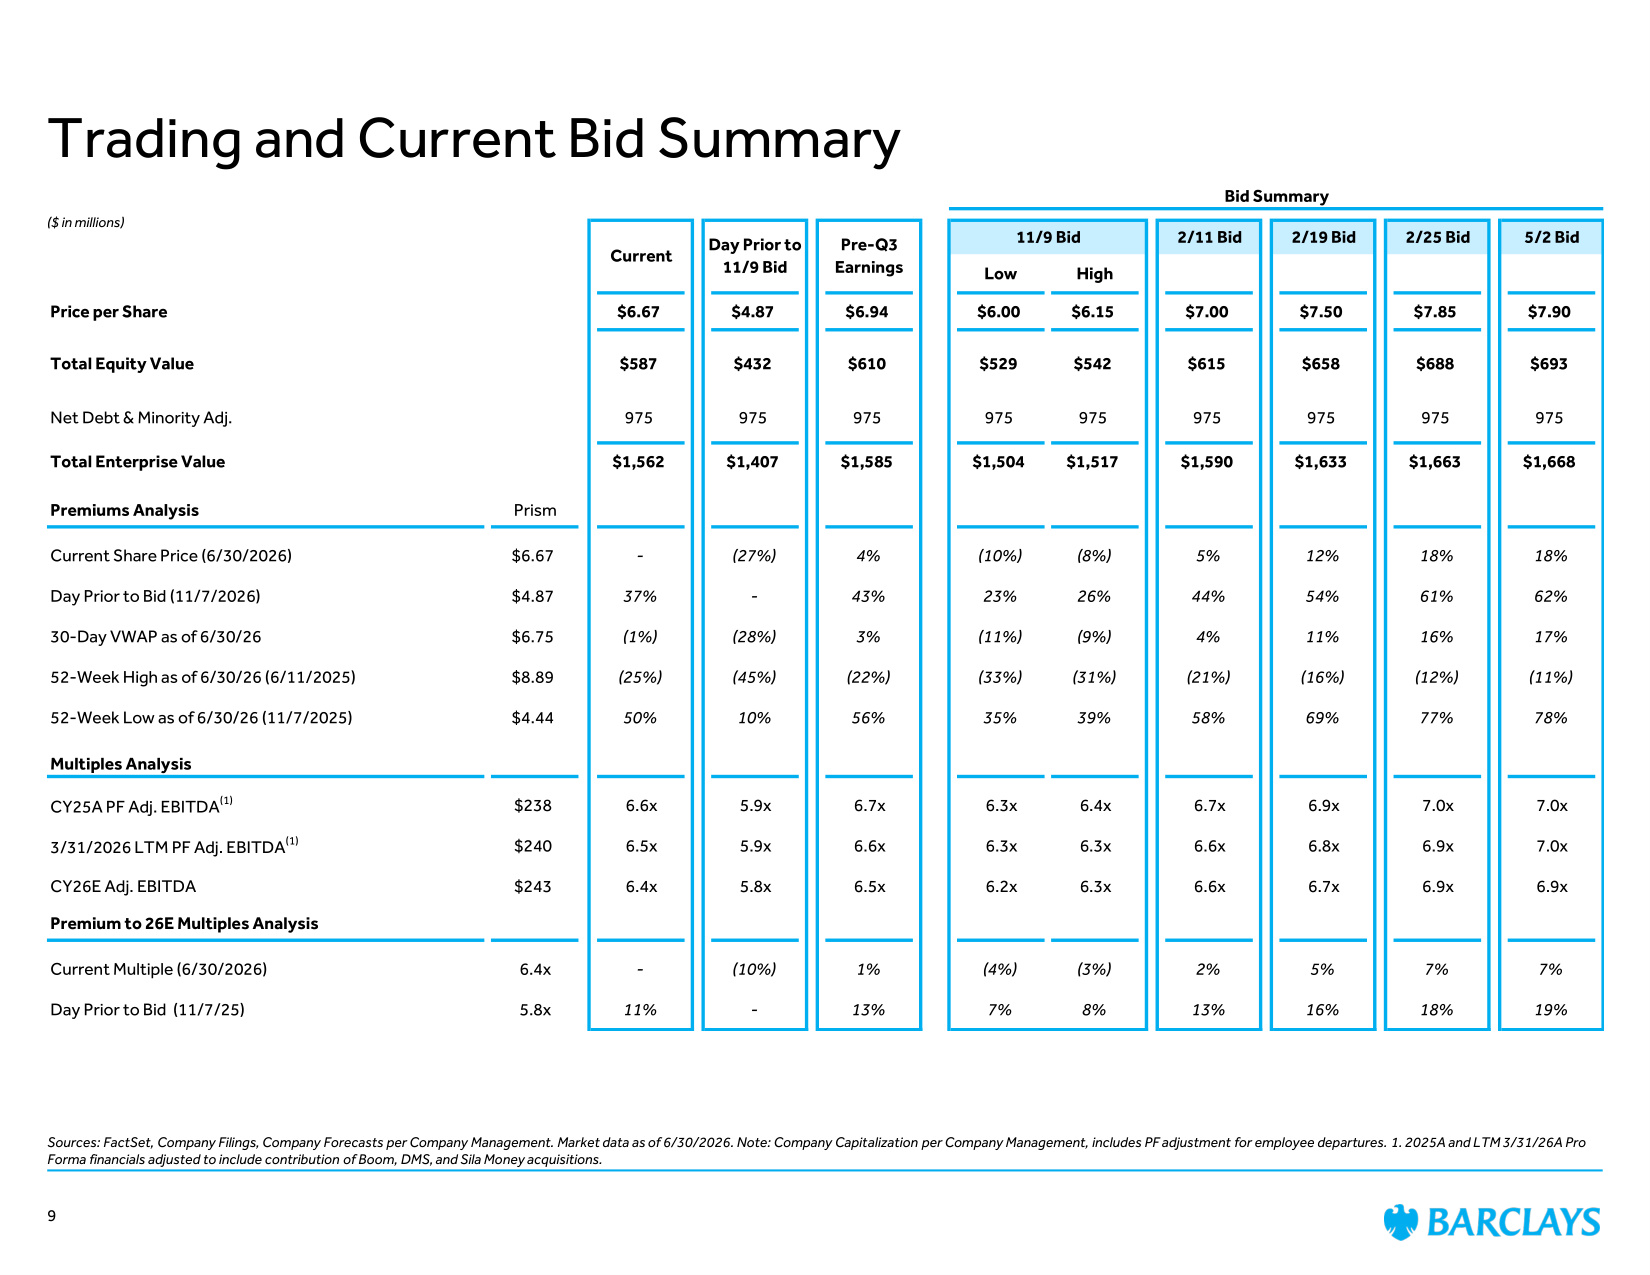
Trading and Current Bid Summary Sources: FactSet, Company Filings, Company Forecasts per Company Management. Market data as of 6/30/2026. Note: Company Capitalization per Company Management, includes PF adjustment for employee departures. 1. 2025A and LTM 3/31/26A Pro Forma financials adjusted to include contribution of Boom, DMS, and Sila Money acquisitions. Bid Summary 11/9 Bid 2/11 Bid 2/19 Bid 2/25 Bid 5/2 Bid Low High Price per Share $6.67 $4.87 $6.94 $6.00 $6.15 $7.00 $7.50 $7.85 $7.90 Total Equity Value $587 $432 $610 $529 $542 $615 $658 $688 $693 Net Debt & Minority Adj. 975 975 975 975 975 975 975 975 975 Total Enterprise Value $1,562 $1,407 $1,585 $1,504 $1,517 $1,590 $1,633 $1,663 $1,668 Premiums Analysis Prism Current Share Price (6/30/2026) $6.67 - (27%) 4% (10%) (8%) 5% 12% 18% 18% Day Prior to Bid (11/7/2026) $4.87 37% - 43% 23% 26% 44% 54% 61% 62% 30-Day VWAP as of 6/30/26 $6.75 (1%) (28%) 3% (11%) (9%) 4% 11% 16% 17% 52-Week High as of 6/30/26 (6/11/2025) $8.89 (25%) (45%) (22%) (33%) (31%) (21%) (16%) (12%) (11%) 52-Week Low as of 6/30/26 (11/7/2025) $4.44 50% 10% 56% 35% 39% 58% 69% 77% 78% Multiples Analysis CY25A PF Adj. EBITDA(1) $238 6.6x 5.9x 6.7x 6.3x 6.4x 6.7x 6.9x 7.0x 7.0x 3/31/2026 LTM PF Adj. EBITDA(1) $240 6.5x 5.9x 6.6x 6.3x 6.3x 6.6x 6.8x 6.9x 7.0x CY26E Adj. EBITDA $243 6.4x 5.8x 6.5x 6.2x 6.3x 6.6x 6.7x 6.9x 6.9x Premium to 26E Multiples Analysis Current Multiple (6/30/2026) 6.4x - (10%) 1% (4%) (3%) 2% 5% 7% 7% Day Prior to Bid (11/7/25) 5.8x 11% - 13% 7% 8% 13% 16% 18% 19% Current Day Prior to 11/9 Bid Pre-Q3 Earnings ($ in millions) 9
Disclaimer 10 This document has been prepared by Barclays Capital Inc. ("Barclays") for information purposes only. This document is confidential and for the sole and exclusive benefit and internal use of the Recipient in connection with the matter or possible transaction to which this document relates, and no part of it may be reproduced, distributed or transmitted without the prior written permission of Barclays. This document is an indicative summary of the terms and conditions of the transaction described herein and may be amended, superseded or replaced by subsequent summaries. The final terms and conditions of the transaction will be set out in full in the applicable binding transaction document(s). This document is incomplete without reference to, and should be assessed solely in conjunction with, the oral briefing provided by Barclays. Neither Barclays nor any of its subsidiaries or affiliates shall be obliged by having made this document available to you to provide any financial advisory services (whether in relation to the matter or possible transaction to which this document relates or otherwise) or to sell, acquire, place or underwrite any securities or to lend moneys or to provide any other commitment, facility, product, risk management solution or service, nor does Barclays represent by providing this document to the Recipient that it will be possible for Barclays to provide, arrange or undertake any of the aforementioned services, activities, products or solutions. Any commitment by Barclays to provide, arrange or undertake any of the aforementioned services, activities, products or solutions would be subject to Barclays signing appropriate documentation, obtaining all necessary internal approvals and completing due diligence, in each case in a manner satisfactory to Barclays. This document was prepared on the basis of information and data, obtained from publicly available sources and, where applicable, from the Recipient and/or any other entity that may be involved in any transaction or matter contemplated by this document (and/or any of the Recipient's or the aforementioned entities' affiliates), in each case prior to or on the date hereof. Barclays makes no warranty or representation, express or implied, as to the accuracy or completeness of information which is contained in this document and which is stated to have been obtained from or is based upon trade and statistical services or other third party sources. The information in this document has not been independently verified by Barclays and Barclays does not assume any liability for any such information. Any data on past performance, modeling or back-testing contained herein is no indication as to future performance. No representation is made as to the reasonableness of the assumptions made within or the accuracy or completeness of any modeling or back-testing or any other information contained herein. All opinions and estimates are given as of the date hereof and are subject to change and Barclays assumes no obligation to update this document to reflect any such changes. The value of any investment may fluctuate as a result of market changes. The information herein is not intended to predict actual results and no assurances are given with respect thereto. Nothing herein shall be deemed to constitute investment, legal, tax, financial, accounting or other advice. The Recipient is responsible for making its own independent investigation and appraisal of the risks, benefits, appropriateness and suitability of any transaction or matter contemplated by this document and Barclays is not making any recommendation (personal or otherwise) or giving any investment advice and will have no liability with respect thereto. The decision to proceed with any transaction or action contemplated by this document must be made by the Recipient in the light of its own commercial assessments and Barclays will not be responsible for such assessments. Neither Barclays nor any of its subsidiaries or affiliates, nor any of their respective directors, officers, employees, advisors or other representatives (Barclays together with such persons being the "Barclays Group") accepts any liability whatsoever for any direct, indirect or consequential losses (in contract, tort or otherwise) arising from the use of this document or its contents or any reliance on the information contained herein. Barclays Group is not responsible for any specialized advice (including financial, tax, legal and accounting, among other advice). This document does not constitute nor does it form part of an offer to sell or purchase, or the solicitation of an offer to sell or purchase, any securities or any of the businesses or assets described herein or an offer or recommendation to enter into any transaction described herein nor does this document constitute an offer or commitment to provide, arrange or underwrite any financing. Members of the Barclays Group are involved in a wide range of commercial banking, investment banking and other activities out of which conflicting interests or duties may arise. In the ordinary course of its business, the Barclays Group may provide services to any other entity or person whether or not a member of the same group as the Recipient (a "Third Party"), engage in any transaction (whether on its own account, on behalf of any Third Party or otherwise, and including any transaction or matter contemplated by this document), notwithstanding that such services, transactions or actions may be adverse to the Recipient or any member of the Recipient's group, and the Barclays Group may retain for its own benefit any related remuneration or profit. The Barclays Group operates in accordance with a conflicts of interest policy which identifies conflicts of interest it faces in the ordinary course of its business, and establishes organisational and procedural measures to manage those conflicts where it is reasonably able to do so. Neither Barclays nor any other part of the Barclays Group shall have any duty to disclose to the Recipient or utilise for the Recipient's benefit any non-public information acquired in the course of providing services to any other person, engaging in any transaction (on its own account or otherwise) or otherwise carrying on its business.`The Barclays Group's research analysts and research departments are independent from its banking business and are subject to certain regulations and internal policies. The Barclays Group's research analysts may hold opinions and make statements or investment recommendations and/or publish research reports with respect to any company referred to herein, the transactions contemplated herein or any person or entity involved therein or related thereto that differ from or are inconsistent with the views or advice communicated by the Barclays Group's banking business. Barclays is a full service securities firm and as such from time to time may effect transactions for its own account or the account of its clients and hold long or short positions in debt, equity or other securities of the companies referred to herein or in other financial products and instruments. Unless otherwise expressly agreed or provided for in other applicable Barclays disclosures governing such transactions or required by law or regulation, Barclays conducts these activities as principal and executes its principal transactions as an arm's length counterparty. Barclays does not act as a fiduciary in relation to these transactions. THIS DOCUMENT DOES NOT DISCLOSE ALL THE RISKS AND OTHER SIGNIFICANT ISSUES RELATED TO AN INVESTMENT IN THE SECURITIES, FINANCIAL INSTRUMENTS OR TRANSACTIONS DESCRIBED HEREIN. PRIOR TO TRANSACTING, YOU SHOULD ENSURE THAT YOU FULLY UNDERSTAND THE TERMS OF THE TRANSACTION AND ANY APPLICABLE RISKS. THE INFORMATION CONTAINED HEREIN IS NOT INTENDED TO BE DISTRIBUTED TO ANY PROSPECTIVE OR ACTUAL INVESTORS AND, ACCORDINGLY, MAY NOT BE SHOWN OR GIVEN TO ANY PERSON OTHER THAN THE RECIPIENT, AND IS NOT TO BE FORWARDED TO ANY OTHER PERSON (INCLUDING ANY RETAIL INVESTOR OR CUSTOMER), COPIED OR OTHERWISE REPRODUCED OR DISTRIBUTED TO ANY SUCH PERSON IN ANY MANNER WHATSOEVER. FAILURE TO COMPLY WITH THIS DIRECTIVE CAN RESULT IN A VIOLATION OF THE SECURITIES ACT OF 1933, AS AMENDED. These materials have not been produced by the Barclays Group's research department and do not constitute investment research or a research recommendation for the purposes of the Financial Conduct Authority rules or a research report under applicable U.S. law. Barclays Capital Inc. is the United States investment bank of Barclays Bank PLC. Barclays Bank PLC is authorised by the Prudential Regulation Authority and regulated by the Financial Conduct Authority and the Prudential Regulation Authority (Financial Services Register No. 122702). Registered in England. Registered No. 1026167. Registered office: 1 Churchill Place, London E14 5HP. Copyright Barclays Bank PLC, 2026 (all rights reserved).
Exhibit (C)(9)
Project Prism: Valuation Analysis September 2026
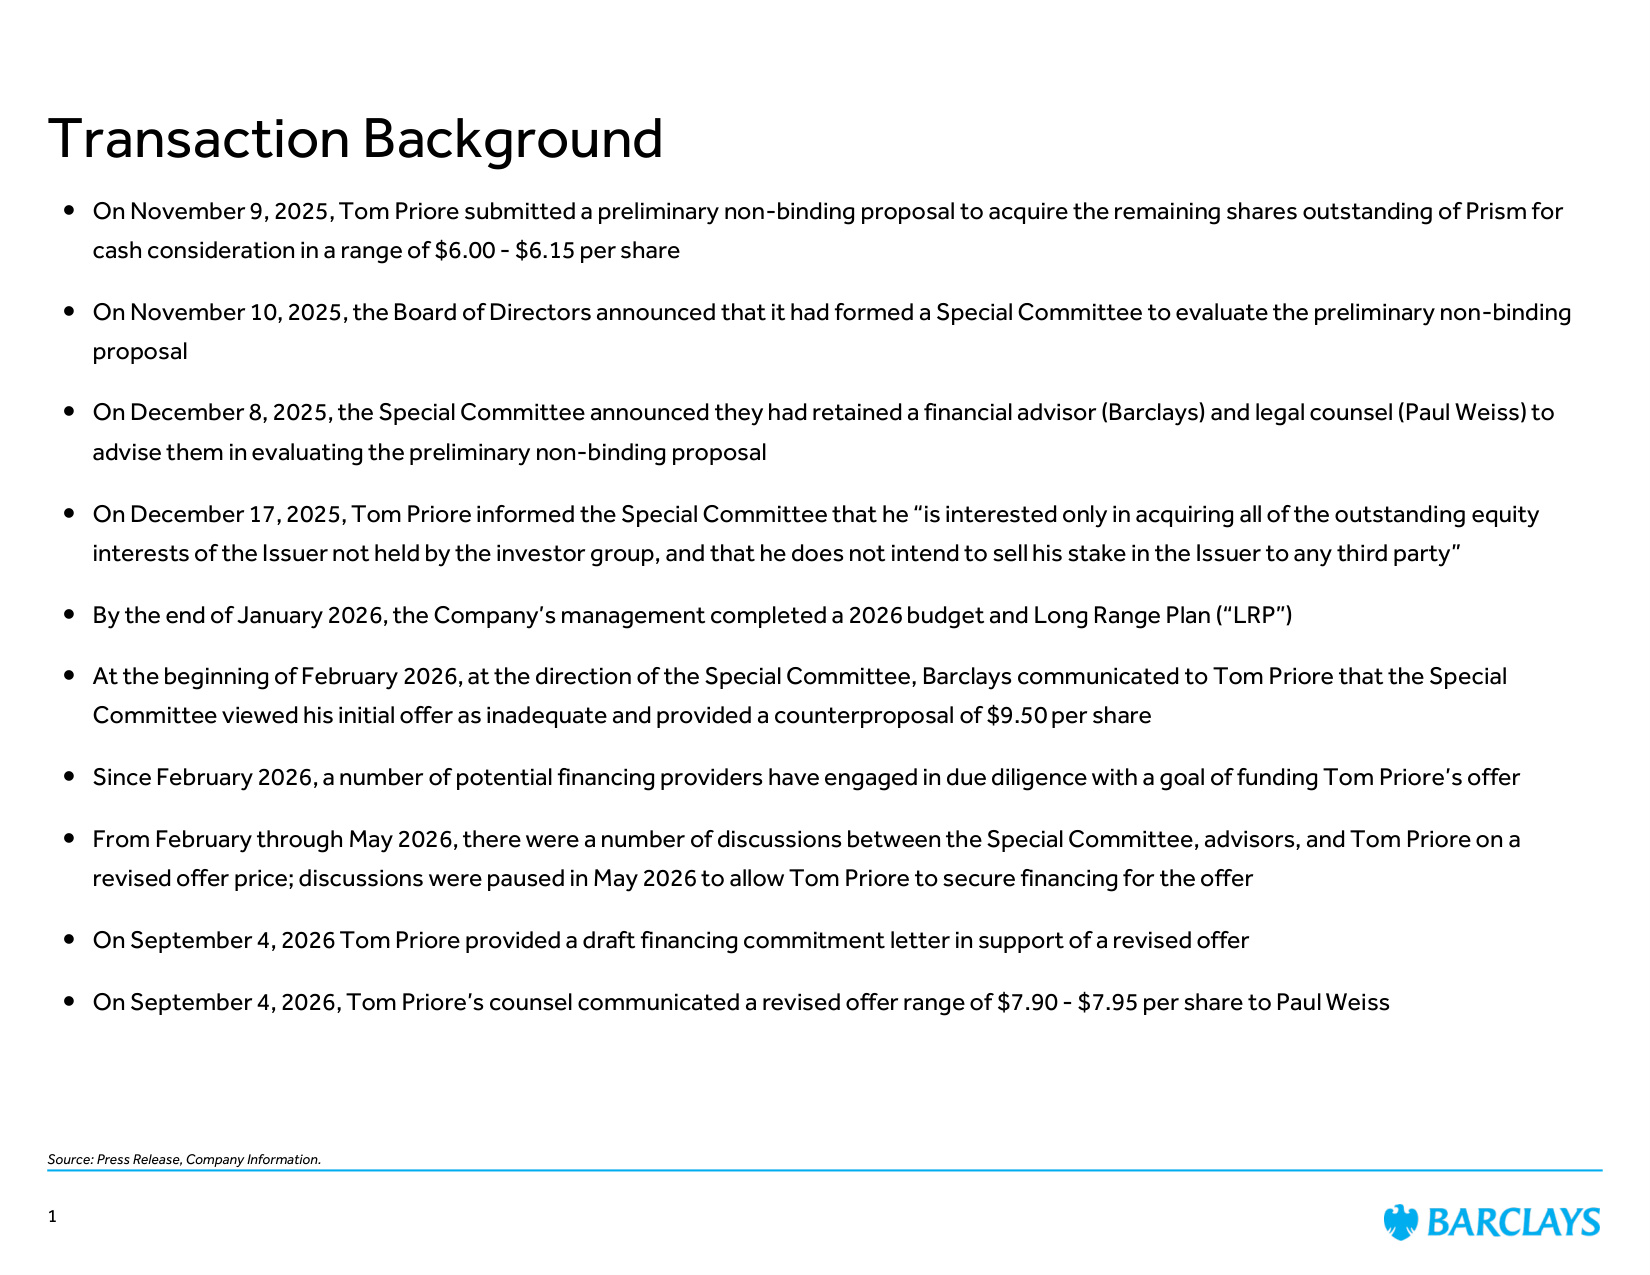
Source: Press Release, Company Information. Transaction Background On November 9, 2025, Tom Priore submitted a preliminary non-binding proposal to acquire the remaining shares outstanding of Prism for cash consideration in a range of $6.00 - $6.15 per share On November 10, 2025, the Board of Directors announced that it had formed a Special Committee to evaluate the preliminary non-binding proposal On December 8, 2025, the Special Committee announced they had retained a financial advisor (Barclays) and legal counsel (Paul Weiss) to advise them in evaluating the preliminary non-binding proposal On December 17, 2025, Tom Priore informed the Special Committee that he "is interested only in acquiring all of the outstanding equity interests of the Issuer not held by the investor group, and that he does not intend to sell his stake in the Issuer to any third party" By the end of January 2026, the Company's management completed a 2026 budget and Long Range Plan ("LRP") At the beginning of February 2026, at the direction of the Special Committee, Barclays communicated to Tom Priore that the Special Committee viewed his initial offer as inadequate and provided a counterproposal of $9.50 per share Since February 2026, a number of potential financing providers have engaged in due diligence with a goal of funding Tom Priore's offer From February through May 2026, there were a number of discussions between the Special Committee, advisors, and Tom Priore on a revised offer price; discussions were paused in May 2026 to allow Tom Priore to secure financing for the offer On September 4, 2026 Tom Priore provided a draft financing commitment letter in support of a revised offer On September 4, 2026, Tom Priore's counsel communicated a revised offer range of $7.90 - $7.95 per share to Paul Weiss 1
Contents 1. Market Backdrop and Trading Performance 2. Review of Company Financials & Forecasts 3. Valuation Perspectives 4. Appendix
Market Backdrop and Trading Performance
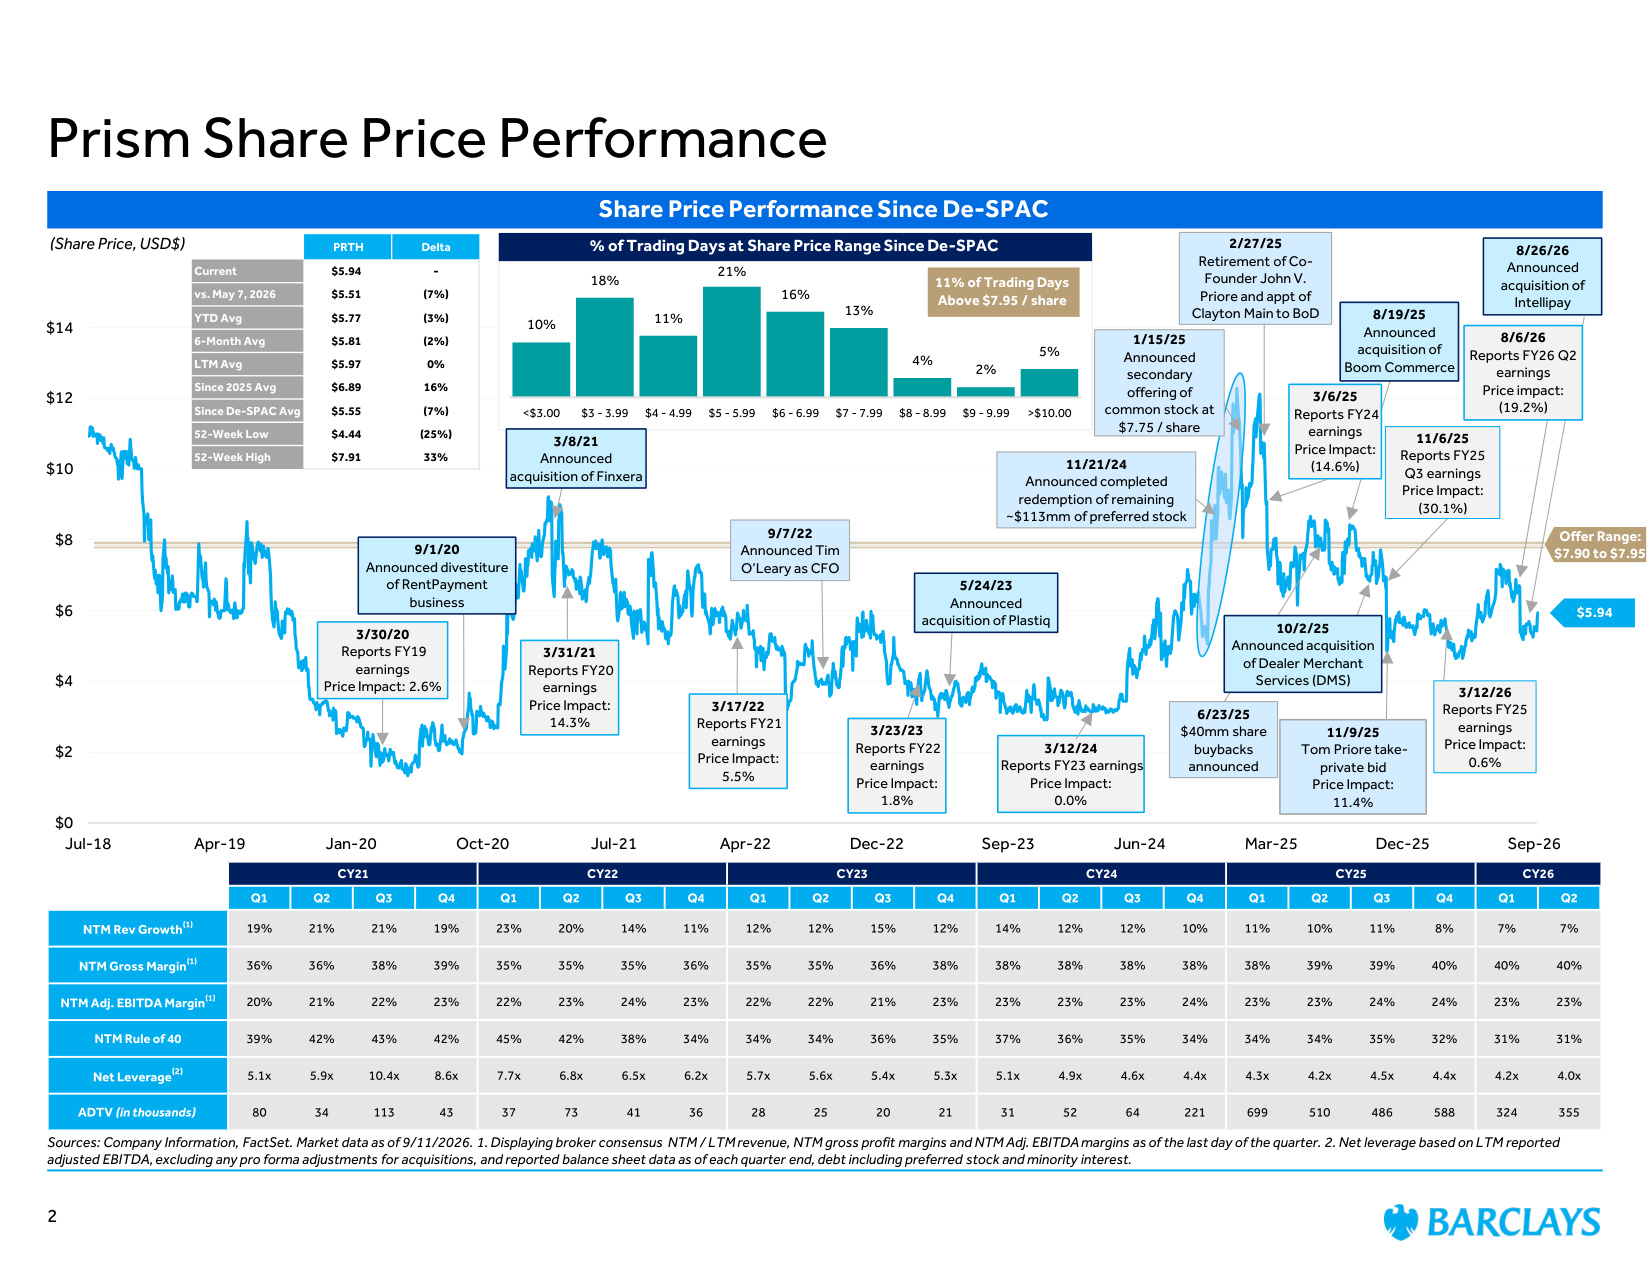
$0 $2 $4 $6 $8 $10 $12 $14 Jul-18 Apr-19 Jan-20 Oct-20 Jul-21 Apr-22 Dec-22 Sep-23 Jun-24 Mar-25 Dec-25 Sep-26 Sources: Company Information, FactSet. Market data as of 9/11/2026. 1. Displaying broker consensus NTM / LTM revenue, NTM gross profit margins and NTM Adj. EBITDA margins as of the last day of the quarter. 2. Net leverage based on LTM reported adjusted EBITDA, excluding any pro forma adjustments for acquisitions, and reported balance sheet data as of each quarter end, debt including preferred stock and minority interest. Prism Share Price Performance Share Price Performance Since De-SPAC (Share Price, USD$) 6/23/25 $40mm share buybacks announced 3/17/22 Reports FY21 earnings Price Impact: 5.5% $5.94 3/12/24 Reports FY23 earnings Price Impact: 0.0% 2/27/25 Retirement of Co- Founder John V. Priore and appt of Clayton Main to BoD Offer Range: $7.90 to $7.95 2 9/7/22 Announced Tim O'Leary as CFO 5/24/23 Announced acquisition of Plastiq 8/19/25 Announced acquisition of Boom Commerce 10/2/25 Announced acquisition of Dealer Merchant Services (DMS) 3/31/21 Reports FY20 earnings Price Impact: 14.3% PRTH Delta Current $5.94 - vs. May 7, 2026 $5.51 (7%) YTD Avg $5.77 (3%) 6-Month Avg $5.81 (2%) LTM Avg $5.97 0% Since 2025 Avg $6.89 16% Since De-SPAC Avg $5.55 (7%) 52-Week Low $4.44 (25%) 52-Week High $7.91 33% CY21 CY22 CY23 CY24 CY25 CY26 Q1 Q2 Q3 Q4 Q1 Q2 Q3 Q4 Q1 Q2 Q3 Q4 Q1 Q2 Q3 Q4 Q1 Q2 Q3 Q4 Q1 Q2 NTM Rev Growth(1) 19% 21% 21% 19% 23% 20% 14% 11% 12% 12% 15% 12% 14% 12% 12% 10% 11% 10% 11% 8% 7% 7% NTM Gross Margin(1) 36% 36% 38% 39% 35% 35% 35% 36% 35% 35% 36% 38% 38% 38% 38% 38% 38% 39% 39% 40% 40% 40% NTM Adj. EBITDA Margin(1) 20% 21% 22% 23% 22% 23% 24% 23% 22% 22% 21% 23% 23% 23% 23% 24% 23% 23% 24% 24% 23% 23% NTM Rule of 40 39% 42% 43% 42% 45% 42% 38% 34% 34% 34% 36% 35% 37% 36% 35% 34% 34% 34% 35% 32% 31% 31% Net Leverage(2) 5.1x 5.9x 10.4x 8.6x 7.7x 6.8x 6.5x 6.2x 5.7x 5.6x 5.4x 5.3x 5.1x 4.9x 4.6x 4.4x 4.3x 4.2x 4.5x 4.4x 4.2x 4.0x ADTV (in thousands) 80 34 113 43 37 73 41 36 28 25 20 21 31 52 64 221 699 510 486 588 324 355 3/30/20 Reports FY19 earnings Price Impact: 2.6% 9/1/20 Announced divestiture of RentPayment business 10% 18% 11% 21% 16% 13% 4% 2% 5% <$3.00 $3 - 3.99 $4 - 4.99 $5 - 5.99 $6 - 6.99 $7 - 7.99 $8 - 8.99 $9 - 9.99 >$10.00 % of Trading Days at Share Price Range Since De-SPAC 3/6/25 Reports FY24 earnings Price Impact: (14.6%) 11/6/25 Reports FY25 Q3 earnings Price Impact: (30.1%) 11/9/25 Tom Priore take- private bid Price Impact: 11.4% 3/12/26 Reports FY25 earnings Price Impact: 0.6% 3/8/21 Announced acquisition of Finxera 1/15/25 Announced secondary offering of common stock at $7.75 / share 11/21/24 Announced completed redemption of remaining ~$113mm of preferred stock 11% of Trading Days Above $7.95 / share 8/26/26 Announced acquisition of Intellipay 8/6/26 Reports FY26 Q2 earnings Price impact: (19.2%) 3/23/23 Reports FY22 earnings Price Impact: 1.8%
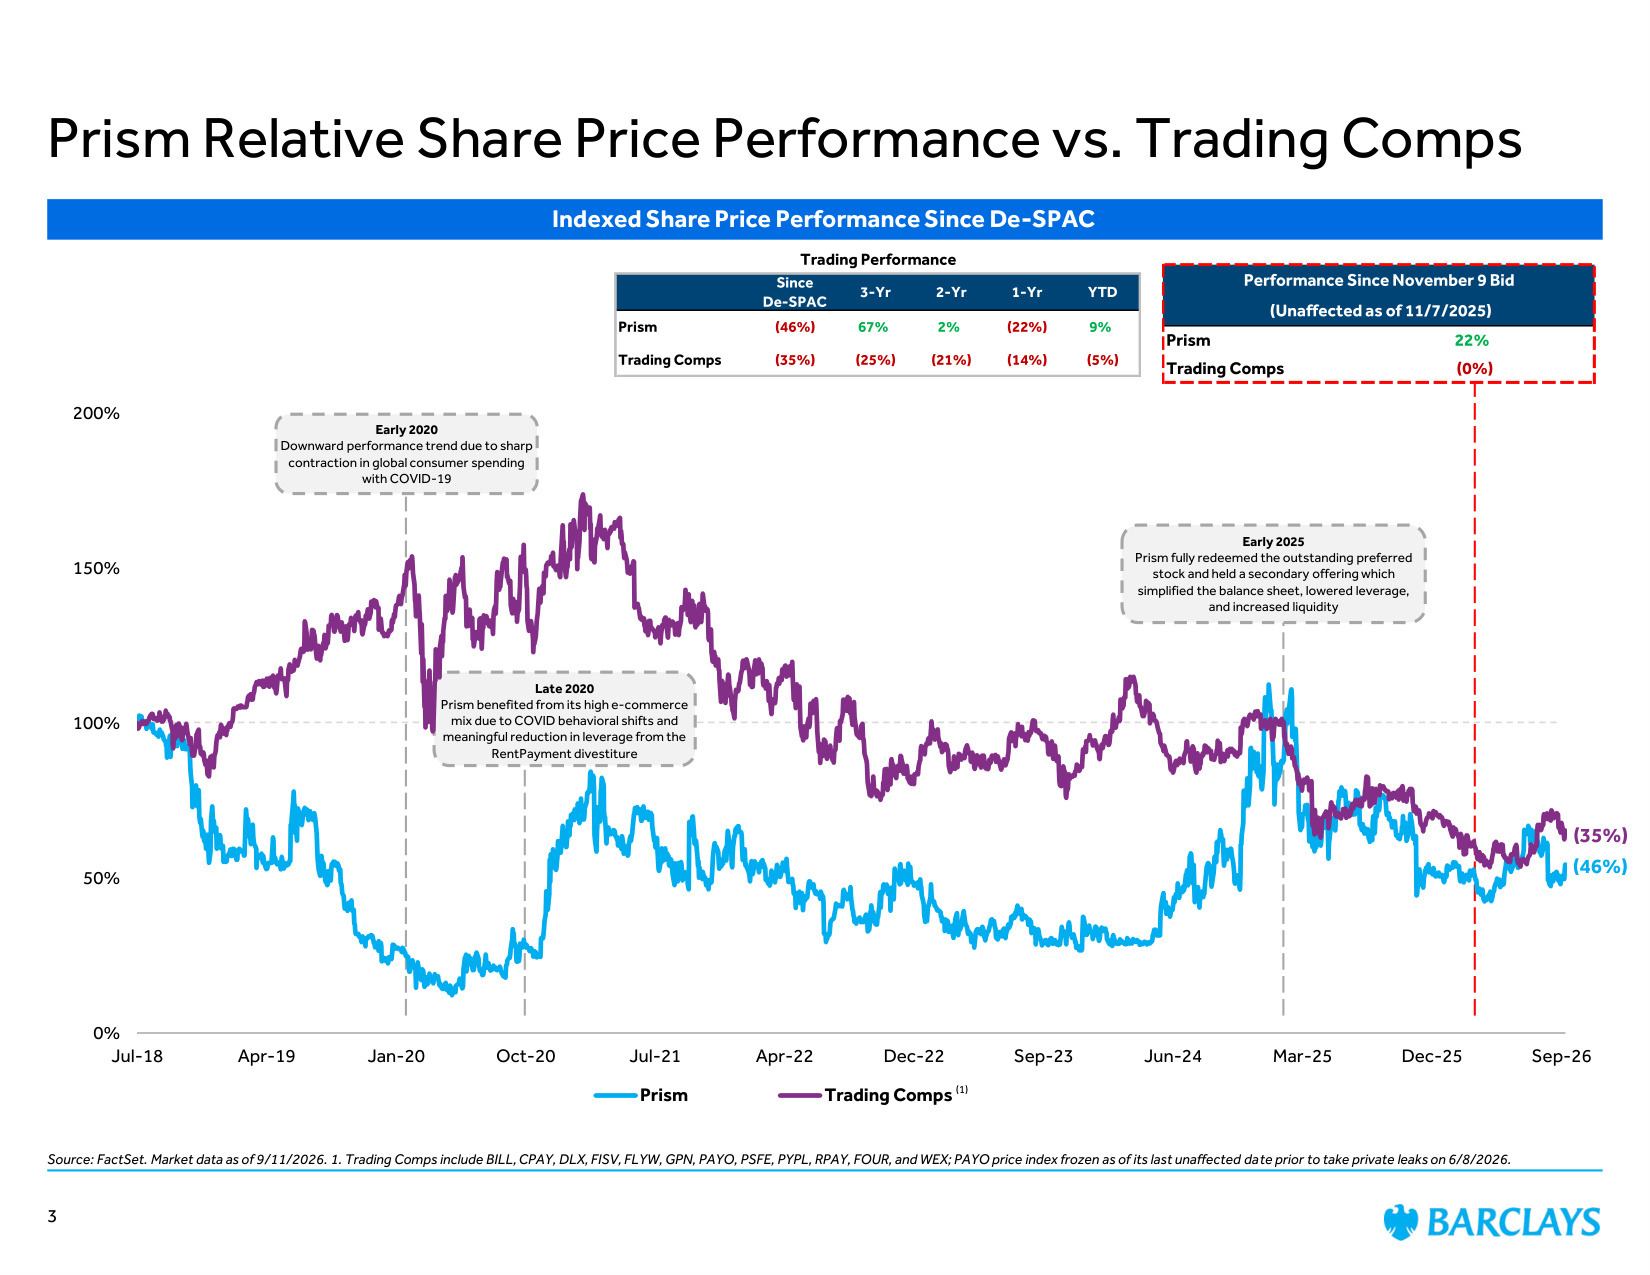
Indexed Share Price Performance Since De-SPAC (35%) (46%) (1) Performance Since November 9 Bid (Unaffected as of 11/7/2025) Prism 22% Trading Comps (0%) Trading Performance Since De-SPAC 3-Yr 2-Yr 1-Yr YTD Prism (46%) 67% 2% (22%) 9% Trading Comps (35%) (25%) (21%) (14%) (5%) Prism Relative Share Price Performance vs. Trading Comps Source: FactSet. Market data as of 9/11/2026. 1. Trading Comps include BILL, CPAY, DLX, FISV, FLYW, GPN, PAYO, PSFE, PYPL, RPAY, FOUR, and WEX; PAYO price index frozen as of its last unaffected date prior to take private leaks on 6/8/2026. Early 2020 Downward performance trend due to sharp contraction in global consumer spending with COVID-19 Early 2025 Prism fully redeemed the outstanding preferred stock and held a secondary offering which simplified the balance sheet, lowered leverage, and increased liquidity Late 2020 Prism benefited from its high e-commerce mix due to COVID behavioral shifts and meaningful reduction in leverage from the RentPayment divestiture 0% 50% 100% 150% 200% Jul-18 Apr-19 Jan-20 Oct-20 Jul-21 Apr-22 Dec-22 Sep-23 Jun-24 Mar-25 Dec-25 Sep-26 Prism Trading Comps 3
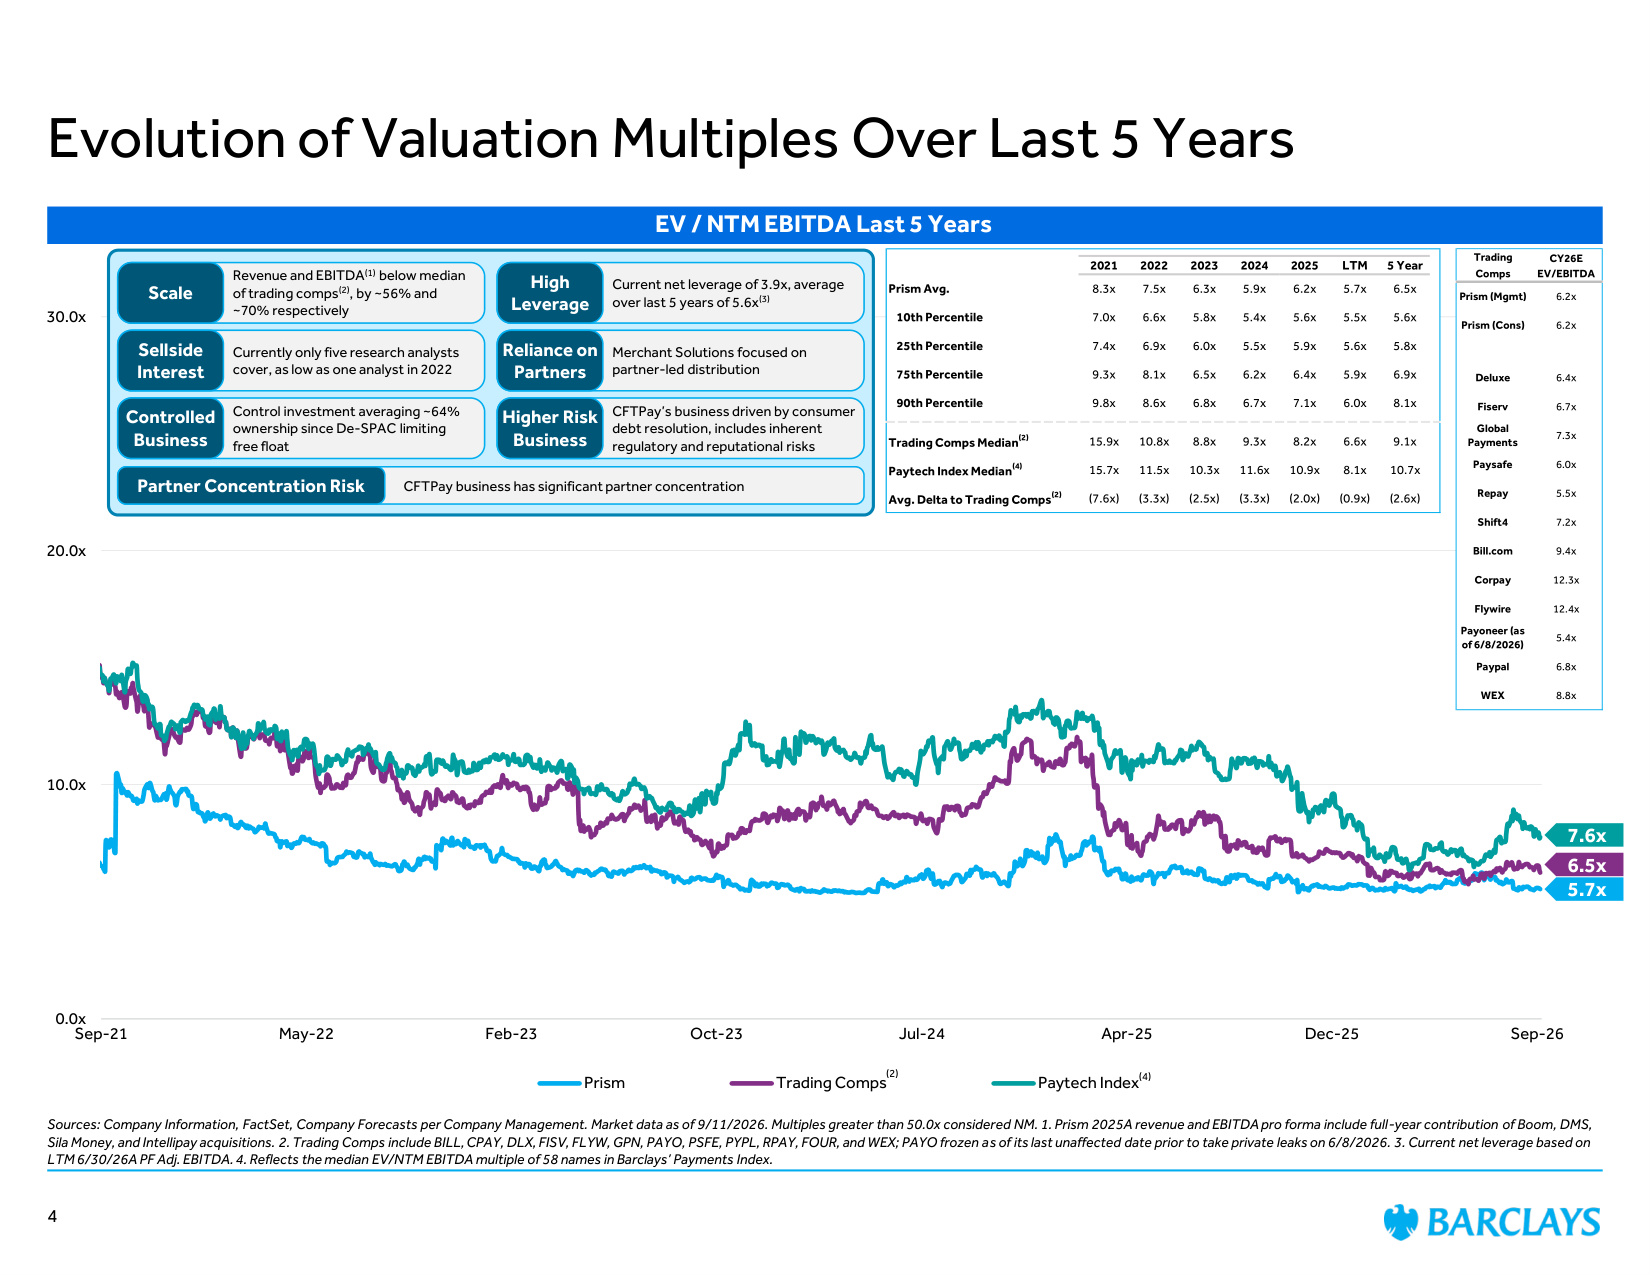
Sources: Company Information, FactSet, Company Forecasts per Company Management. Market data as of 9/11/2026. Multiples greater than 50.0x considered NM. 1. Prism 2025A revenue and EBITDA pro forma include full-year contribution of Boom, DMS, Sila Money, and Intellipay acquisitions. 2. Trading Comps include BILL, CPAY, DLX, FISV, FLYW, GPN, PAYO, PSFE, PYPL, RPAY, FOUR, and WEX; PAYO frozen as of its last unaffected date prior to take private leaks on 6/8/2026. 3. Current net leverage based on LTM 6/30/26A PF Adj. EBITDA. 4. Reflects the median EV/NTM EBITDA multiple of 58 names in Barclays' Payments Index. Evolution of Valuation Multiples Over Last 5 Years 5.7x (2) 6.5x 7.6x (4) 4 0.0x 10.0x 20.0x 30.0x Sep-21 May-22 Feb-23 Oct-23 Jul-24 Apr-25 Dec-25 Sep-26 Prism Trading Comps Paytech Index EV / NTM EBITDA Last 5 Years 2021 2022 2023 2024 2025 LTM 5 Year Prism Avg. 8.3x 7.5x 6.3x 5.9x 6.2x 5.7x 6.5x 10th Percentile 7.0x 6.6x 5.8x 5.4x 5.6x 5.5x 5.6x 25th Percentile 7.4x 6.9x 6.0x 5.5x 5.9x 5.6x 5.8x 75th Percentile 9.3x 8.1x 6.5x 6.2x 6.4x 5.9x 6.9x 90th Percentile 9.8x 8.6x 6.8x 6.7x 7.1x 6.0x 8.1x Trading Comps Median(2) 15.9x 10.8x 8.8x 9.3x 8.2x 6.6x 9.1x Paytech Index Median(4) 15.7x 11.5x 10.3x 11.6x 10.9x 8.1x 10.7x Avg. Delta to Trading Comps(2) (7.6x) (3.3x) (2.5x) (3.3x) (2.0x) (0.9x) (2.6x) Control investment averaging ~64% ownership since De-SPAC limiting free float Controlled Business Current net leverage of 3.9x, average over last 5 years of 5.6x(3) High Leverage Currently only five research analysts cover, as low as one analyst in 2022 Sellside Interest Merchant Solutions focused on partner-led distribution Reliance on Partners Revenue and EBITDA(1) below median of trading comps(2), by ~56% and ~70% respectively Scale CFTPay's business driven by consumer debt resolution, includes inherent regulatory and reputational risks Higher Risk Business CFTPay business has significant partner concentration Partner Concentration Risk Trading CY26E Comps EV/EBITDA Prism (Mgmt) 6.2x Prism (Cons) 6.2x Deluxe 6.4x Fiserv 6.7x Global Payments 7.3x Paysafe 6.0x Repay 5.5x Shift4 7.2x Bill.com 9.4x Corpay 12.3x Flywire 12.4x Payoneer (as of 6/8/2026) 5.4x Paypal 6.8x WEX 8.8x
Review of Company Financials & Forecasts
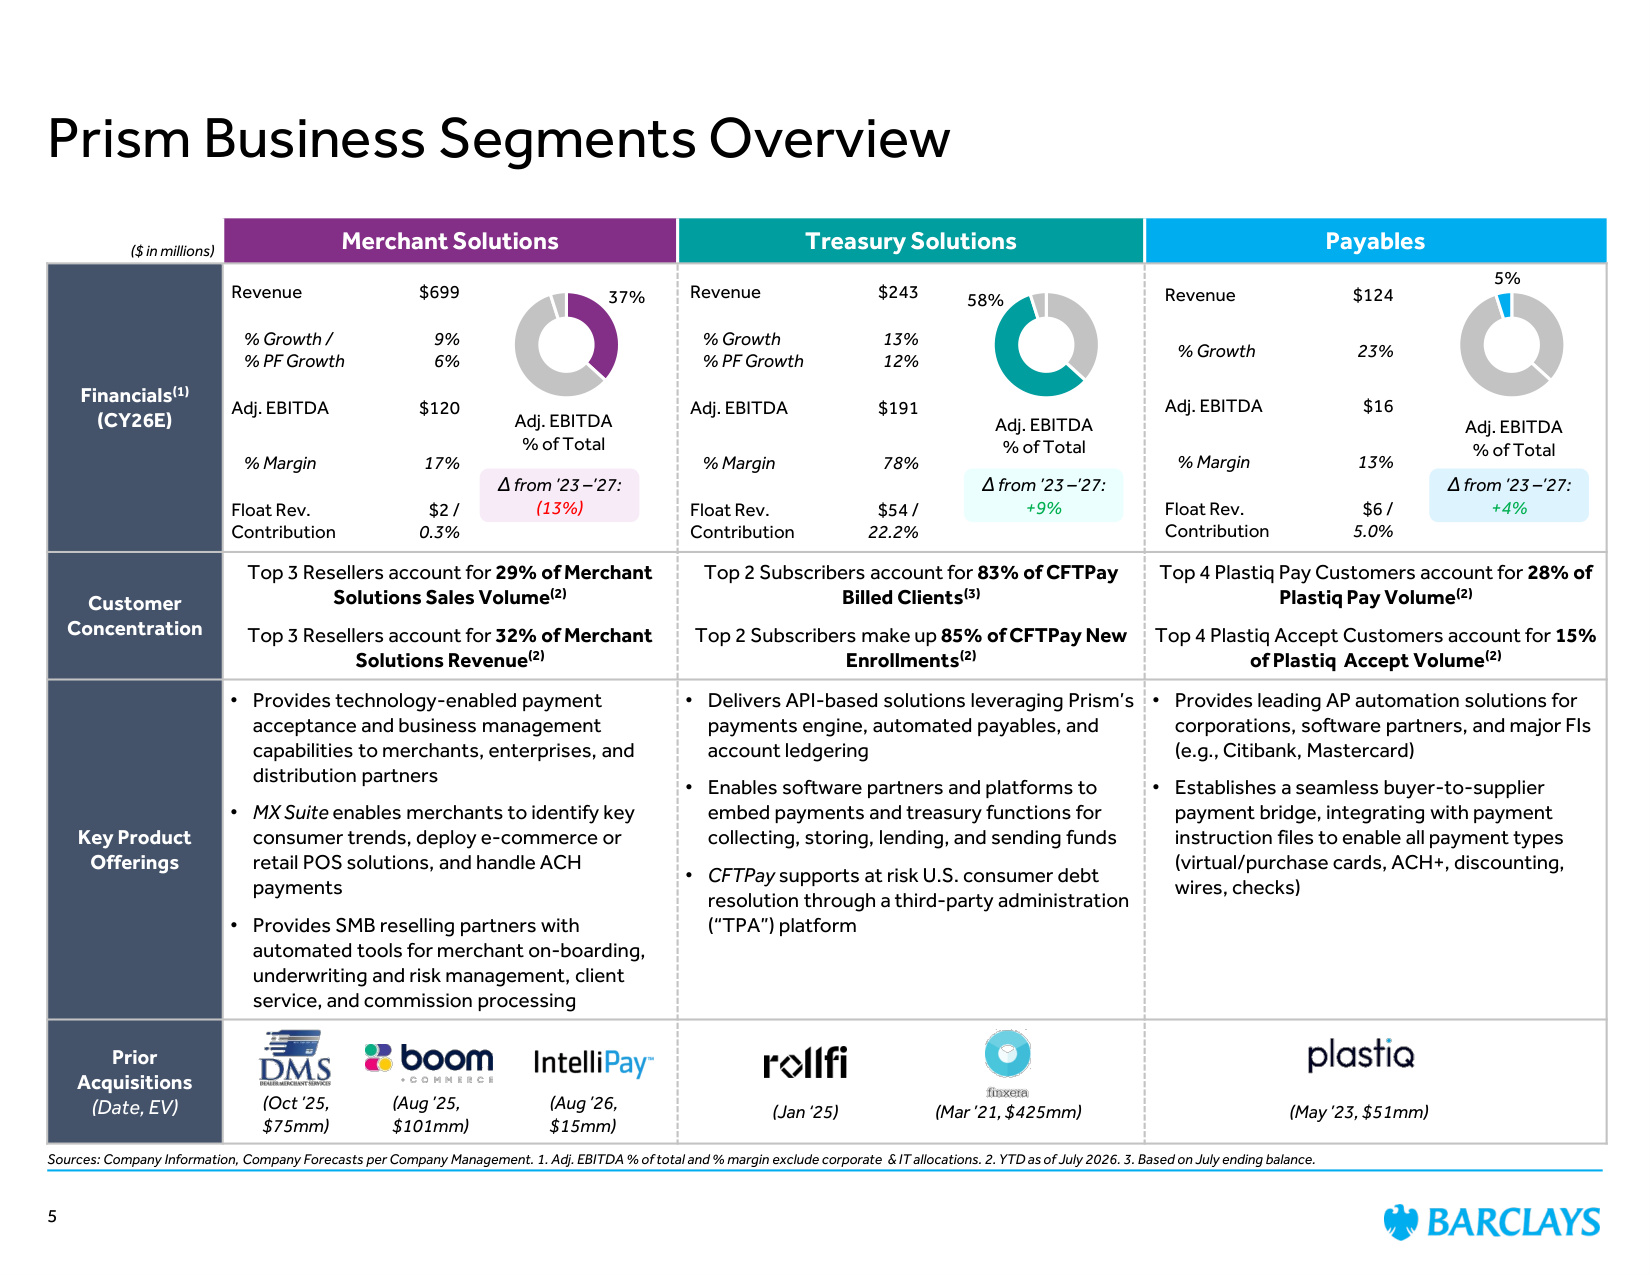
Prism Business Segments Overview Sources: Company Information, Company Forecasts per Company Management. 1. Adj. EBITDA % of total and % margin exclude corporate & IT allocations. 2. YTD as of July 2026. 3. Based on July ending balance. Merchant Solutions Treasury Solutions Payables Financials(1) (CY26E) Customer Concentration Top 3 Resellers account for 29% of Merchant Solutions Sales Volume(2) Top 3 Resellers account for 32% of Merchant Solutions Revenue(2) Top 2 Subscribers account for 83% of CFTPay Billed Clients(3) Top 2 Subscribers make up 85% of CFTPay New Enrollments(2) Top 4 Plastiq Pay Customers account for 28% of Plastiq Pay Volume(2) Top 4 Plastiq Accept Customers account for 15% of Plastiq Accept Volume(2) Key Product Offerings • Provides technology-enabled payment acceptance and business management capabilities to merchants, enterprises, and distribution partners • MX Suite enables merchants to identify key consumer trends, deploy e-commerce or retail POS solutions, and handle ACH payments • Provides SMB reselling partners with automated tools for merchant on-boarding, underwriting and risk management, client service, and commission processing • Delivers API-based solutions leveraging Prism's payments engine, automated payables, and account ledgering • Enables software partners and platforms to embed payments and treasury functions for collecting, storing, lending, and sending funds • CFTPay supports at risk U.S. consumer debt resolution through a third-party administration ("TPA") platform • Provides leading AP automation solutions for corporations, software partners, and major FIs (e.g., Citibank, Mastercard) • Establishes a seamless buyer-to-supplier payment bridge, integrating with payment instruction files to enable all payment types (virtual/purchase cards, ACH+, discounting, wires, checks) Prior Acquisitions (Date, EV) ($ in millions) 5 (Oct '25, $75mm) (Aug '25, $101mm) (Jan '25) (Mar '21, $425mm) (May '23, $51mm) 37% 58% 5% Adj. EBITDA % of Total Adj. EBITDA % of Total Adj. EBITDA % of Total Revenue $699 % Growth / % PF Growth 9% 6% Adj. EBITDA $120 % Margin 17% Float Rev. Contribution $2 / 0.3% Revenue $243 % Growth % PF Growth 13% 12% Adj. EBITDA $191 % Margin 78% Float Rev. Contribution $54 / 22.2% Revenue $124 % Growth 23% Adj. EBITDA $16 % Margin 13% Float Rev. Contribution $6 / 5.0% Δ from '23 –'27: (13%) Δ from '23 –'27: +9% Δ from '23 –'27: +4% (Aug '26, $15mm)
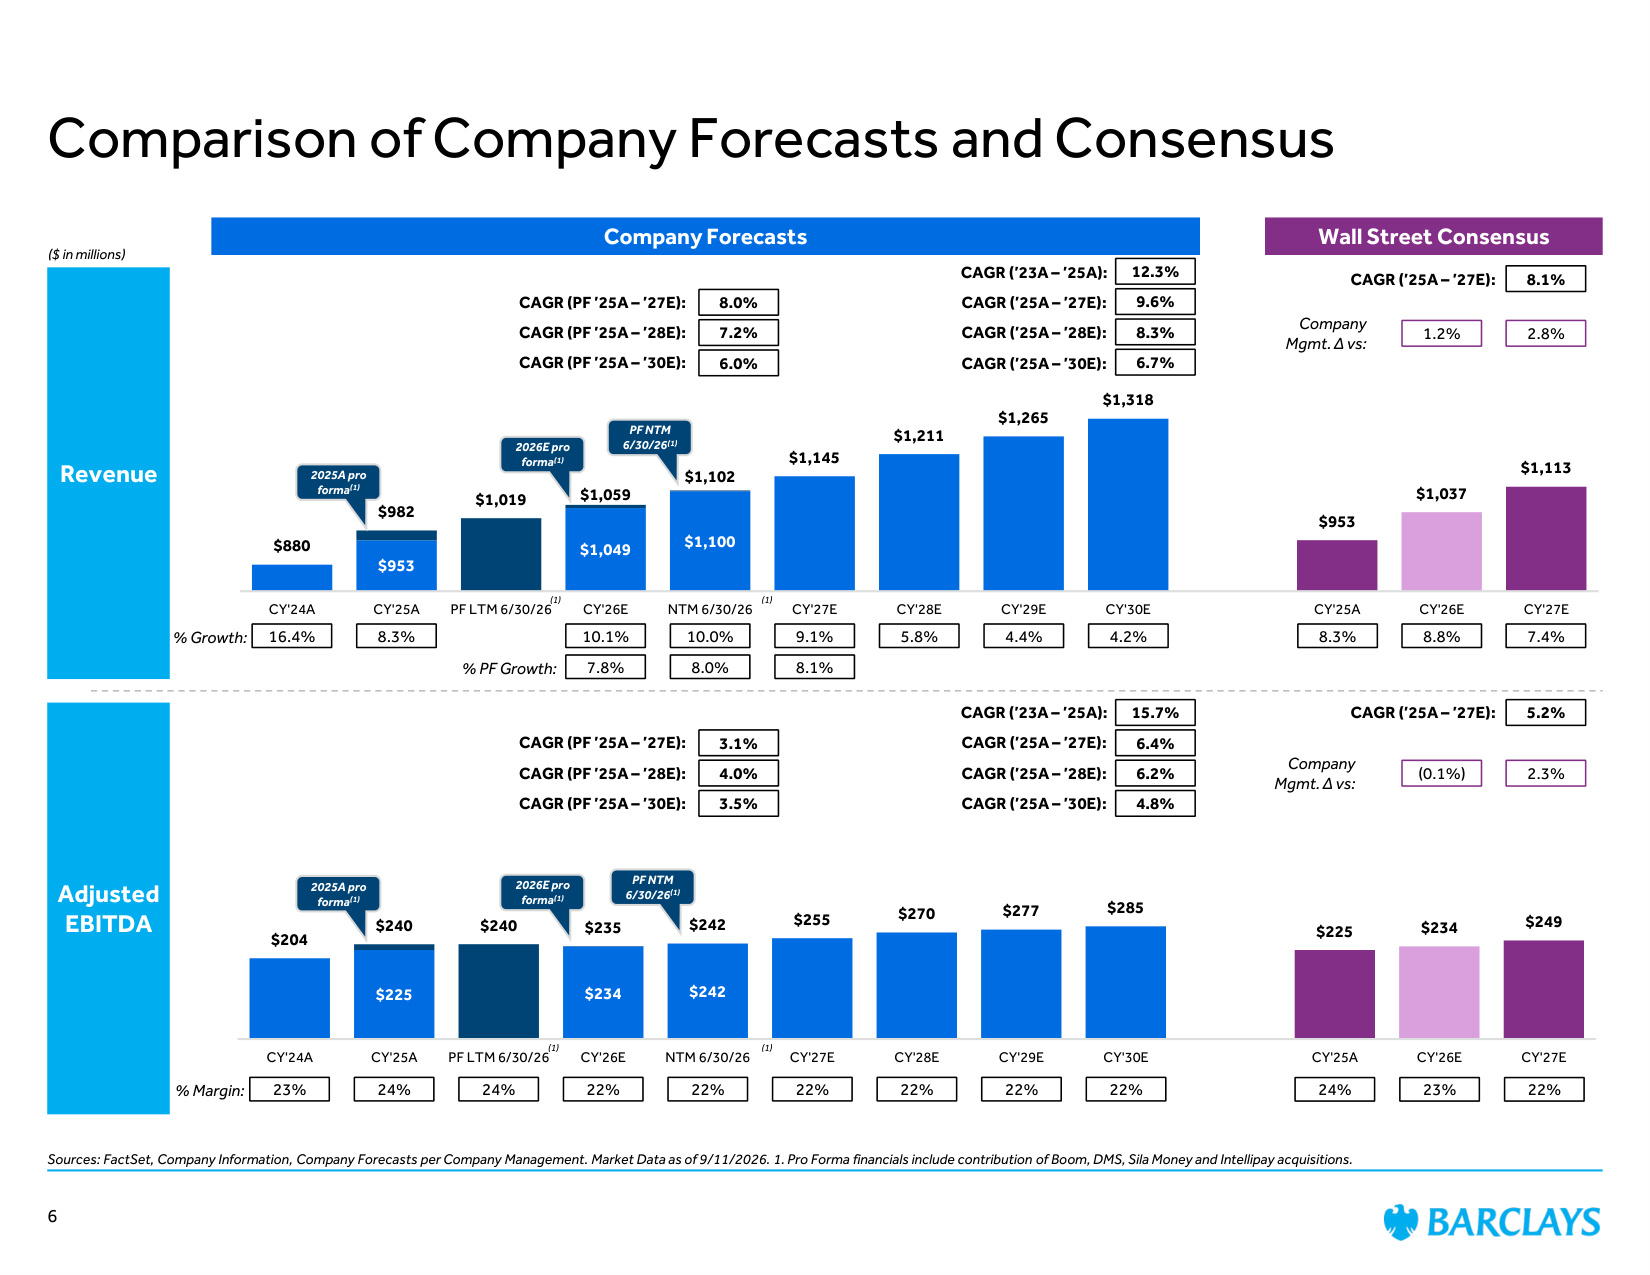
$225 $234 $242 $204 $240 $242 $255 $270 $277 $285 $225 $234 $249 $240 $235 CY'24A CY'25A PF LTM 6/30/26 CY'26E NTM 6/30/26 CY'27E CY'28E CY'29E CY'30E CY'25A CY'26E CY'27E $953 $1,049 $1,100 $880 $1,019 $1,145 $1,211 $1,265 $1,318 $953 $1,037 $1,113 $982 $1,059 $1,102 CY'24A CY'25A PF LTM 6/30/26 CY'26E NTM 6/30/26 CY'27E CY'28E CY'29E CY'30E CY'25A CY'26E CY'27E Revenue ($ in millions) Adjusted EBITDA % Growth: % Margin: 4.2% 24% 22% 23% 9.1% 5.8% 22% 22% 22% Company Forecasts Wall Street Consensus 8.1% CAGR ('25A – '27E): 22% 8.8% 7.4% 8.3% 10.1% 5.2% CAGR ('25A – '27E): 8.3% 23% 4.4% 22% Comparison of Company Forecasts and Consensus Sources: FactSet, Company Information, Company Forecasts per Company Management. Market Data as of 9/11/2026. 1. Pro Forma financials include contribution of Boom, DMS, Sila Money and Intellipay acquisitions. 16.4% 24% 12.3% 9.6% 8.3% 6.7% 15.7% 6.4% CAGR ('23A – '25A): CAGR ('25A – '27E): CAGR ('25A – '28E): CAGR ('25A – '30E): 6.2% 4.8% 1.2% 2.8% (0.1%) 2.3% Company Mgmt. Δ vs: 2025A pro forma(1) % PF Growth: 7.8% 8.0% CAGR (PF '25A – '27E): CAGR (PF '25A – '28E): CAGR (PF '25A – '30E): 7.2% 6.0% 3.1% CAGR (PF '25A – '27E): CAGR (PF '25A – '28E): CAGR (PF '25A – '30E): 4.0% 3.5% 2025A pro forma(1) CAGR ('23A – '25A): CAGR ('25A – '27E): CAGR ('25A – '28E): CAGR ('25A – '30E): 6 10.0% 8.0% Company Mgmt. Δ vs: 24% 22% (1) (1) 2026E pro forma(1) 8.1% 2026E pro forma(1) PF NTM 6/30/26(1) PF NTM 6/30/26(1) (1) (1)
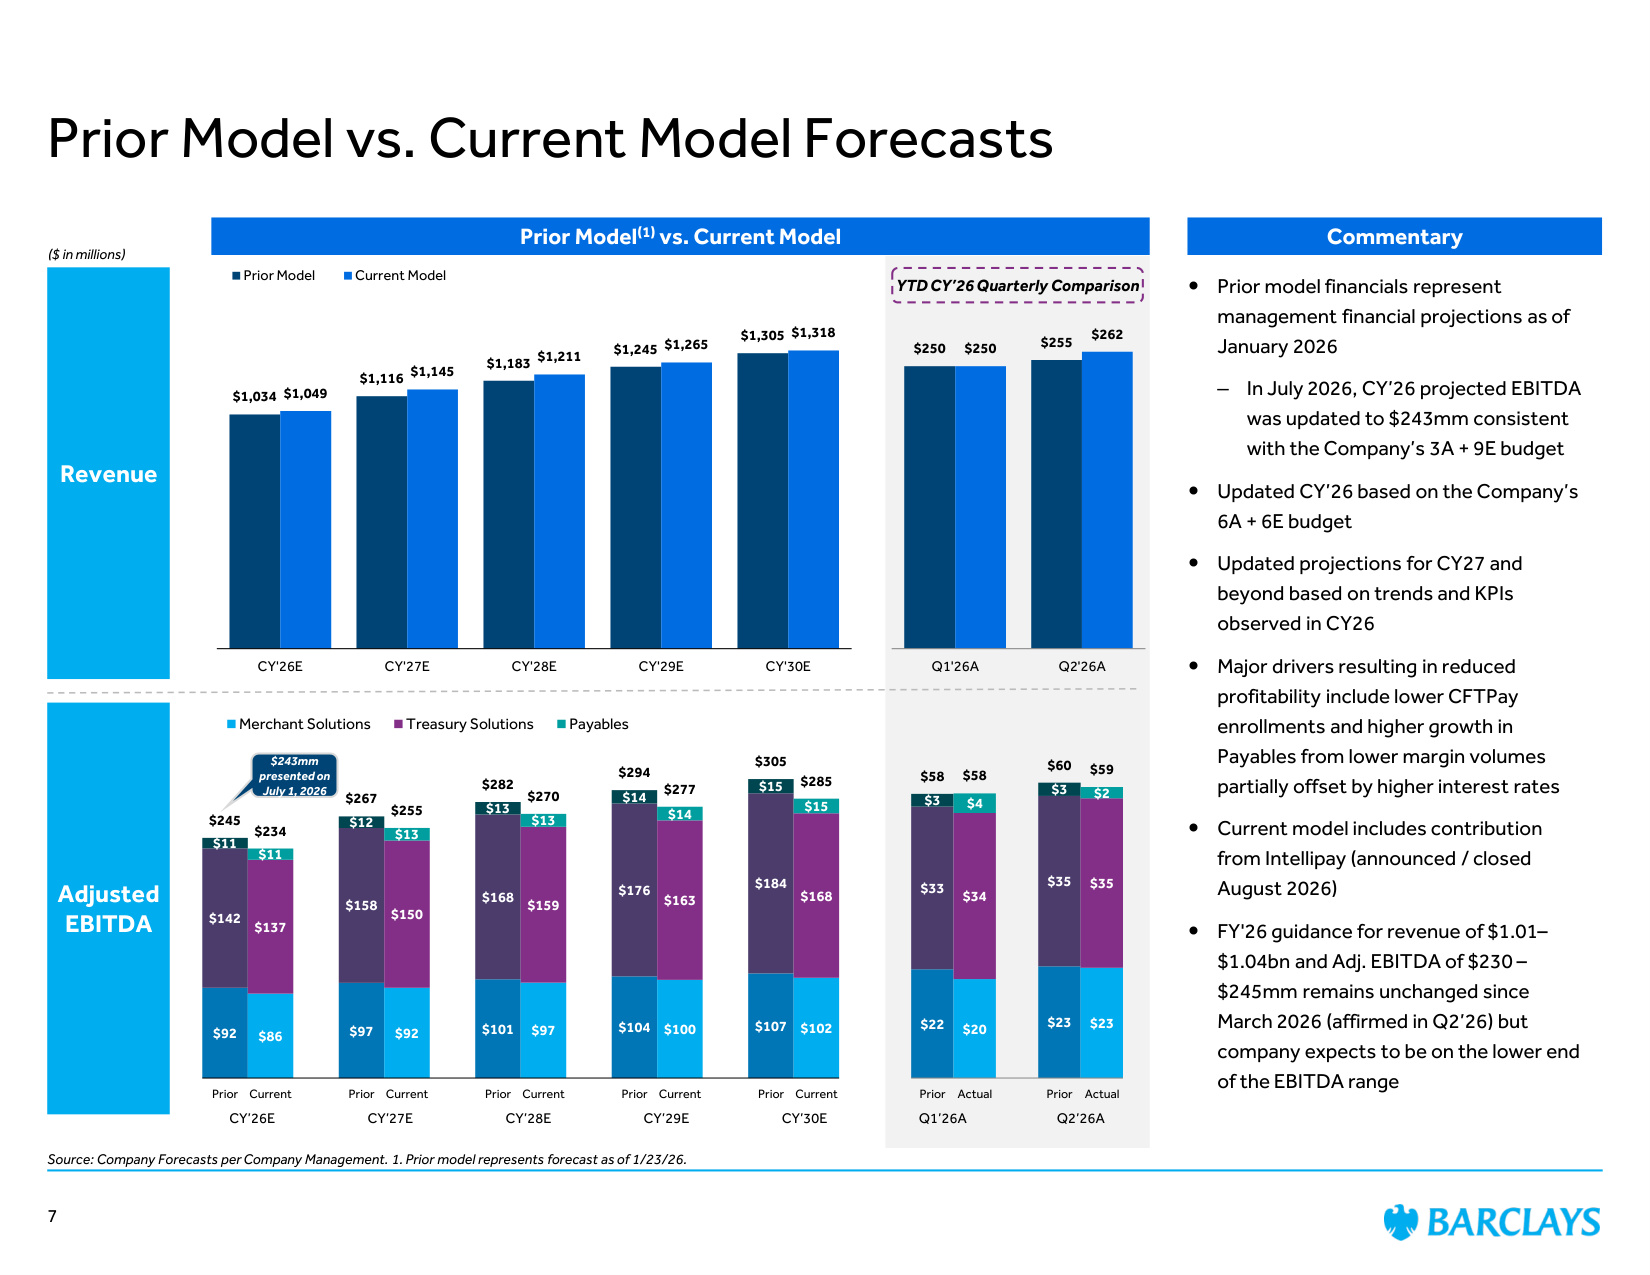
Prior Model(1) vs. Current Model Revenue Adjusted EBITDA Prior Model vs. Current Model Forecasts Commentary Prior model financials represent management financial projections as of January 2026 – In July 2026, CY'26 projected EBITDA was updated to $243mm consistent with the Company's 3A + 9E budget Updated CY'26 based on the Company's 6A + 6E budget Updated projections for CY27 and beyond based on trends and KPIs observed in CY26 Major drivers resulting in reduced profitability include lower CFTPay enrollments and higher growth in Payables from lower margin volumes partially offset by higher interest rates Current model includes contribution from Intellipay (announced / closed August 2026) FY'26 guidance for revenue of $1.01– $1.04bn and Adj. EBITDA of $230 – $245mm remains unchanged since March 2026 (affirmed in Q2'26) but company expects to be on the lower end of the EBITDA range $1,034 $1,116 $1,183 $1,245 $1,305 $1,049 $1,145 $1,211 $1,265 $1,318 CY'26E CY'27E CY'28E CY'29E CY'30E Prior Model Current Model $92 $86 $97 $92 $101 $97 $104 $100 $107 $102 $142 $137 $158 $150 $168 $159 $176 $163 $184 $168 $11 $11 $12 $13 $13 $13 $14 $14 $15 $15 $245 $234 $267 $255 $282 $270 $294 $277 $305 $285 Prior Current Prior Current Prior Current Prior Current Prior Current Merchant Solutions Treasury Solutions Payables YTD CY'26 Quarterly Comparison CY'26E CY'27E CY'28E CY'29E CY'30E Q1'26A Q2'26A $243mm presented on July 1, 2026 ($ in millions) $250 $255 $250 $262 Q1'26A Q2'26A $22 $20 $23 $23 $33 $34 $35 $35 $3 $4 $3 $2 $58 $58 $60 $59 Prior Actual Prior Actual 7 Source: Company Forecasts per Company Management. 1. Prior model represents forecast as of 1/23/26.

Valuation Perspectives
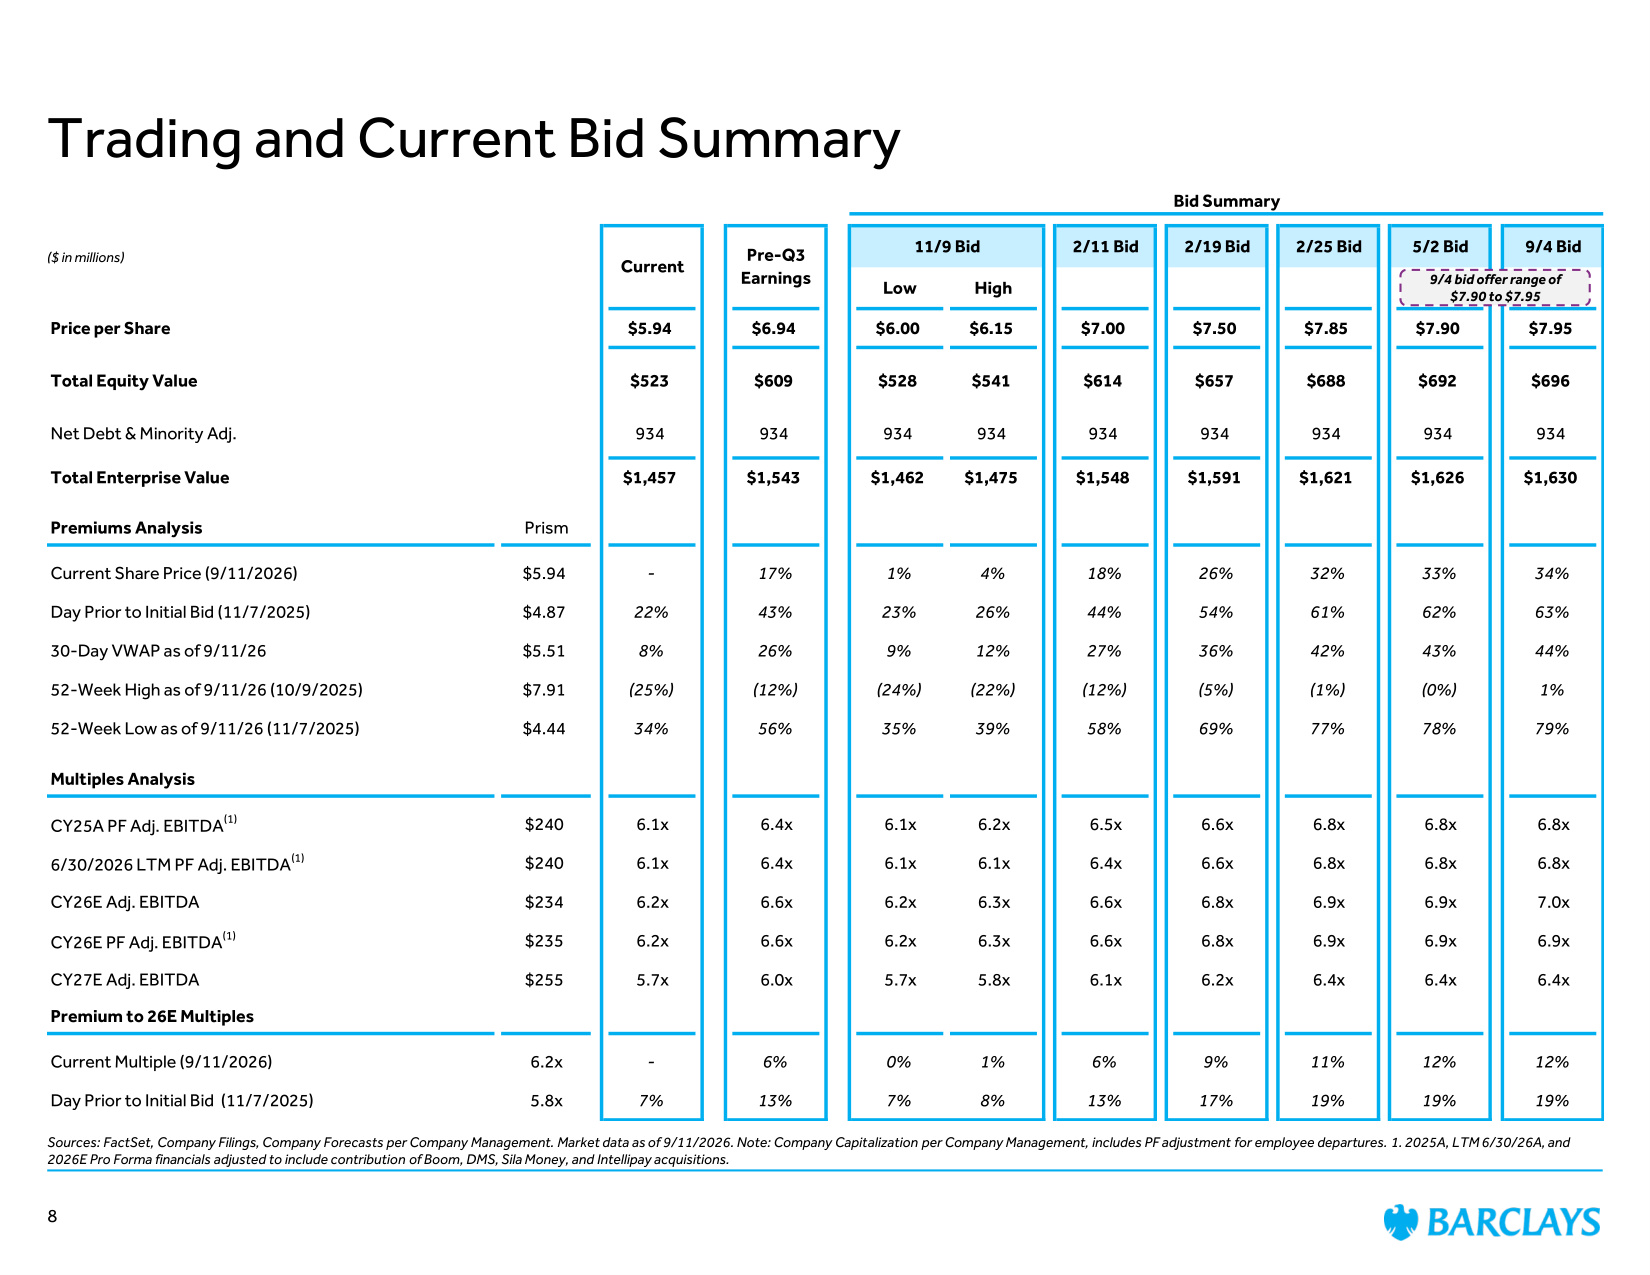
Trading and Current Bid Summary Sources: FactSet, Company Filings, Company Forecasts per Company Management. Market data as of 9/11/2026. Note: Company Capitalization per Company Management, includes PF adjustment for employee departures. 1. 2025A, LTM 6/30/26A, and 2026E Pro Forma financials adjusted to include contribution of Boom, DMS, Sila Money, and Intellipay acquisitions. Bid Summary 11/9 Bid 2/11 Bid 2/19 Bid 2/25 Bid 5/2 Bid 9/4 Bid Low High Price per Share $5.94 $6.94 $6.00 $6.15 $7.00 $7.50 $7.85 $7.90 $7.95 Total Equity Value $523 $609 $528 $541 $614 $657 $688 $692 $696 Net Debt & Minority Adj. 934 934 934 934 934 934 934 934 934 Total Enterprise Value $1,457 $1,543 $1,462 $1,475 $1,548 $1,591 $1,621 $1,626 $1,630 Premiums Analysis Prism Current Share Price (9/11/2026) $5.94 - 17% 1% 4% 18% 26% 32% 33% 34% Day Prior to Initial Bid (11/7/2025) $4.87 22% 43% 23% 26% 44% 54% 61% 62% 63% 30-Day VWAP as of 9/11/26 $5.51 8% 26% 9% 12% 27% 36% 42% 43% 44% 52-Week High as of 9/11/26 (10/9/2025) $7.91 (25%) (12%) (24%) (22%) (12%) (5%) (1%) (0%) 1% 52-Week Low as of 9/11/26 (11/7/2025) $4.44 34% 56% 35% 39% 58% 69% 77% 78% 79% Multiples Analysis CY25A PF Adj. EBITDA(1) $240 6.1x 6.4x 6.1x 6.2x 6.5x 6.6x 6.8x 6.8x 6.8x 6/30/2026 LTM PF Adj. EBITDA(1) $240 6.1x 6.4x 6.1x 6.1x 6.4x 6.6x 6.8x 6.8x 6.8x CY26E Adj. EBITDA $234 6.2x 6.6x 6.2x 6.3x 6.6x 6.8x 6.9x 6.9x 7.0x CY26E PF Adj. EBITDA(1) $235 6.2x 6.6x 6.2x 6.3x 6.6x 6.8x 6.9x 6.9x 6.9x CY27E Adj. EBITDA $255 5.7x 6.0x 5.7x 5.8x 6.1x 6.2x 6.4x 6.4x 6.4x Premium to 26E Multiples Current Multiple (9/11/2026) 6.2x - 6% 0% 1% 6% 9% 11% 12% 12% Day Prior to Initial Bid (11/7/2025) 5.8x 7% 13% 7% 8% 13% 17% 19% 19% 19% Current Pre-Q3 Earnings ($ in millions) 8 9/4 bid offer range of $7.90 to $7.95
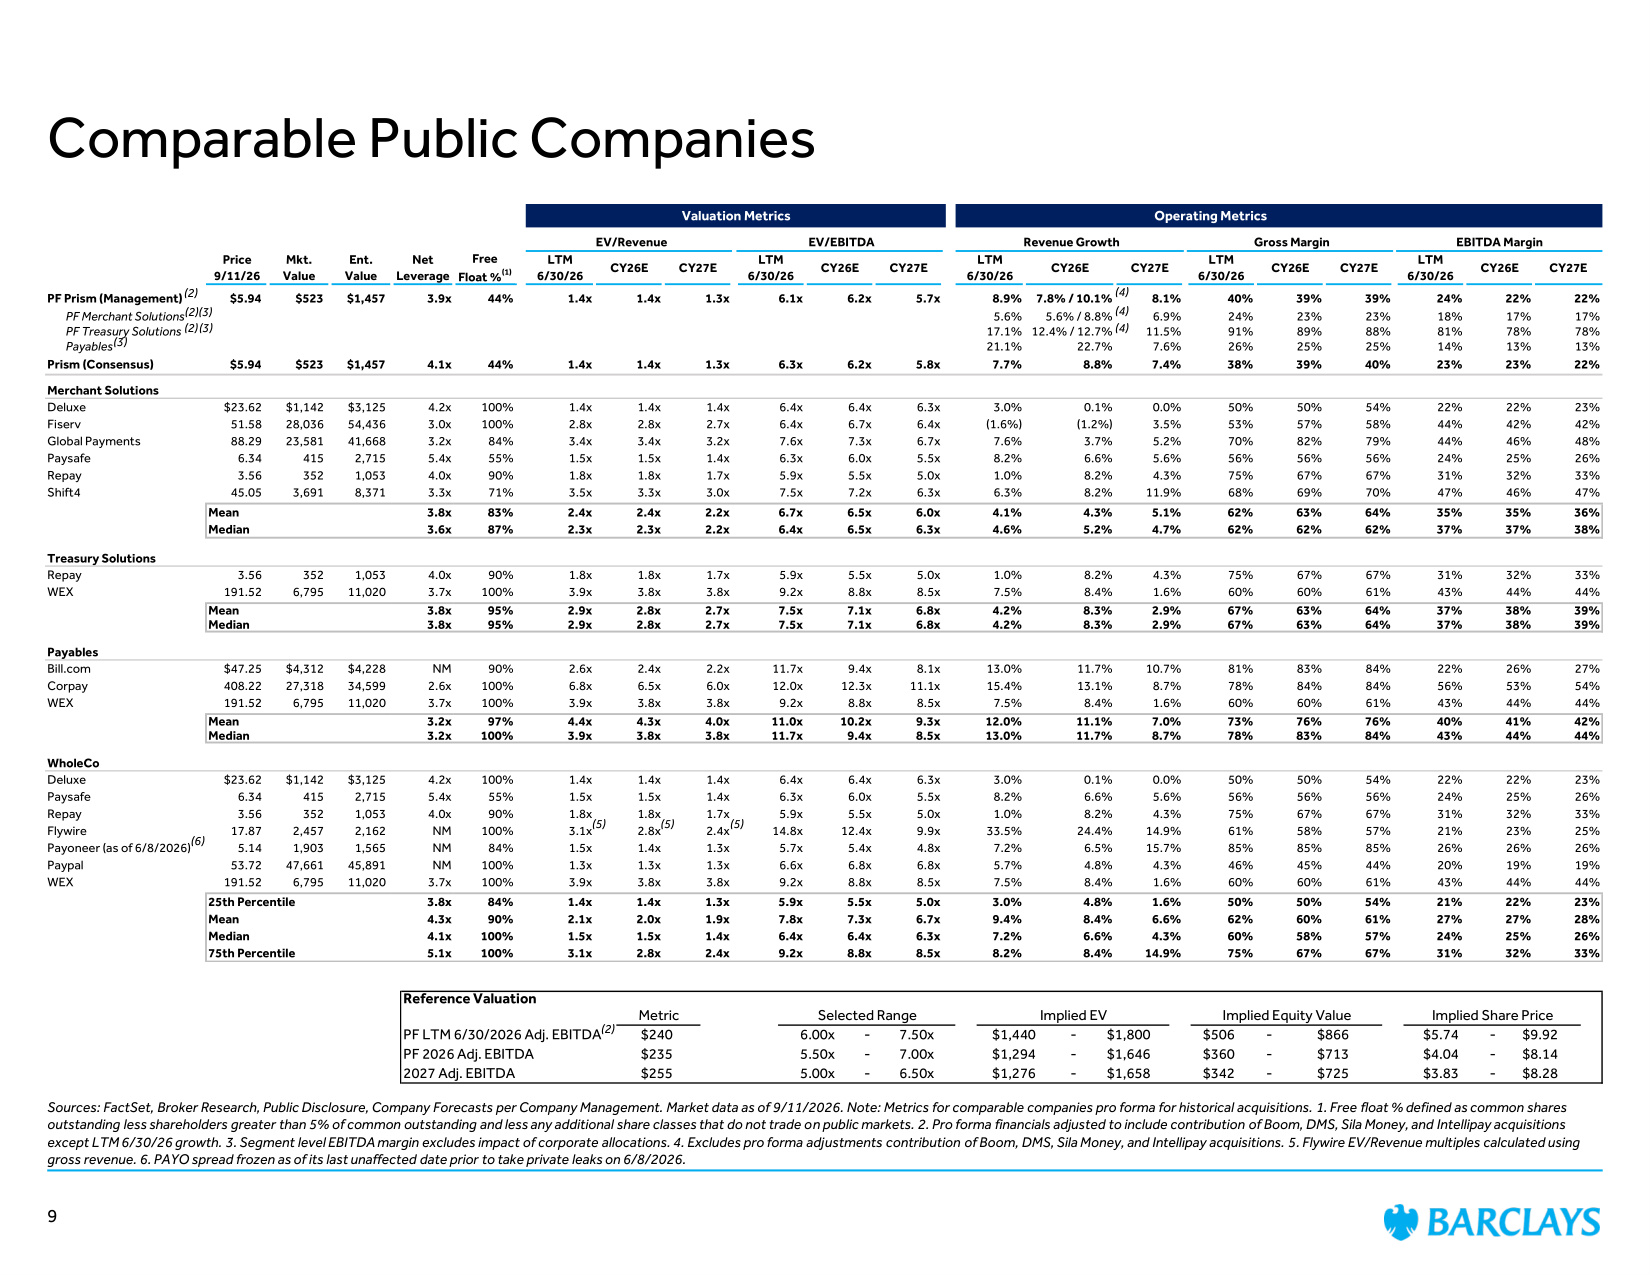
Comparable Public Companies Sources: FactSet, Broker Research, Public Disclosure, Company Forecasts per Company Management. Market data as of 9/11/2026. Note: Metrics for comparable companies pro forma for historical acquisitions. 1. Free float % defined as common shares outstanding less shareholders greater than 5% of common outstanding and less any additional share classes that do not trade on public markets. 2. Pro forma financials adjusted to include contribution of Boom, DMS, Sila Money, and Intellipay acquisitions except LTM 6/30/26 growth. 3. Segment level EBITDA margin excludes impact of corporate allocations. 4. Excludes pro forma adjustments contribution of Boom, DMS, Sila Money, and Intellipay acquisitions. 5. Flywire EV/Revenue multiples calculated using gross revenue. 6. PAYO spread frozen as of its last unaffected date prior to take private leaks on 6/8/2026. (5) (2) (2) (2) (3) (3) (3) (4) (4) (4) (5) (2) Valuation Metrics Operating Metrics EV/Revenue EV/EBITDA Revenue Growth Gross Margin EBITDA Margin Price 9/11/26 Mkt. Value Ent. Value Net Leverage Free Float %(1) LTM 6/30/26 CY26E CY27E LTM 6/30/26 CY26E CY27E LTM 6/30/26 CY26E CY27E LTM 6/30/26 CY26E CY27E LTM 6/30/26 CY26E CY27E PF Prism (Management) $5.94 $523 $1,457 3.9x 44% 1.4x 1.4x 1.3x 6.1x 6.2x 5.7x 8.9% 7.8% / 10.1% 8.1% 40% 39% 39% 24% 22% 22% PF Merchant Solutions 5.6% 5.6% / 8.8% 6.9% 24% 23% 23% 18% 17% 17% PF Treasury Solutions 17.1% 12.4% / 12.7% 11.5% 91% 89% 88% 81% 78% 78% Payables 21.1% 22.7% 7.6% 26% 25% 25% 14% 13% 13% Prism (Consensus) $5.94 $523 $1,457 4.1x 44% 1.4x 1.4x 1.3x 6.3x 6.2x 5.8x 7.7% 8.8% 7.4% 38% 39% 40% 23% 23% 22% Merchant Solutions Deluxe $23.62 $1,142 $3,125 4.2x 100% 1.4x 1.4x 1.4x 6.4x 6.4x 6.3x 3.0% 0.1% 0.0% 50% 50% 54% 22% 22% 23% Fiserv 51.58 28,036 54,436 3.0x 100% 2.8x 2.8x 2.7x 6.4x 6.7x 6.4x (1.6%) (1.2%) 3.5% 53% 57% 58% 44% 42% 42% Global Payments 88.29 23,581 41,668 3.2x 84% 3.4x 3.4x 3.2x 7.6x 7.3x 6.7x 7.6% 3.7% 5.2% 70% 82% 79% 44% 46% 48% Paysafe 6.34 415 2,715 5.4x 55% 1.5x 1.5x 1.4x 6.3x 6.0x 5.5x 8.2% 6.6% 5.6% 56% 56% 56% 24% 25% 26% Repay 3.56 352 1,053 4.0x 90% 1.8x 1.8x 1.7x 5.9x 5.5x 5.0x 1.0% 8.2% 4.3% 75% 67% 67% 31% 32% 33% Shift4 45.05 3,691 8,371 3.3x 71% 3.5x 3.3x 3.0x 7.5x 7.2x 6.3x 6.3% 8.2% 11.9% 68% 69% 70% 47% 46% 47% Mean 3.8x 83% 2.4x 2.4x 2.2x 6.7x 6.5x 6.0x 4.1% 4.3% 5.1% 62% 63% 64% 35% 35% 36% Median 3.6x 87% 2.3x 2.3x 2.2x 6.4x 6.5x 6.3x 4.6% 5.2% 4.7% 62% 62% 62% 37% 37% 38% Treasury Solutions Repay 3.56 352 1,053 4.0x 90% 1.8x 1.8x 1.7x 5.9x 5.5x 5.0x 1.0% 8.2% 4.3% 75% 67% 67% 31% 32% 33% WEX 191.52 6,795 11,020 3.7x 100% 3.9x 3.8x 3.8x 9.2x 8.8x 8.5x 7.5% 8.4% 1.6% 60% 60% 61% 43% 44% 44% Mean 3.8x 95% 2.9x 2.8x 2.7x 7.5x 7.1x 6.8x 4.2% 8.3% 2.9% 67% 63% 64% 37% 38% 39% Median 3.8x 95% 2.9x 2.8x 2.7x 7.5x 7.1x 6.8x 4.2% 8.3% 2.9% 67% 63% 64% 37% 38% 39% Payables Bill.com $47.25 $4,312 $4,228 NM 90% 2.6x 2.4x 2.2x 11.7x 9.4x 8.1x 13.0% 11.7% 10.7% 81% 83% 84% 22% 26% 27% Corpay 408.22 27,318 34,599 2.6x 100% 6.8x 6.5x 6.0x 12.0x 12.3x 11.1x 15.4% 13.1% 8.7% 78% 84% 84% 56% 53% 54% WEX 191.52 6,795 11,020 3.7x 100% 3.9x 3.8x 3.8x 9.2x 8.8x 8.5x 7.5% 8.4% 1.6% 60% 60% 61% 43% 44% 44% Mean 3.2x 97% 4.4x 4.3x 4.0x 11.0x 10.2x 9.3x 12.0% 11.1% 7.0% 73% 76% 76% 40% 41% 42% Median 3.2x 100% 3.9x 3.8x 3.8x 11.7x 9.4x 8.5x 13.0% 11.7% 8.7% 78% 83% 84% 43% 44% 44% WholeCo Deluxe $23.62 $1,142 $3,125 4.2x 100% 1.4x 1.4x 1.4x 6.4x 6.4x 6.3x 3.0% 0.1% 0.0% 50% 50% 54% 22% 22% 23% Paysafe 6.34 415 2,715 5.4x 55% 1.5x 1.5x 1.4x 6.3x 6.0x 5.5x 8.2% 6.6% 5.6% 56% 56% 56% 24% 25% 26% Repay 3.56 352 1,053 4.0x 90% 1.8x 1.8x 1.7x 5.9x 5.5x 5.0x 1.0% 8.2% 4.3% 75% 67% 67% 31% 32% 33% Flywire 17.87 2,457 2,162 NM 100% 3.1x 2.8x 2.4x 14.8x 12.4x 9.9x 33.5% 24.4% 14.9% 61% 58% 57% 21% 23% 25% Payoneer (as of 6/8/2026) 5.14 1,903 1,565 NM 84% 1.5x 1.4x 1.3x 5.7x 5.4x 4.8x 7.2% 6.5% 15.7% 85% 85% 85% 26% 26% 26% Paypal 53.72 47,661 45,891 NM 100% 1.3x 1.3x 1.3x 6.6x 6.8x 6.8x 5.7% 4.8% 4.3% 46% 45% 44% 20% 19% 19% WEX 191.52 6,795 11,020 3.7x 100% 3.9x 3.8x 3.8x 9.2x 8.8x 8.5x 7.5% 8.4% 1.6% 60% 60% 61% 43% 44% 44% 25th Percentile 3.8x 84% 1.4x 1.4x 1.3x 5.9x 5.5x 5.0x 3.0% 4.8% 1.6% 50% 50% 54% 21% 22% 23% Mean 4.3x 90% 2.1x 2.0x 1.9x 7.8x 7.3x 6.7x 9.4% 8.4% 6.6% 62% 60% 61% 27% 27% 28% Median 4.1x 100% 1.5x 1.5x 1.4x 6.4x 6.4x 6.3x 7.2% 6.6% 4.3% 60% 58% 57% 24% 25% 26% 75th Percentile 5.1x 100% 3.1x 2.8x 2.4x 9.2x 8.8x 8.5x 8.2% 8.4% 14.9% 75% 67% 67% 31% 32% 33% Reference Valuation Metric Selected Range Implied EV Implied Equity Value Implied Share Price PF LTM 6/30/2026 Adj. EBITDA $240 6.00x - 7.50x $1,440 - $1,800 $506 - $866 $5.74 - $9.92 PF 2026 Adj. EBITDA $235 5.50x - 7.00x $1,294 - $1,646 $360 - $713 $4.04 - $8.14 2027 Adj. EBITDA $255 5.00x - 6.50x $1,276 - $1,658 $342 - $725 $3.83 - $8.28 (6) (5) 9
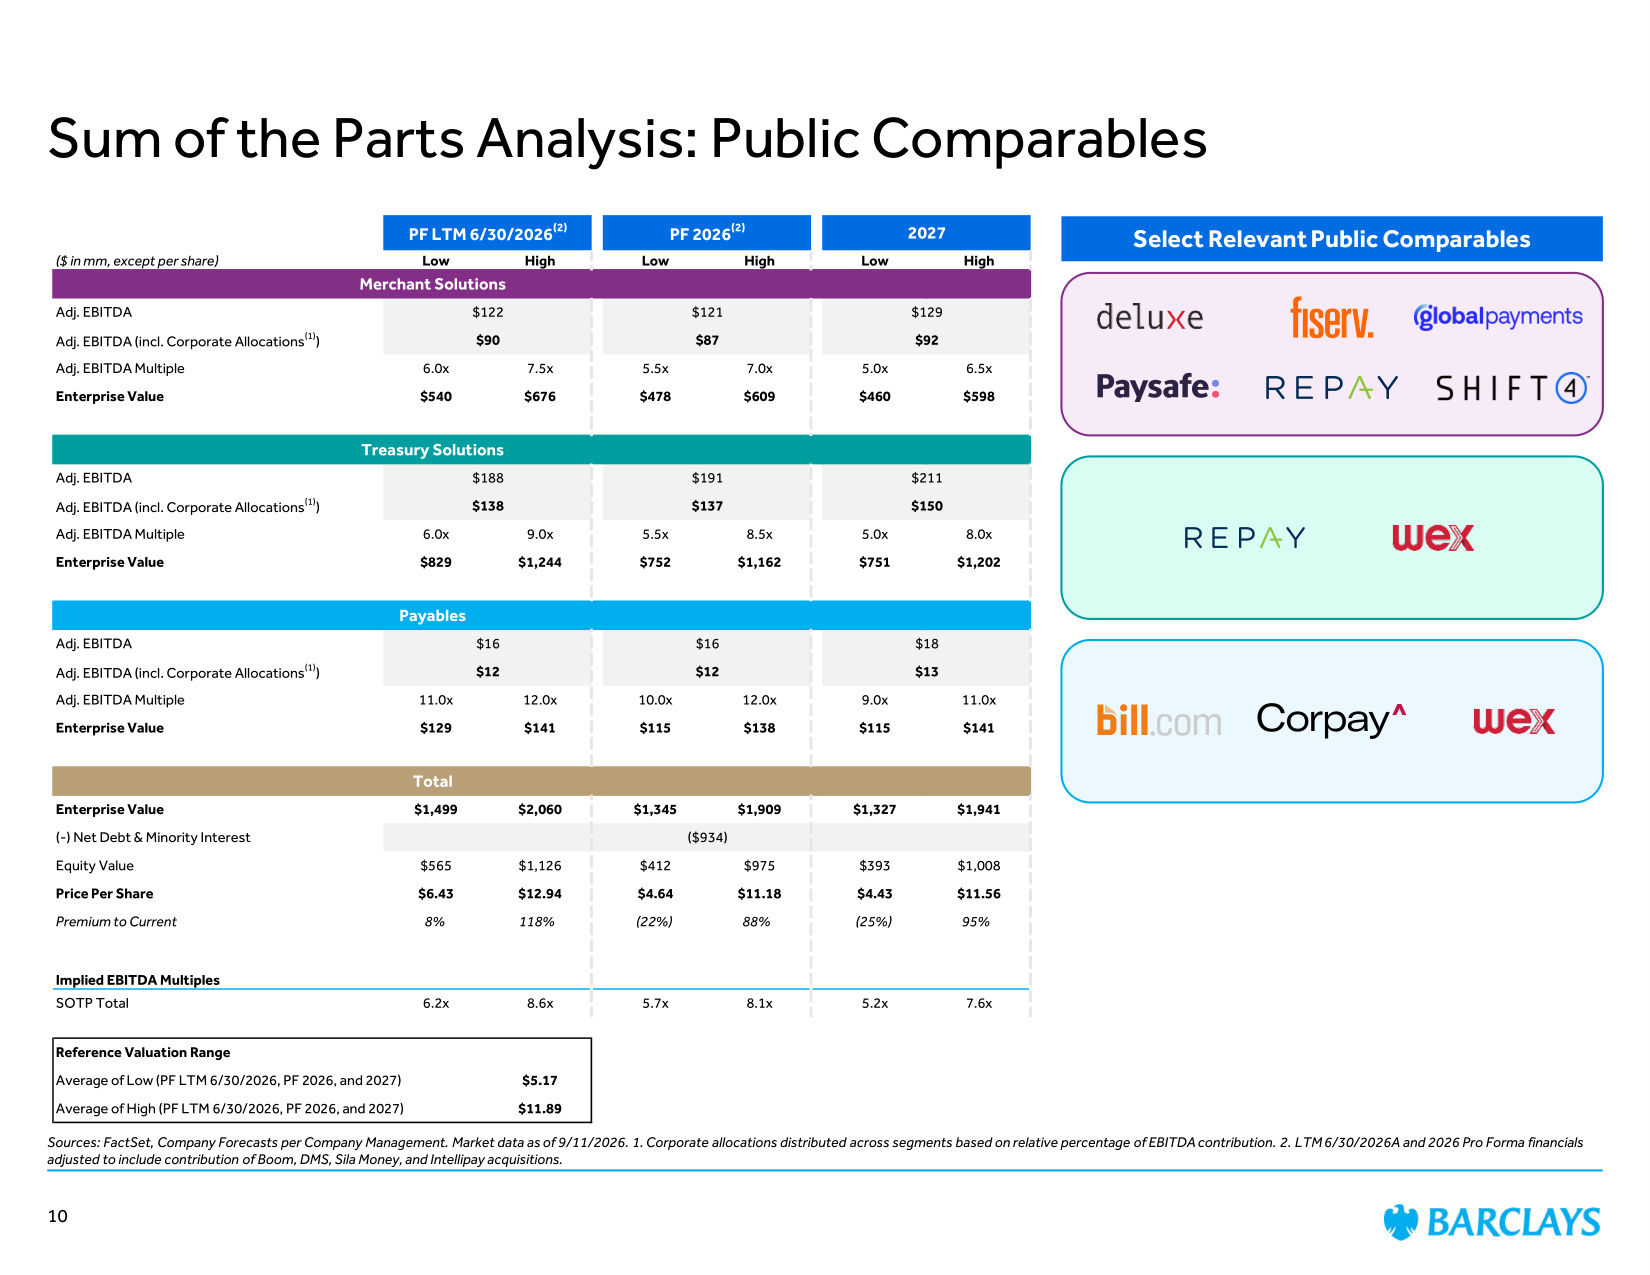
Sum of the Parts Analysis: Public Comparables Sources: FactSet, Company Forecasts per Company Management. Market data as of 9/11/2026. 1. Corporate allocations distributed across segments based on relative percentage of EBITDA contribution. 2. LTM 6/30/2026A and 2026 Pro Forma financials adjusted to include contribution of Boom, DMS, Sila Money, and Intellipay acquisitions. Select Relevant Public Comparables PF LTM 6/30/2026(2) PF 2026(2) 2027 ($ in mm, except per share) Low High Low High Low High Merchant Solutions Adj. EBITDA $122 $121 $129 Adj. EBITDA (incl. Corporate Allocations(1)) $90 $87 $92 Adj. EBITDA Multiple 6.0x 7.5x 5.5x 7.0x 5.0x 6.5x Enterprise Value $540 $676 $478 $609 $460 $598 Treasury Solutions Adj. EBITDA $188 $191 $211 Adj. EBITDA (incl. Corporate Allocations(1)) $138 $137 $150 Adj. EBITDA Multiple 6.0x 9.0x 5.5x 8.5x 5.0x 8.0x Enterprise Value $829 $1,244 $752 $1,162 $751 $1,202 Payables Adj. EBITDA $16 $16 $18 Adj. EBITDA (incl. Corporate Allocations(1)) $12 $12 $13 Adj. EBITDA Multiple 11.0x 12.0x 10.0x 12.0x 9.0x 11.0x Enterprise Value $129 $141 $115 $138 $115 $141 Total Enterprise Value $1,499 $2,060 $1,345 $1,909 $1,327 $1,941 (-) Net Debt & Minority Interest ($934) Equity Value $565 $1,126 $412 $975 $393 $1,008 Price Per Share $6.43 $12.94 $4.64 $11.18 $4.43 $11.56 Premium to Current 8% 118% (22%) 88% (25%) 95% Implied EBITDA Multiples SOTP Total 6.2x 8.6x 5.7x 8.1x 5.2x 7.6x Reference Valuation Range Average of Low (PF LTM 6/30/2026, PF 2026, and 2027) $5.17 Average of High (PF LTM 6/30/2026, PF 2026, and 2027) $11.89 10
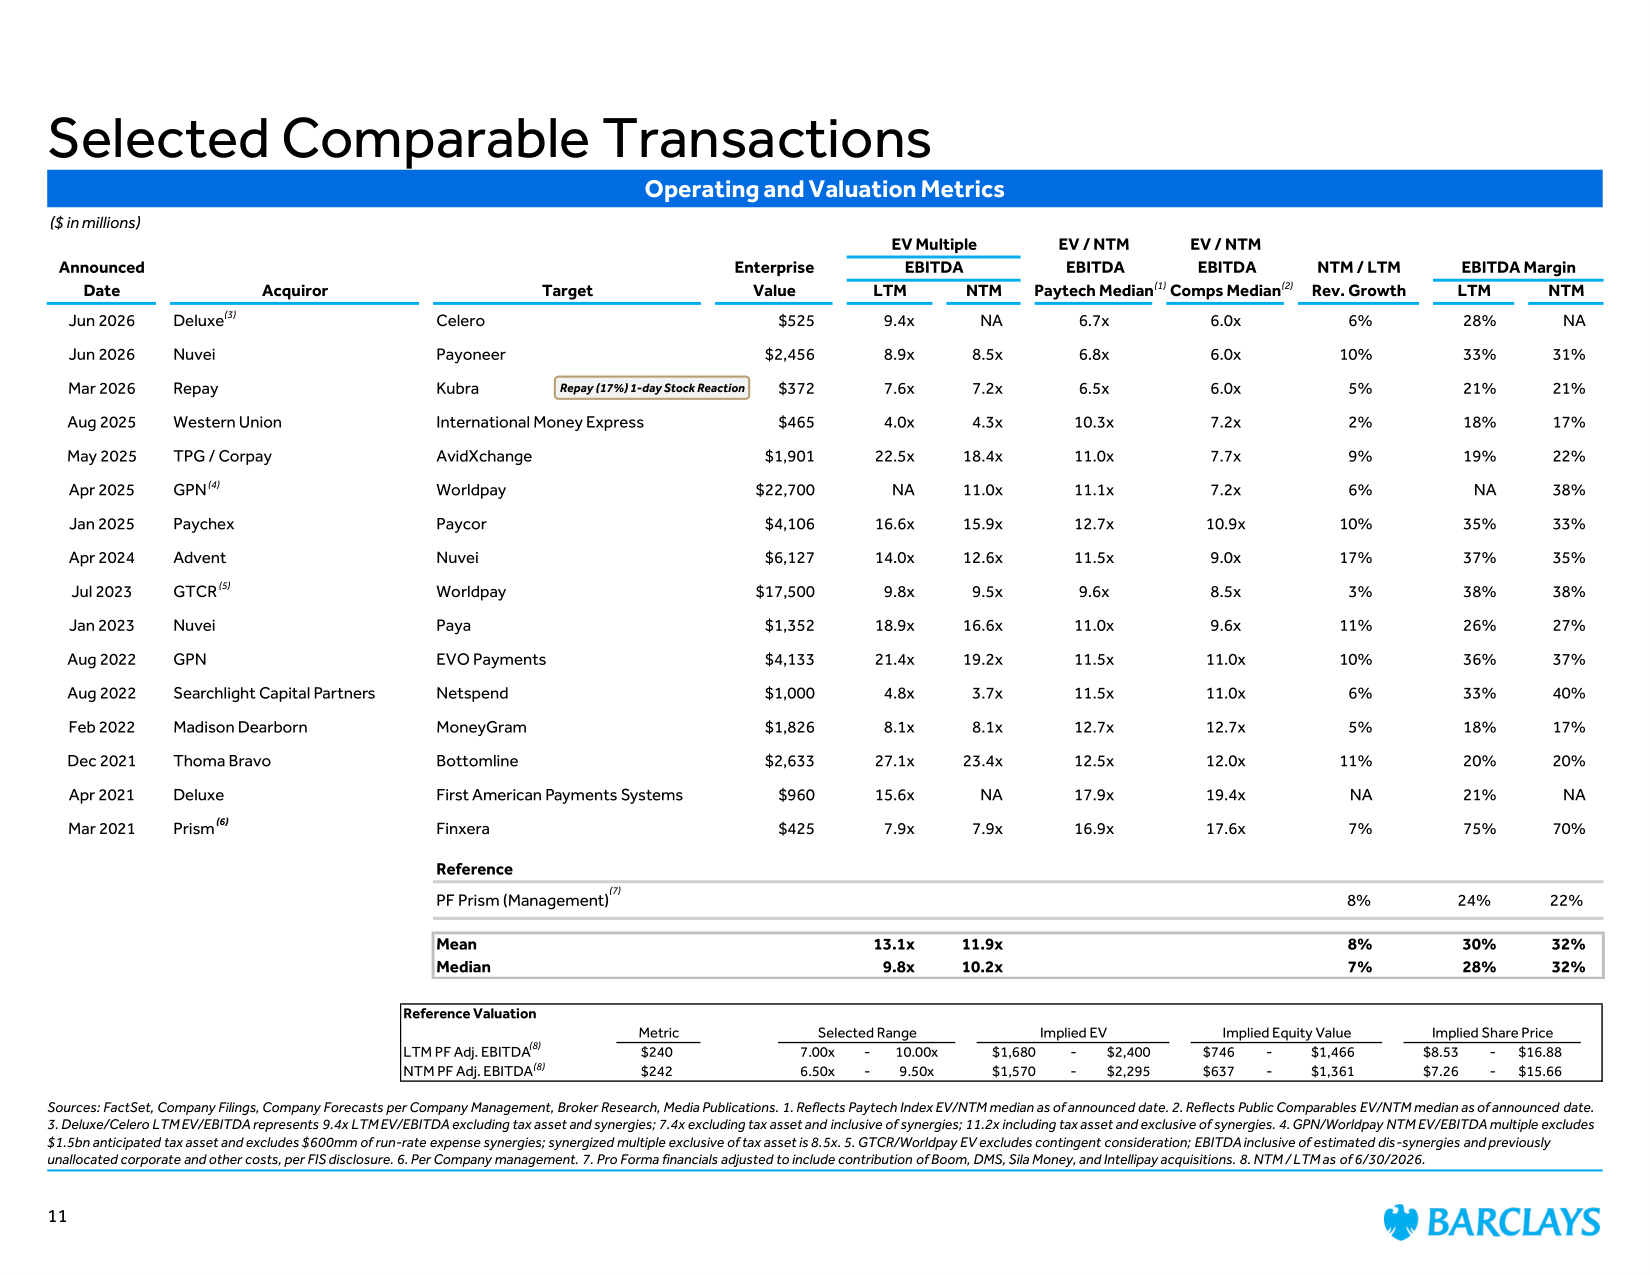
Selected Comparable Transactions Sources: FactSet, Company Filings, Company Forecasts per Company Management, Broker Research, Media Publications. 1. Reflects Paytech Index EV/NTM median as of announced date. 2. Reflects Public Comparables EV/NTM median as of announced date. 3. Deluxe/Celero LTM EV/EBITDA represents 9.4x LTM EV/EBITDA excluding tax asset and synergies; 7.4x excluding tax asset and inclusive of synergies; 11.2x including tax asset and exclusive of synergies. 4. GPN/Worldpay NTM EV/EBITDA multiple excludes $1.5bn anticipated tax asset and excludes $600mm of run-rate expense synergies; synergized multiple exclusive of tax asset is 8.5x. 5. GTCR/Worldpay EV excludes contingent consideration; EBITDA inclusive of estimated dis-synergies and previously unallocated corporate and other costs, per FIS disclosure. 6. Per Company management. 7. Pro Forma financials adjusted to include contribution of Boom, DMS, Sila Money, and Intellipay acquisitions. 8. NTM / LTM as of 6/30/2026. ($ in millions) EV Multiple EV / NTM EV / NTM Announced Enterprise EBITDA EBITDA EBITDA NTM / LTM EBITDA Margin Date Acquiror Target Value LTM NTM Paytech Median Comps Median Rev. Growth LTM NTM Jun 2026 Deluxe Celero $525 9.4x NA 6.7x 6.0x 6% 28% NA Jun 2026 Nuvei Payoneer $2,456 8.9x 8.5x 6.8x 6.0x 10% 33% 31% Mar 2026 Repay Kubra $372 7.6x 7.2x 6.5x 6.0x 5% 21% 21% Aug 2025 Western Union International Money Express $465 4.0x 4.3x 10.3x 7.2x 2% 18% 17% May 2025 TPG / Corpay AvidXchange $1,901 22.5x 18.4x 11.0x 7.7x 9% 19% 22% Apr 2025 GPN Worldpay $22,700 NA 11.0x 11.1x 7.2x 6% NA 38% Jan 2025 Paychex Paycor $4,106 16.6x 15.9x 12.7x 10.9x 10% 35% 33% Apr 2024 Advent Nuvei $6,127 14.0x 12.6x 11.5x 9.0x 17% 37% 35% Jul 2023 GTCR Worldpay $17,500 9.8x 9.5x 9.6x 8.5x 3% 38% 38% Jan 2023 Nuvei Paya $1,352 18.9x 16.6x 11.0x 9.6x 11% 26% 27% Aug 2022 GPN EVO Payments $4,133 21.4x 19.2x 11.5x 11.0x 10% 36% 37% Aug 2022 Searchlight Capital Partners Netspend $1,000 4.8x 3.7x 11.5x 11.0x 6% 33% 40% Feb 2022 Madison Dearborn MoneyGram $1,826 8.1x 8.1x 12.7x 12.7x 5% 18% 17% Dec 2021 Thoma Bravo Bottomline $2,633 27.1x 23.4x 12.5x 12.0x 11% 20% 20% Apr 2021 Deluxe First American Payments Systems $960 15.6x NA 17.9x 19.4x NA 21% NA Mar 2021 Prism Finxera $425 7.9x 7.9x 16.9x 17.6x 7% 75% 70% Reference PF Prism (Management) 8% 24% 22% Mean 13.1x 11.9x 8% 30% 32% Median 9.8x 10.2x 7% 28% 32% Operating and Valuation Metrics 11 (5) (6) (1) (7) Reference Valuation Metric Selected Range Implied EV Implied Equity Value Implied Share Price LTM PF Adj. EBITDA $240 7.00x - 10.00x $1,680 - $2,400 $746 - $1,466 $8.53 - $16.88 NTM PF Adj. EBITDA $242 6.50x - 9.50x $1,570 - $2,295 $637 - $1,361 $7.26 - $15.66 (2) (4) (8) (8) Repay (17%) 1-day Stock Reaction (3)
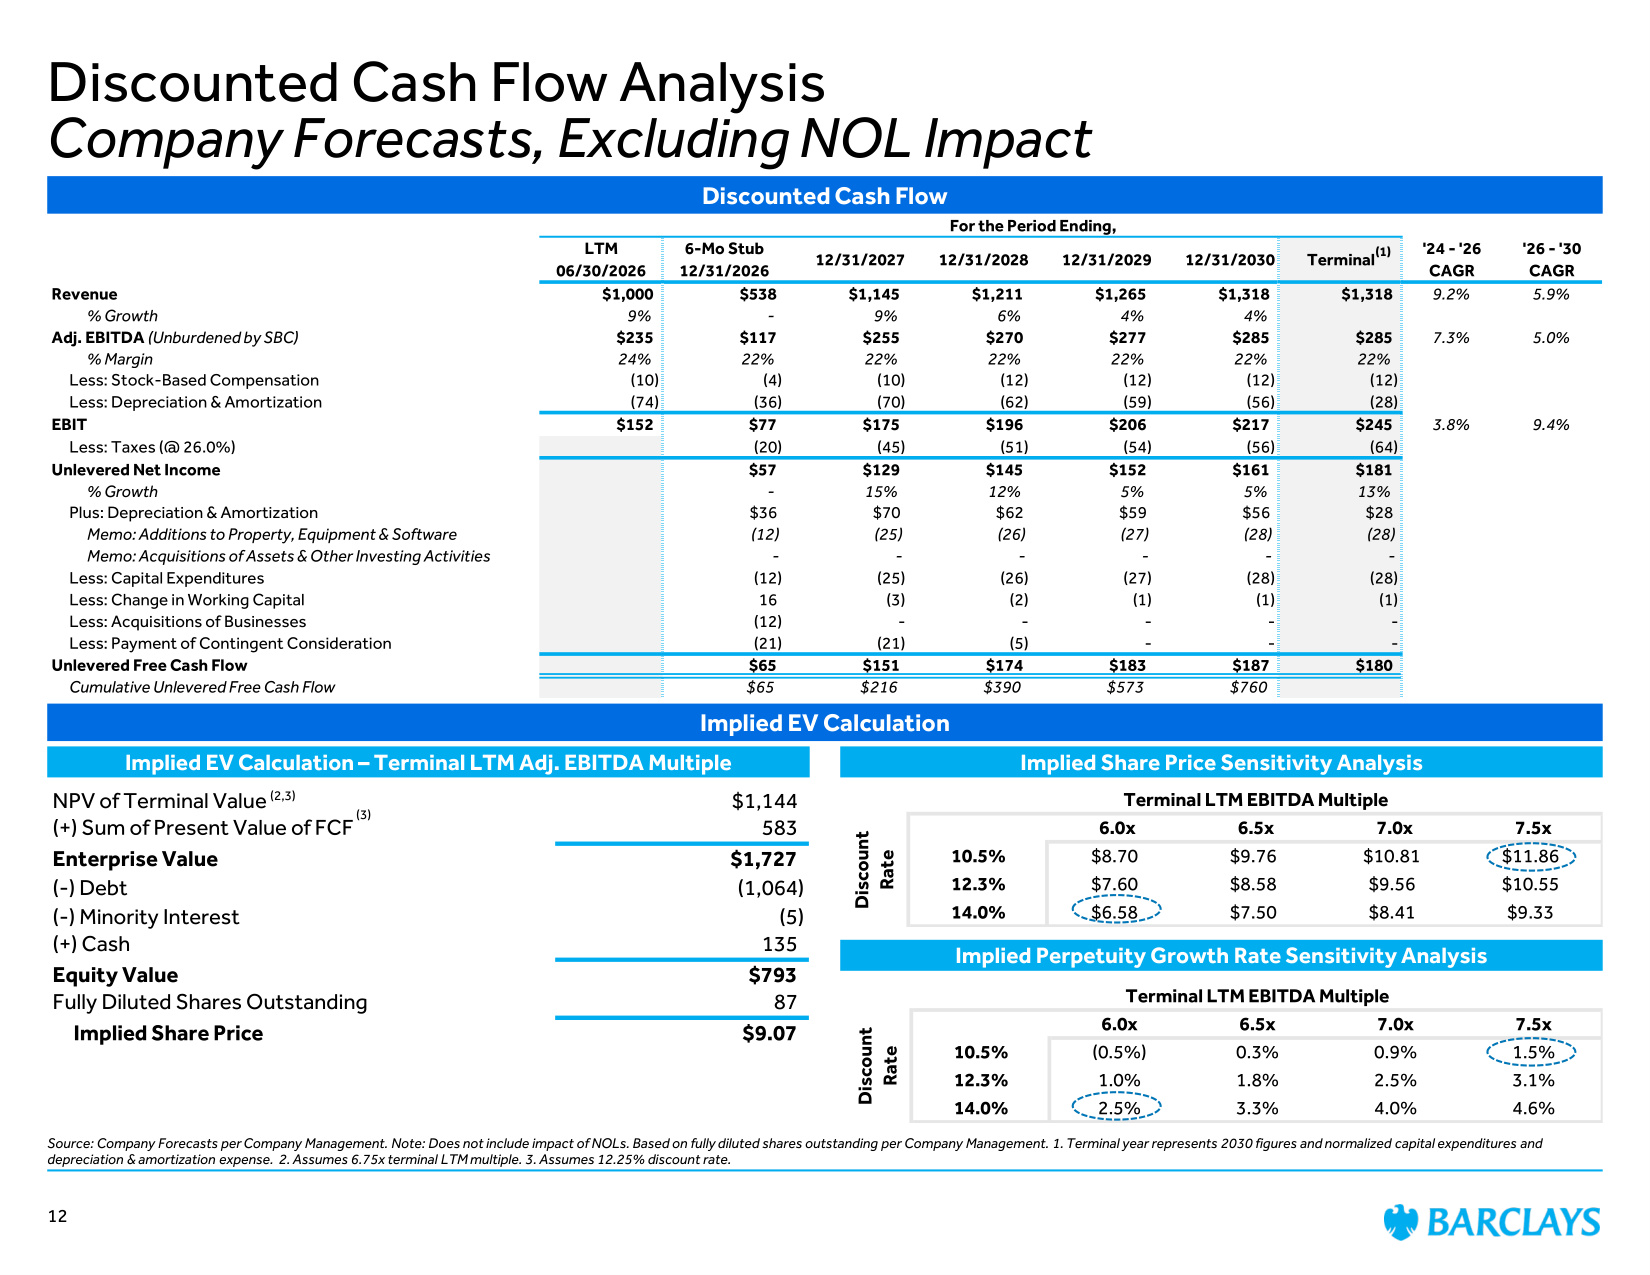
For the Period Ending, LTM 06/30/2026 6-Mo Stub 12/31/2026 12/31/2027 12/31/2028 12/31/2029 12/31/2030 Terminal '24 - '26 CAGR '26 - '30 CAGR Revenue $1,000 $538 $1,145 $1,211 $1,265 $1,318 $1,318 9.2% 5.9% % Growth 9% - 9% 6% 4% 4% Adj. EBITDA (Unburdened by SBC) $235 $117 $255 $270 $277 $285 $285 7.3% 5.0% % Margin 24% 22% 22% 22% 22% 22% 22% Less: Stock-Based Compensation (10) (4) (10) (12) (12) (12) (12) Less: Depreciation & Amortization (74) (36) (70) (62) (59) (56) (28) EBIT $152 $77 $175 $196 $206 $217 $245 3.8% 9.4% Less: Taxes (@ 26.0%) (20) (45) (51) (54) (56) (64) Unlevered Net Income $57 $129 $145 $152 $161 $181 % Growth - 15% 12% 5% 5% 13% Plus: Depreciation & Amortization $36 $70 $62 $59 $56 $28 Memo: Additions to Property, Equipment & Software (12) (25) (26) (27) (28) (28) Memo: Acquisitions of Assets & Other Investing Activities - - - - - - Less: Capital Expenditures (12) (25) (26) (27) (28) (28) Less: Change in Working Capital 16 (3) (2) (1) (1) (1) Less: Acquisitions of Businesses (12) - - - - - Less: Payment of Contingent Consideration (21) (21) (5) - - - Unlevered Free Cash Flow $65 $151 $174 $183 $187 $180 Cumulative Unlevered Free Cash Flow $65 $216 $390 $573 $760 Implied EV Calculation Implied EV Calculation – Terminal LTM Adj. EBITDA Multiple Implied Share Price Sensitivity Analysis Implied Perpetuity Growth Rate Sensitivity Analysis Discounted Cash Flow Terminal LTM EBITDA Multiple 6.0x 6.5x 7.0x 7.5x 10.5% $8.70 $9.76 $10.81 $11.86 12.3% $7.60 $8.58 $9.56 $10.55 14.0% $6.58 $7.50 $8.41 $9.33 Discount Rate Discounted Cash Flow Analysis Company Forecasts, Excluding NOL Impact Source: Company Forecasts per Company Management. Note: Does not include impact of NOLs. Based on fully diluted shares outstanding per Company Management. 1. Terminal year represents 2030 figures and normalized capital expenditures and depreciation & amortization expense. 2. Assumes 6.75x terminal LTM multiple. 3. Assumes 12.25% discount rate. (1) Terminal LTM EBITDA Multiple 6.0x 6.5x 7.0x 7.5x 10.5% (0.5%) 0.3% 0.9% 1.5% 12.3% 1.0% 1.8% 2.5% 3.1% 14.0% 2.5% 3.3% 4.0% 4.6% Discount Rate (2,3) (3) 12 NPV of Terminal Value $1,144 (+) Sum of Present Value of FCF 583 Enterprise Value $1,727 (-) Debt (1,064) (-) Minority Interest (5) (+) Cash 135 Equity Value $793 Fully Diluted Shares Outstanding 87 Implied Share Price $9.07
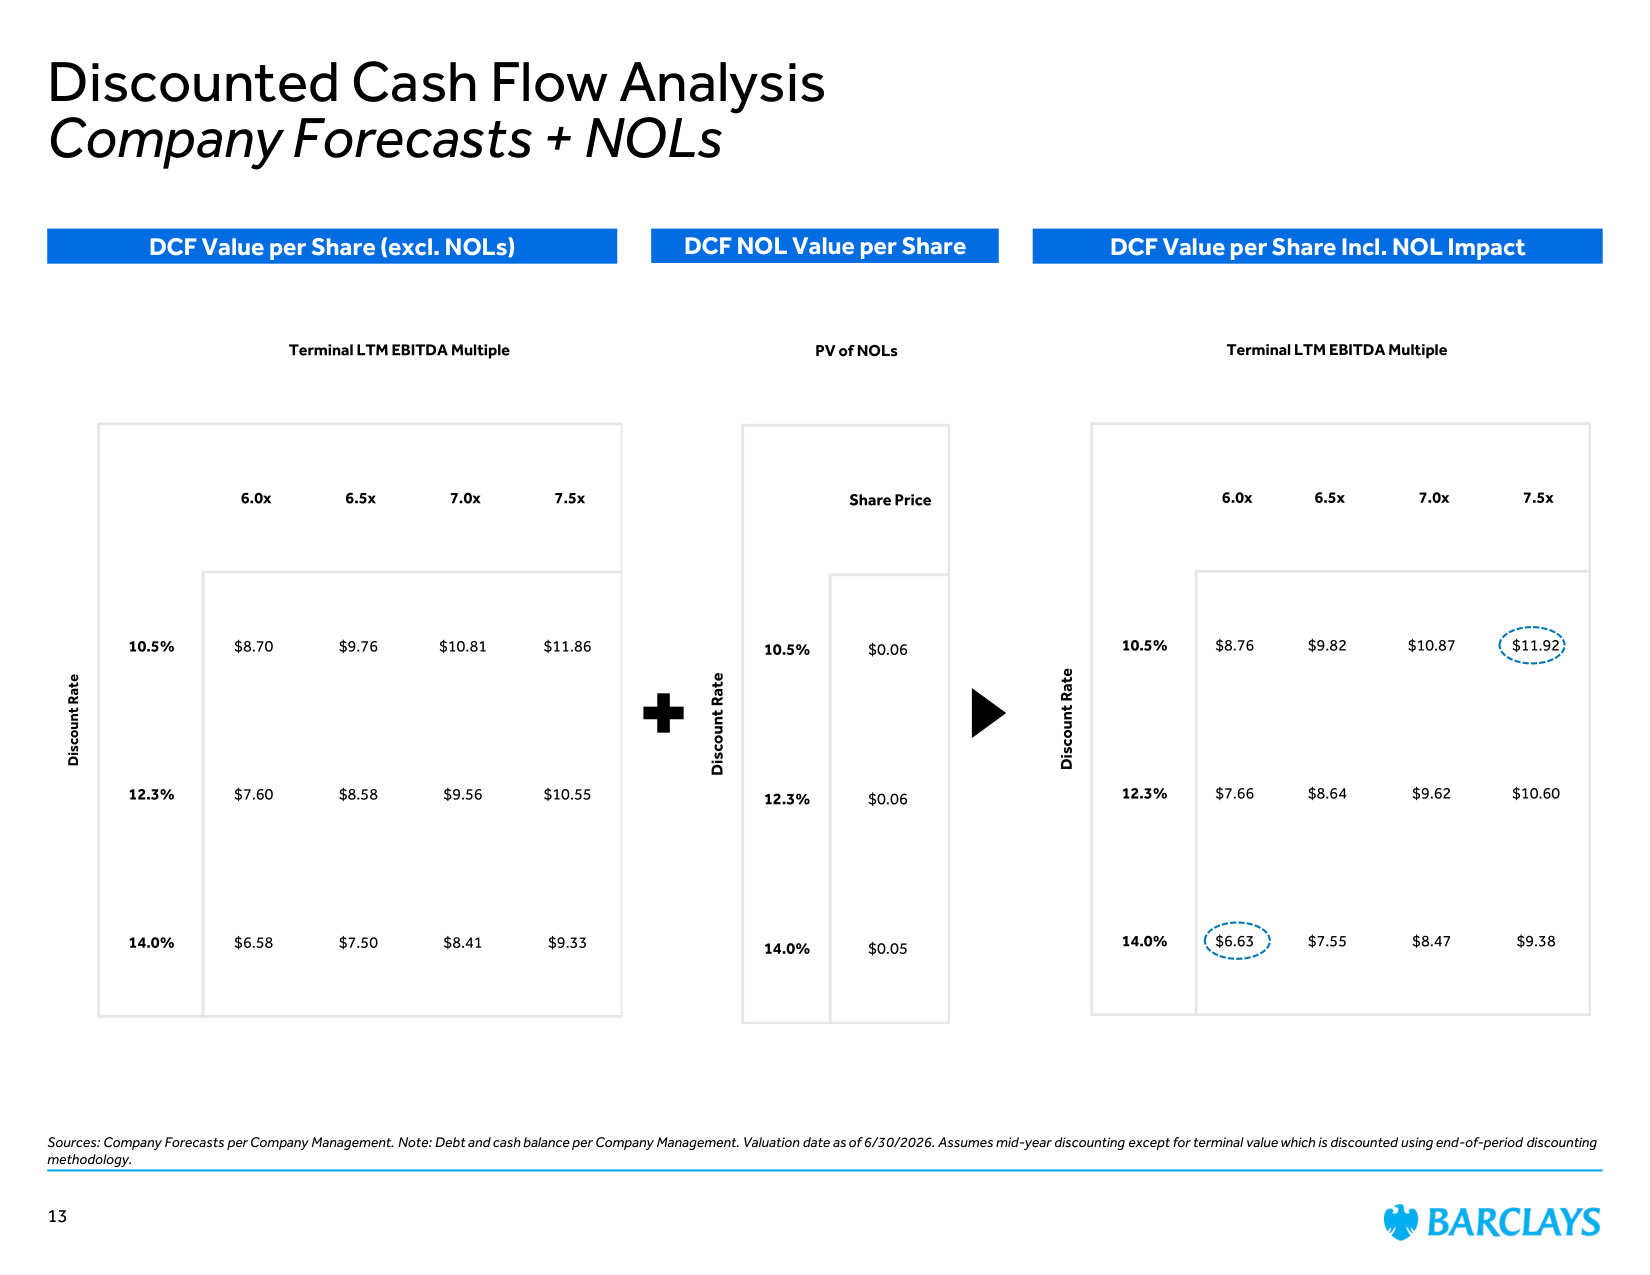
Terminal LTM EBITDA Multiple 6.0x 6.5x 7.0x 7.5x 10.5% $8.76 $9.82 $10.87 $11.92 12.3% $7.66 $8.64 $9.62 $10.60 14.0% $6.63 $7.55 $8.47 $9.38 Discount Rate Discounted Cash Flow Analysis Company Forecasts + NOLs Sources: Company Forecasts per Company Management. Note: Debt and cash balance per Company Management. Valuation date as of 6/30/2026. Assumes mid-year discounting except for terminal value which is discounted using end-of-period discounting methodology. DCF Value per Share (excl. NOLs) DCF NOL Value per Share DCF Value per Share Incl. NOL Impact Terminal LTM EBITDA Multiple 6.0x 6.5x 7.0x 7.5x 10.5% $8.70 $9.76 $10.81 $11.86 12.3% $7.60 $8.58 $9.56 $10.55 14.0% $6.58 $7.50 $8.41 $9.33 Discount Rate PV of NOLs Share Price 10.5% $0.06 12.3% $0.06 14.0% $0.05 Discount Rate 13
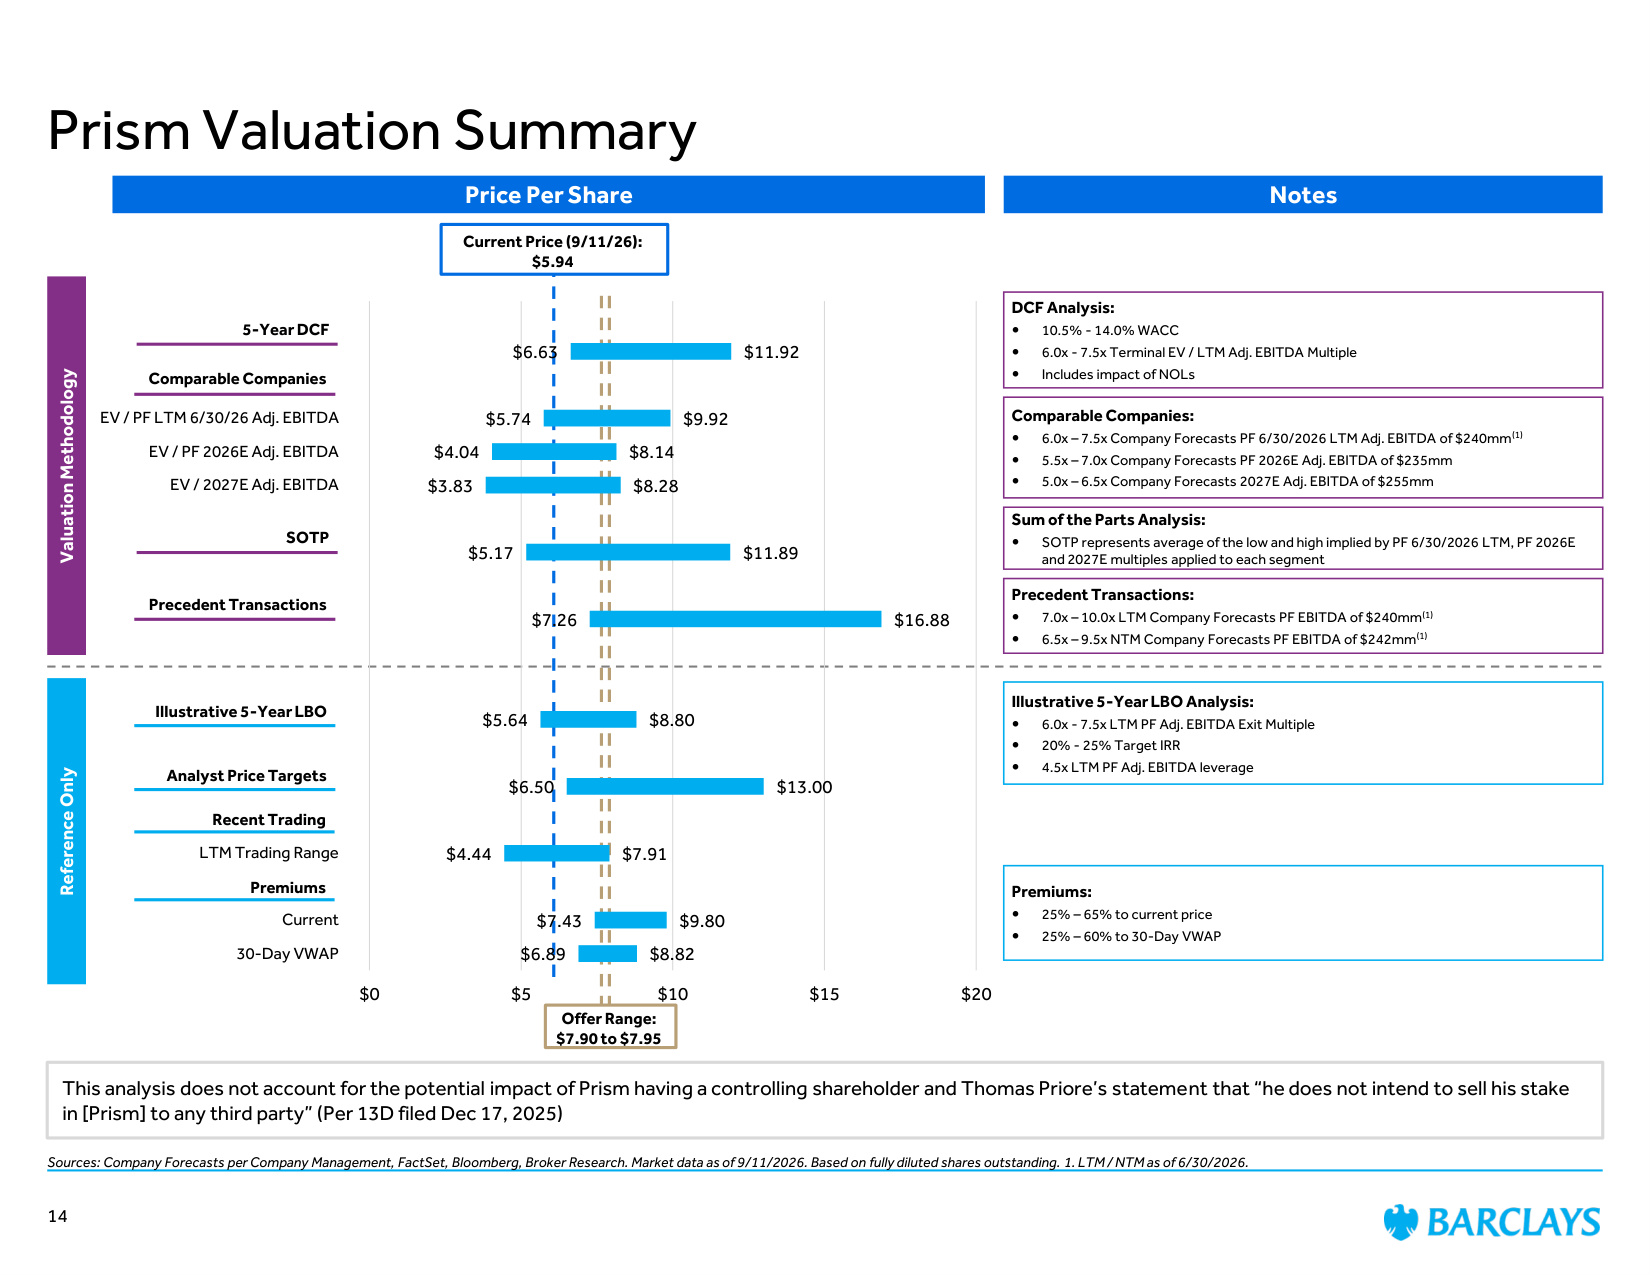
Price Per Share Notes Comparable Companies: 6.0x – 7.5x Company Forecasts PF 6/30/2026 LTM Adj. EBITDA of $240mm(1) 5.5x – 7.0x Company Forecasts PF 2026E Adj. EBITDA of $235mm 5.0x – 6.5x Company Forecasts 2027E Adj. EBITDA of $255mm Premiums: 25% – 65% to current price 25% – 60% to 30-Day VWAP Precedent Transactions: 7.0x – 10.0x LTM Company Forecasts PF EBITDA of $240mm(1) 6.5x – 9.5x NTM Company Forecasts PF EBITDA of $242mm(1) Valuation Methodology Reference Only Prism Valuation Summary DCF Analysis: 10.5% - 14.0% WACC 6.0x - 7.5x Terminal EV / LTM Adj. EBITDA Multiple Includes impact of NOLs Premiums Recent Trading Precedent Transactions Comparable Companies Sources: Company Forecasts per Company Management, FactSet, Bloomberg, Broker Research. Market data as of 9/11/2026. Based on fully diluted shares outstanding. 1. LTM / NTM as of 6/30/2026. Illustrative 5-Year LBO Analysis: 6.0x - 7.5x LTM PF Adj. EBITDA Exit Multiple 20% - 25% Target IRR 4.5x LTM PF Adj. EBITDA leverage Illustrative 5-Year LBO Current Price (9/11/26): $5.94 5-Year DCF Analyst Price Targets $6.63 $5.74 $4.04 $3.83 $5.17 $7.26 $5.64 $6.50 $4.44 $7.43 $6.89 $11.92 $9.92 $8.14 $8.28 $11.89 $16.88 $8.80 $13.00 $7.91 $9.80 $8.82 $0 $5 $10 $15 $20 EV / PF LTM 6/30/26 Adj. EBITDA EV / PF 2026E Adj. EBITDA EV / 2027E Adj. EBITDA LTM Trading Range Current 30-Day VWAP This analysis does not account for the potential impact of Prism having a controlling shareholder and Thomas Priore's statement that "he does not intend to sell his stake in [Prism] to any third party" (Per 13D filed Dec 17, 2025) SOTP Sum of the Parts Analysis: SOTP represents average of the low and high implied by PF 6/30/2026 LTM, PF 2026E and 2027E multiples applied to each segment Offer Range: $7.90 to $7.95 14
Appendix
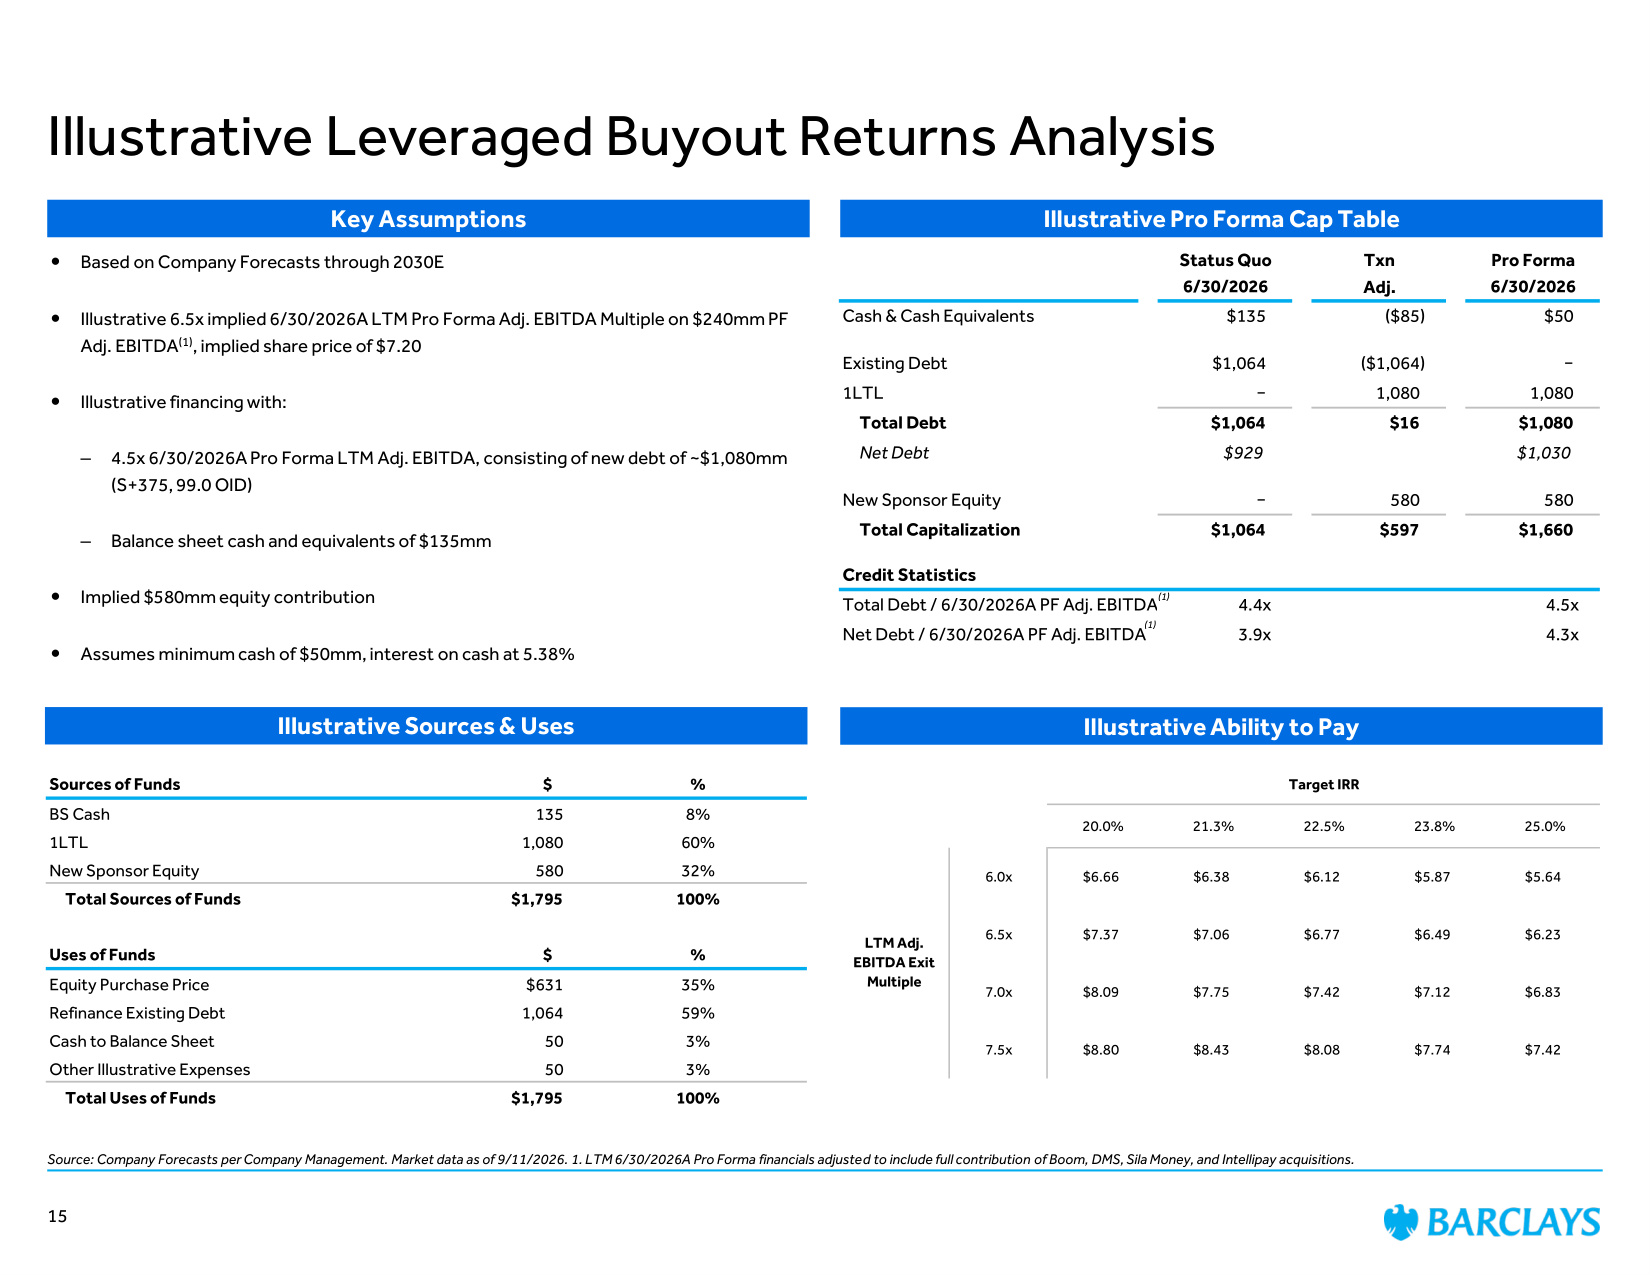
Illustrative Pro Forma Cap Table Illustrative Ability to Pay Key Assumptions Sources of Funds $ % BS Cash 135 8% 1LTL 1,080 60% New Sponsor Equity 580 32% Total Sources of Funds $1,795 100% Uses of Funds $ % Equity Purchase Price $631 35% Refinance Existing Debt 1,064 59% Cash to Balance Sheet 50 3% Other Illustrative Expenses 50 3% Total Uses of Funds $1,795 100% Status Quo Txn Pro Forma 6/30/2026 Adj. 6/30/2026 Cash & Cash Equivalents $135 ($85) $50 Existing Debt $1,064 ($1,064) − 1LTL − 1,080 1,080 Total Debt $1,064 $16 $1,080 Net Debt $929 $1,030 New Sponsor Equity − 580 580 Total Capitalization $1,064 $597 $1,660 Credit Statistics Total Debt / 6/30/2026A PF Adj. EBITDA 4.4x 4.5x Net Debt / 6/30/2026A PF Adj. EBITDA 3.9x 4.3x Target IRR 20.0% 21.3% 22.5% 23.8% 25.0% 6.0x $6.66 $6.38 $6.12 $5.87 $5.64 6.5x $7.37 $7.06 $6.77 $6.49 $6.23 7.0x $8.09 $7.75 $7.42 $7.12 $6.83 7.5x $8.80 $8.43 $8.08 $7.74 $7.42 LTM Adj. EBITDA Exit Multiple Illustrative Sources & Uses Based on Company Forecasts through 2030E Illustrative 6.5x implied 6/30/2026A LTM Pro Forma Adj. EBITDA Multiple on $240mm PF Adj. EBITDA(1), implied share price of $7.20 Illustrative financing with: – 4.5x 6/30/2026A Pro Forma LTM Adj. EBITDA, consisting of new debt of ~$1,080mm (S+375, 99.0 OID) – Balance sheet cash and equivalents of $135mm Implied $580mm equity contribution Assumes minimum cash of $50mm, interest on cash at 5.38% Illustrative Leveraged Buyout Returns Analysis Source: Company Forecasts per Company Management. Market data as of 9/11/2026. 1. LTM 6/30/2026A Pro Forma financials adjusted to include full contribution of Boom, DMS, Sila Money, and Intellipay acquisitions. (1) (1) 15
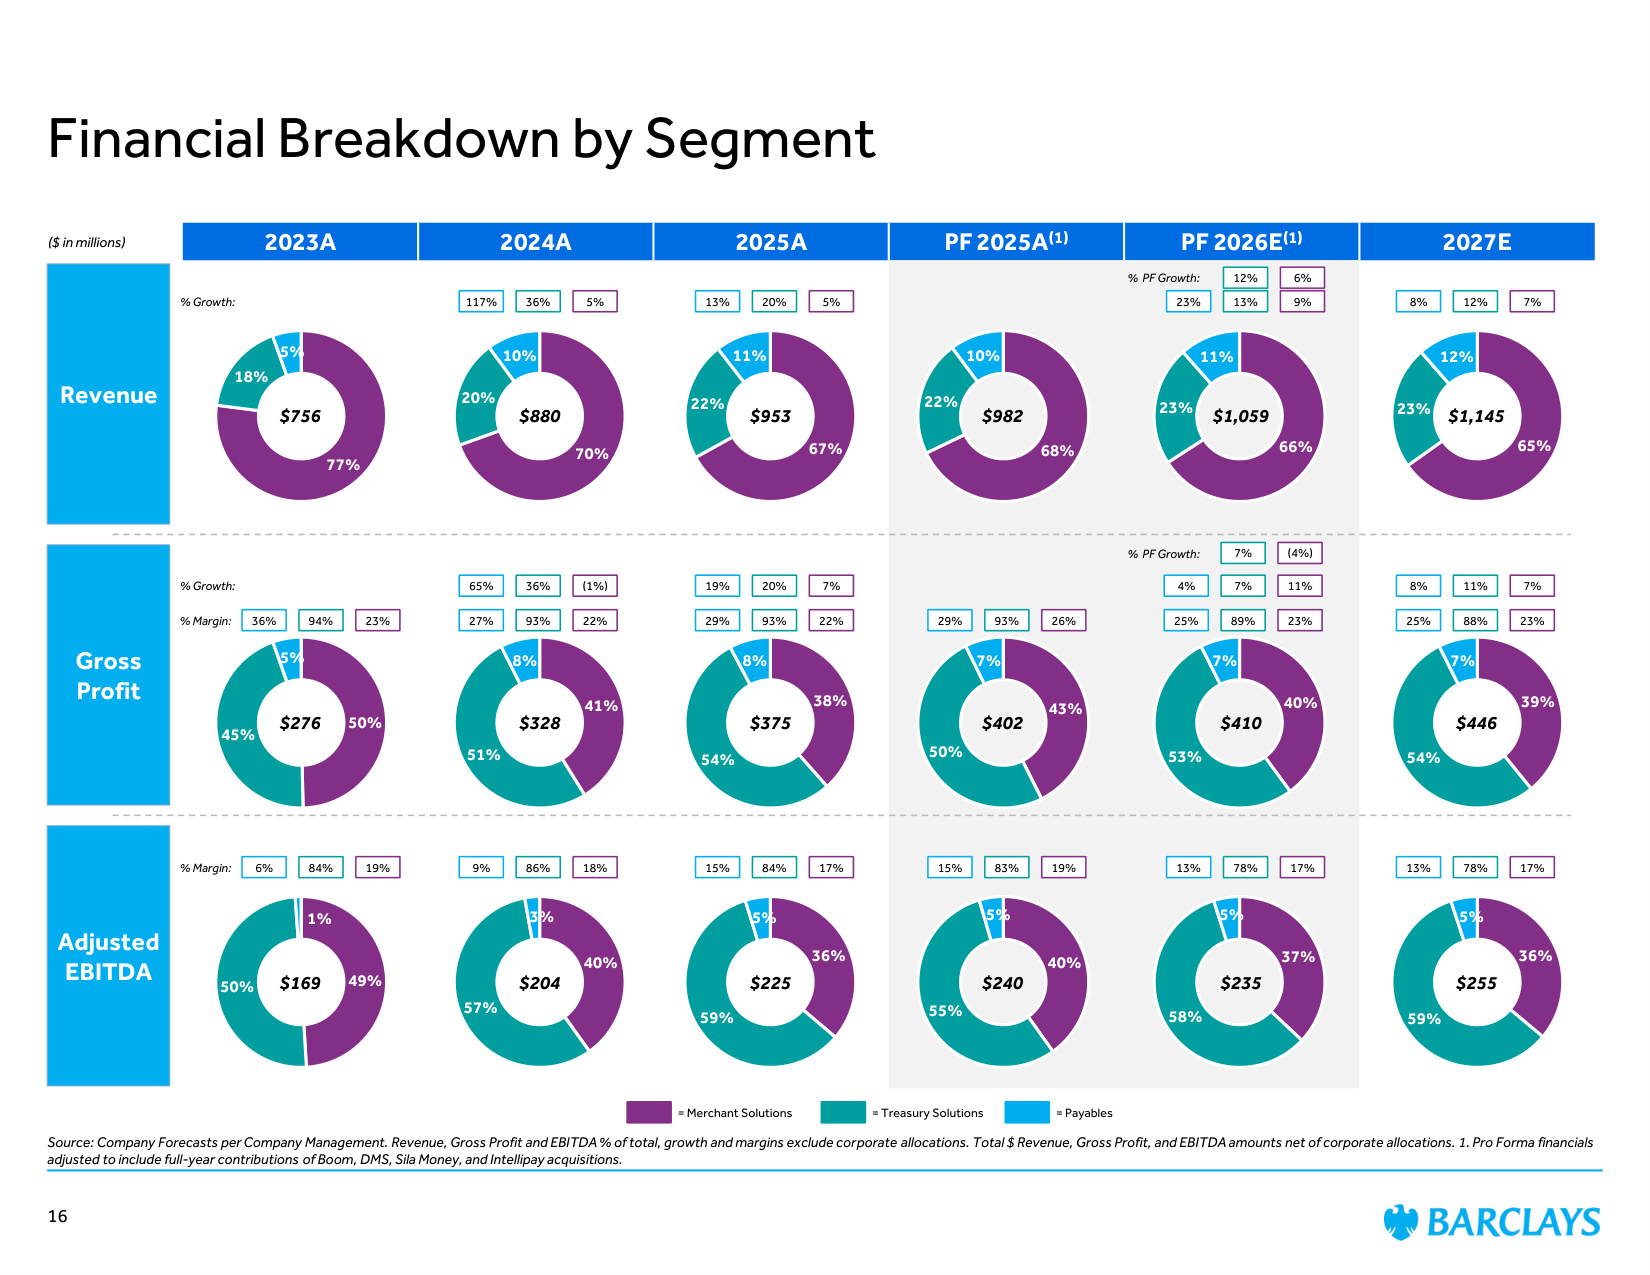
2023A 2024A 2025A PF 2025A(1) PF 2026E(1) 2027E Source: Company Forecasts per Company Management. Revenue, Gross Profit and EBITDA % of total, growth and margins exclude corporate allocations. Total $ Revenue, Gross Profit, and EBITDA amounts net of corporate allocations. 1. Pro Forma financials adjusted to include full-year contributions of Boom, DMS, Sila Money, and Intellipay acquisitions. Financial Breakdown by Segment Revenue ($ in millions) Adjusted EBITDA 16 Gross Profit 77% 18% 5% 70% 20% 10% 67% 22% 11% 68% 22% 10% 66% 23% 11% 50% 45% 5% 41% 51% 8% 38% 54% 8% 43% 50% 7% 40% 53% 7% 49% 50% 1% 40% 57% 3% 36% 59% 5% 40% 55% 5% 37% 58% 5% % Margin: % Margin: % Growth: 5% 117% 36% 5% 13% 20% 9% 23% 13% 22% 27% 93% 22% 29% 93% 26% 29% 93% 23% 25% 88% 18% 9% 86% 17% 15% 84% 19% 15% 83% 17% 13% 78% 23% 36% 94% 19% 6% 84% $953 $982 $1,059 $756 $880 $375 $402 $410 $276 $328 $225 $240 $235 $169 $204 = Merchant Solutions = Payables = Treasury Solutions % Growth: (1%) 65% 36% 7% 19% 20% 7% 8% 11% 23% 25% 89% 11% 4% 7% 65% 23% 12% 36% 59% 5% $1,145 $446 $255 17% 13% 78% 6% 12% % PF Growth: (4%) 7% % PF Growth: 7% 8% 12% 39% 54% 7%
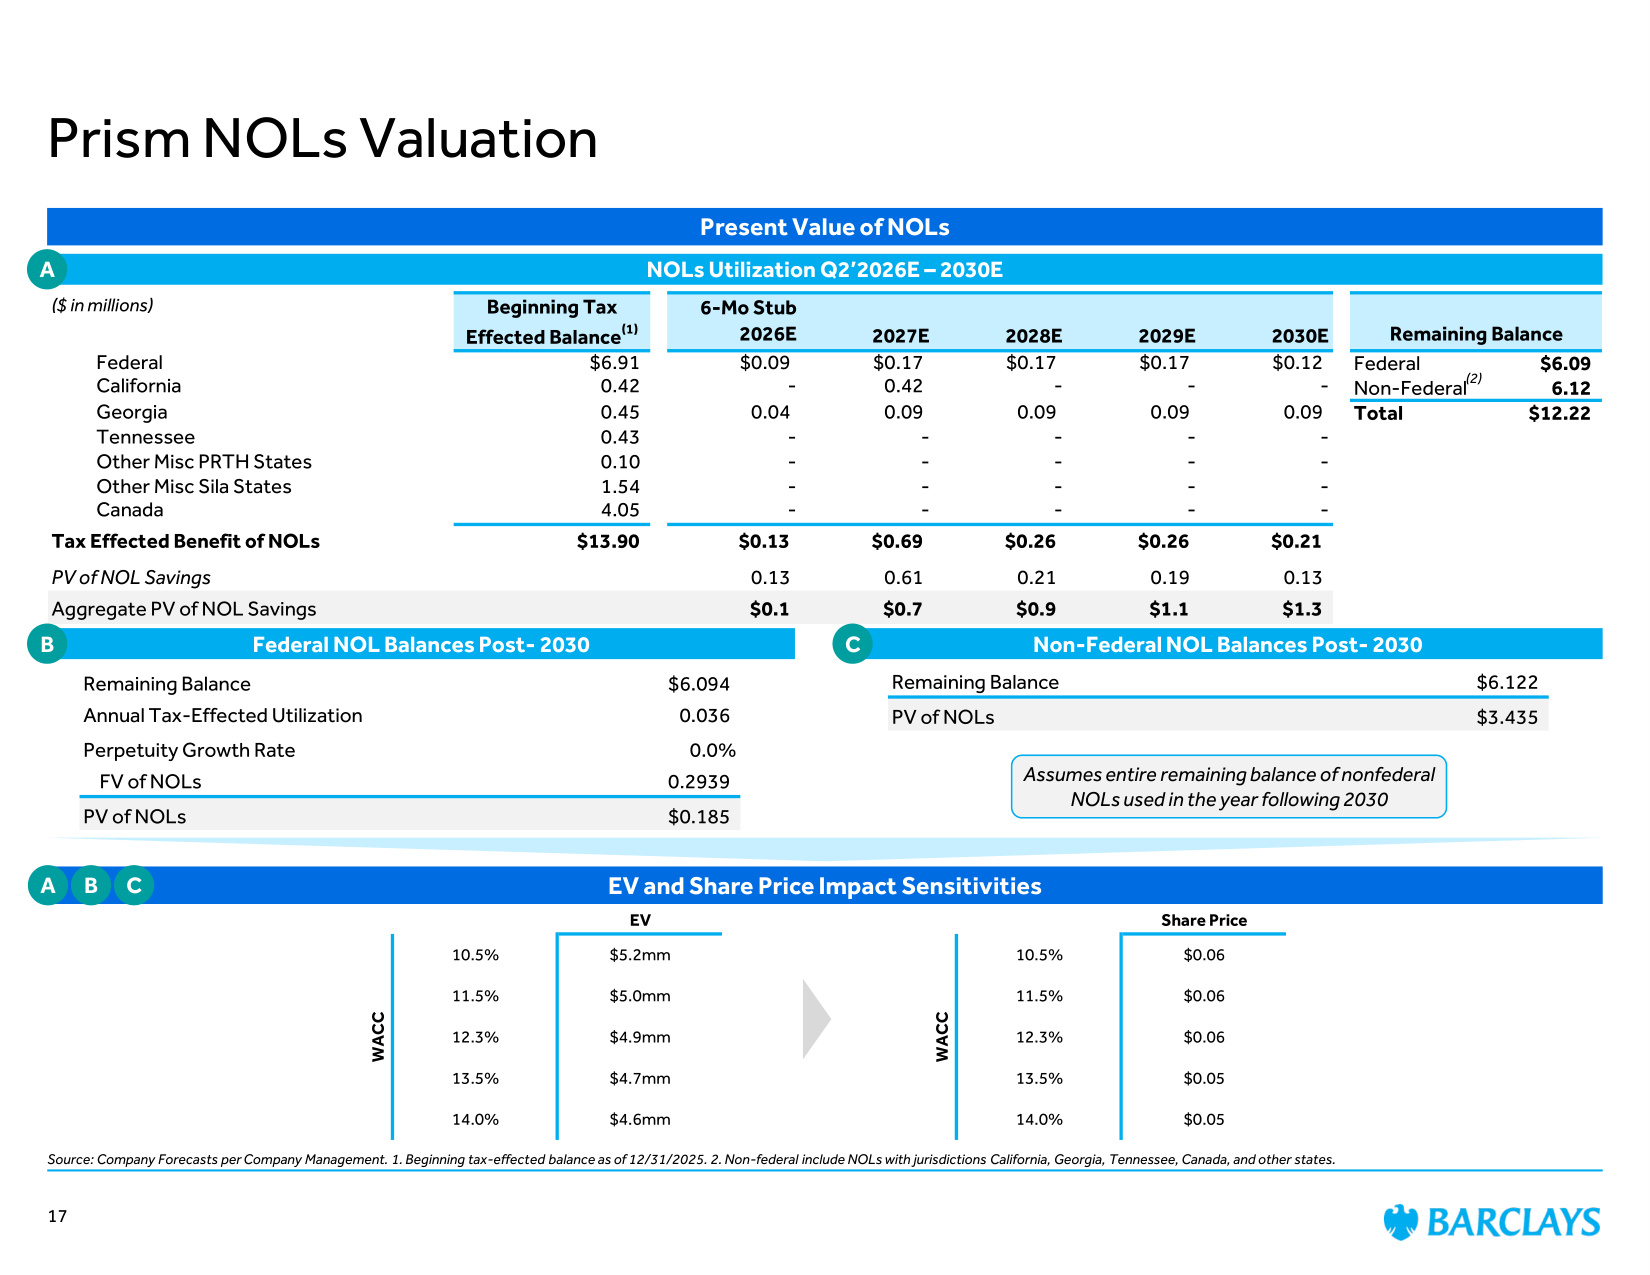
($ in millions) Beginning Tax Effected Balance(1) 6-Mo Stub 2026E 2027E 2028E 2029E 2030E Remaining Balance Federal $6.91 $0.09 $0.17 $0.17 $0.17 $0.12 Federal $6.09 California 0.42 - 0.42 - - - Non-Federal 6.12 Georgia 0.45 0.04 0.09 0.09 0.09 0.09 Total $12.22 Tennessee 0.43 - - - - - Other Misc PRTH States 0.10 - - - - - Other Misc Sila States 1.54 - - - - - Canada 4.05 - - - - - Tax Effected Benefit of NOLs $13.90 $0.13 $0.69 $0.26 $0.26 $0.21 PV of NOL Savings 0.13 0.61 0.21 0.19 0.13 Aggregate PV of NOL Savings $0.1 $0.7 $0.9 $1.1 $1.3 Present Value of NOLs EV and Share Price Impact Sensitivities Prism NOLs Valuation Source: Company Forecasts per Company Management. 1. Beginning tax-effected balance as of 12/31/2025. 2. Non-federal include NOLs with jurisdictions California, Georgia, Tennessee, Canada, and other states. Remaining Balance $6.094 Annual Tax-Effected Utilization 0.036 Perpetuity Growth Rate 0.0% FV of NOLs 0.2939 PV of NOLs $0.185 NOLs Utilization Q2'2026E – 2030E Federal NOL Balances Post- 2030 Non-Federal NOL Balances Post- 2030 Remaining Balance $6.122 PV of NOLs $3.435 EV Share Price 10.5% $5.2mm 10.5% $0.06 11.5% $5.0mm 11.5% $0.06 12.3% $4.9mm 12.3% $0.06 13.5% $4.7mm 13.5% $0.05 14.0% $4.6mm 14.0% $0.05 WACC WACC Assumes entire remaining balance of nonfederal NOLs used in the year following 2030 A B C A B C (2) 17
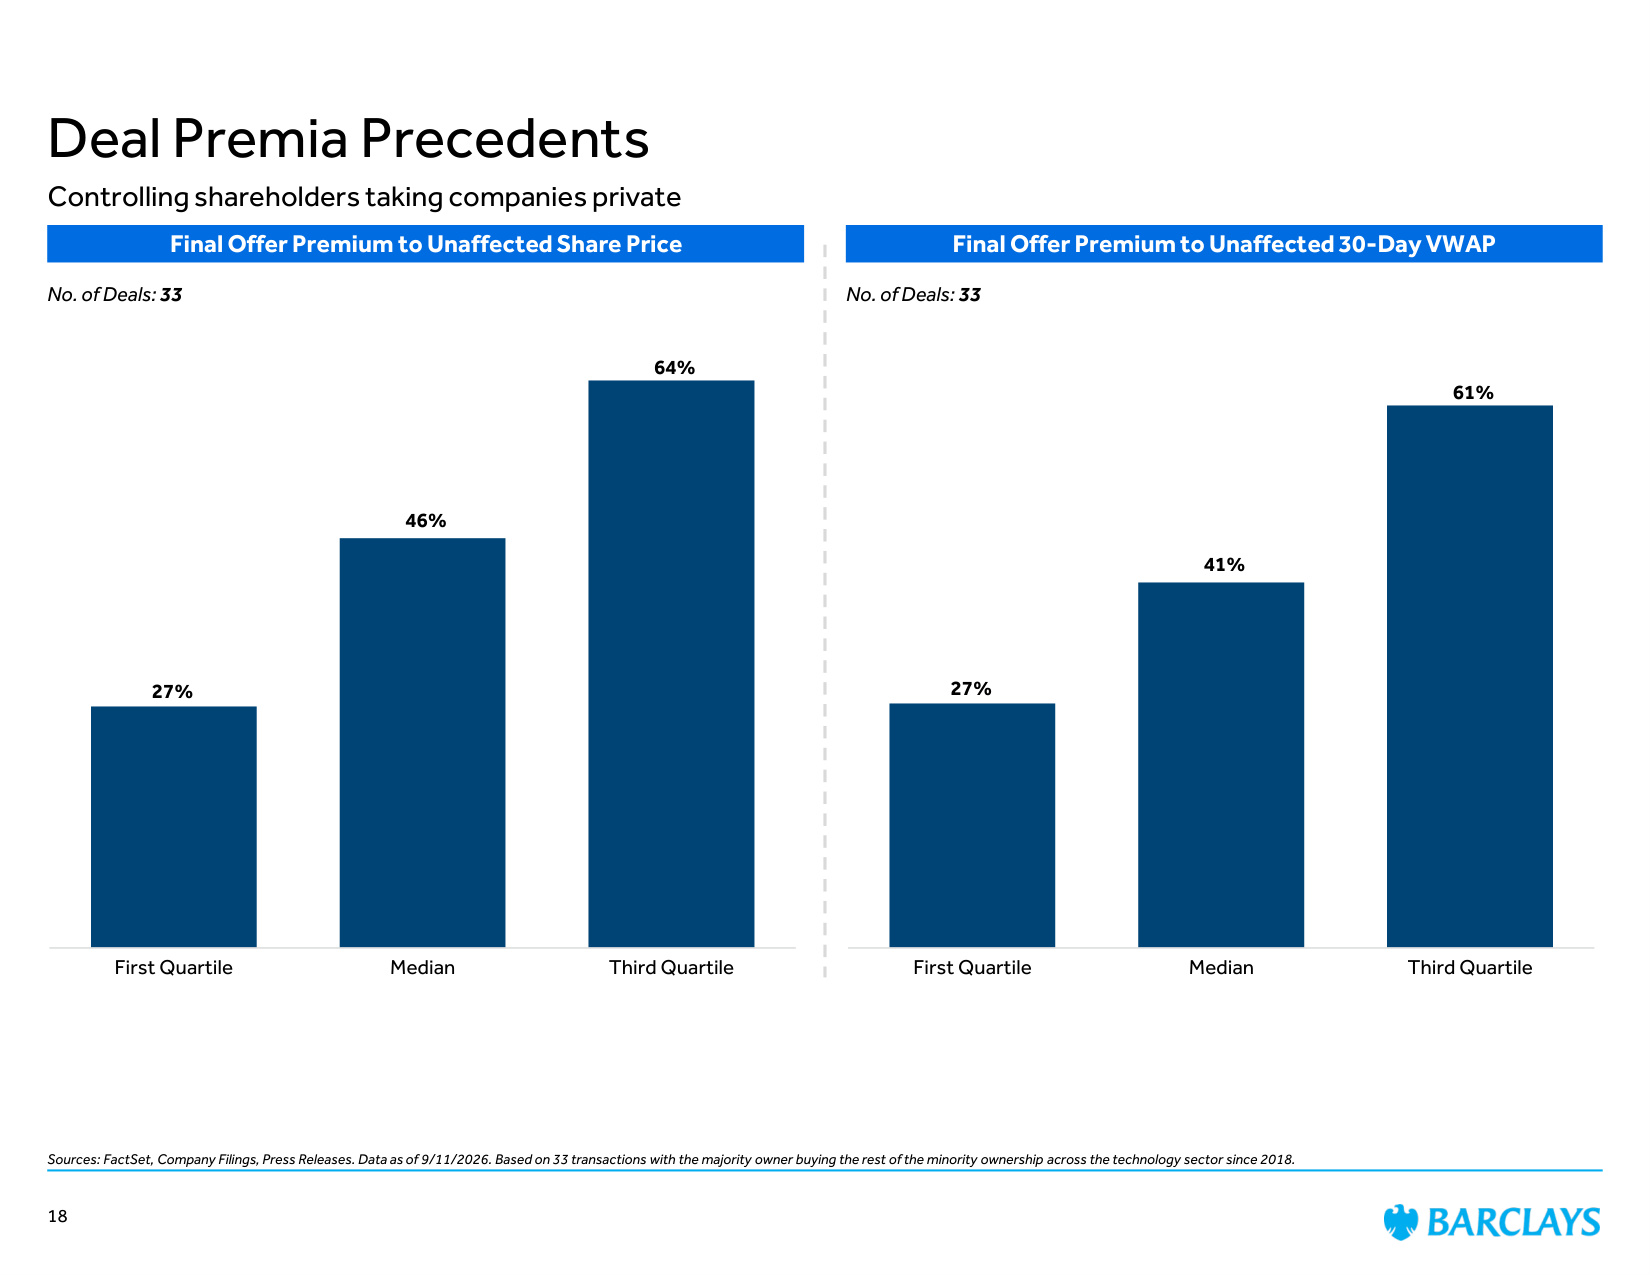
Sources: FactSet, Company Filings, Press Releases. Data as of 9/11/2026. Based on 33 transactions with the majority owner buying the rest of the minority ownership across the technology sector since 2018. Controlling shareholders taking companies private 18 Deal Premia Precedents 27% 46% 64% First Quartile Median Third Quartile Final Offer Premium to Unaffected Share Price No. of Deals: 33 Final Offer Premium to Unaffected 30-Day VWAP 27% 41% 61% First Quartile Median Third Quartile No. of Deals: 33
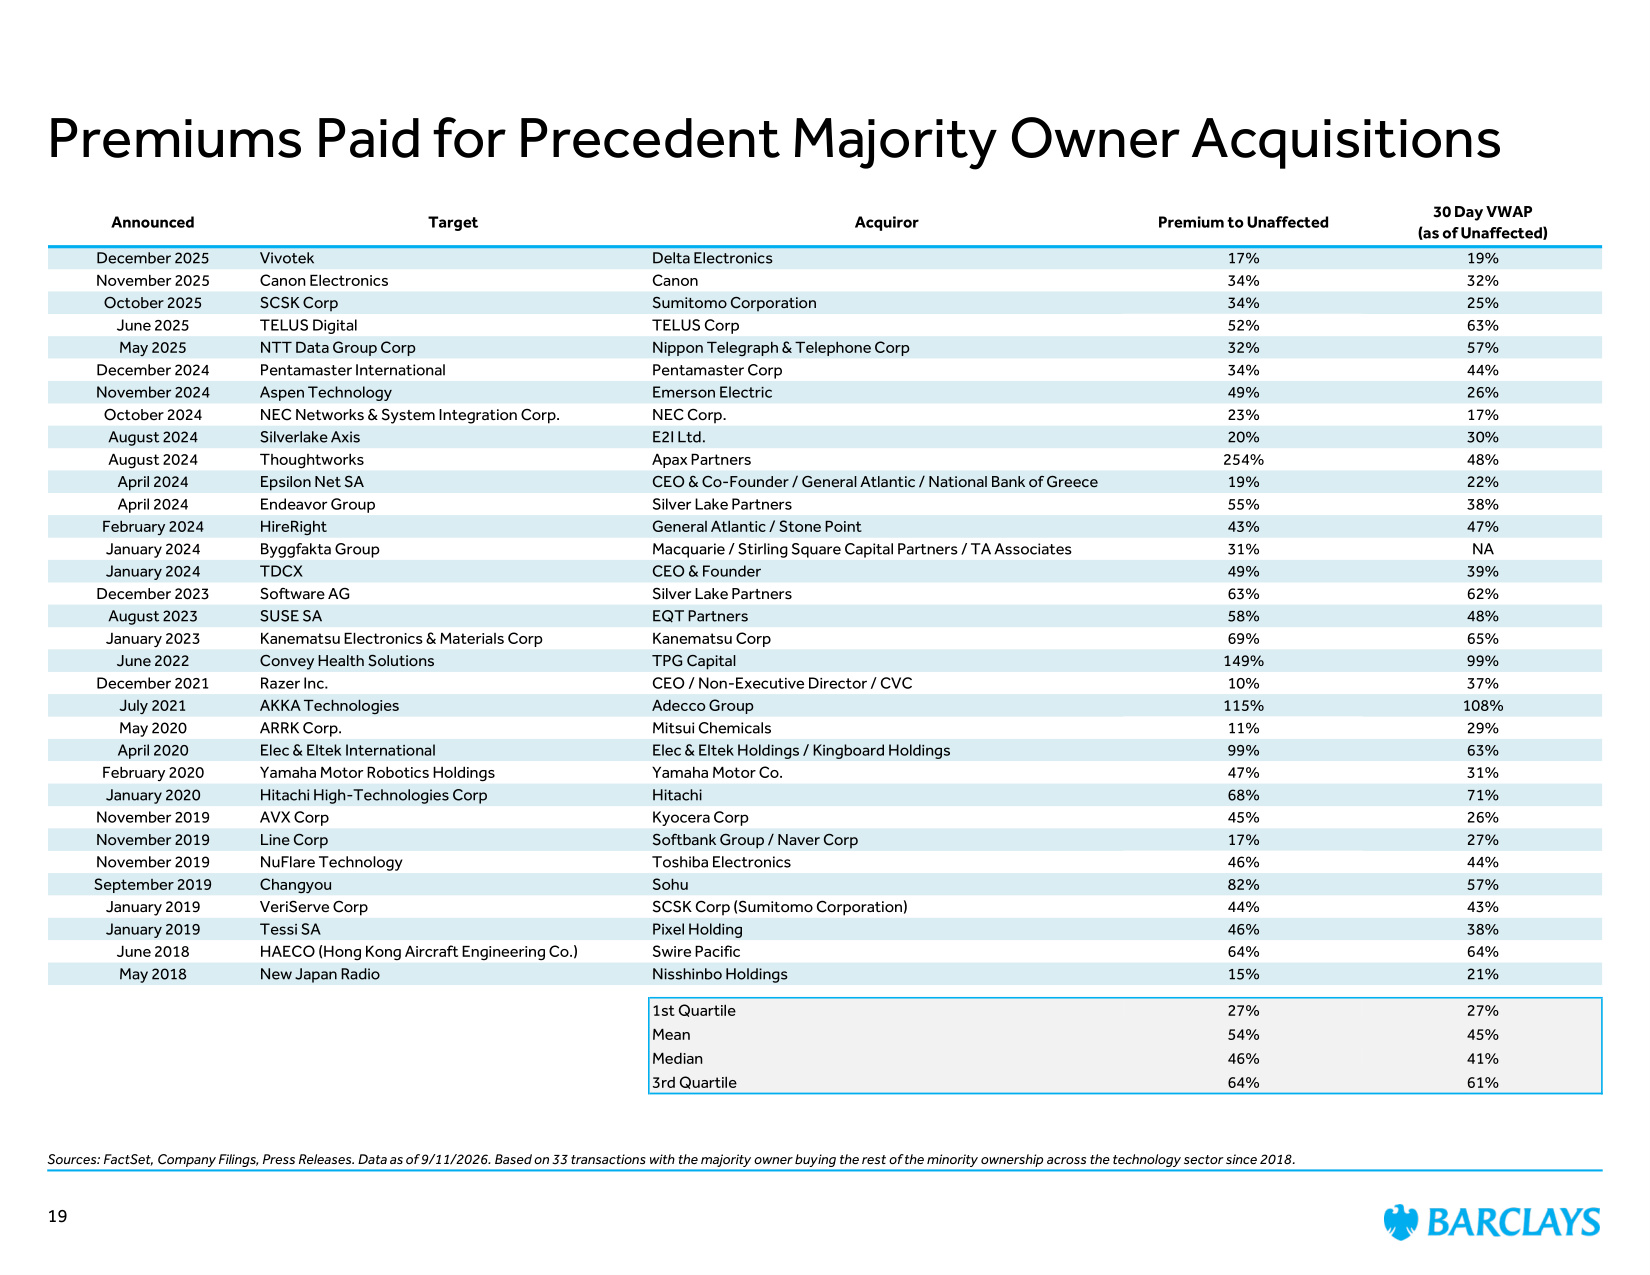
Sources: FactSet, Company Filings, Press Releases. Data as of 9/11/2026. Based on 33 transactions with the majority owner buying the rest of the minority ownership across the technology sector since 2018. Premiums Paid for Precedent Majority Owner Acquisitions 19 Announced Target Acquiror Premium to Unaffected 30 Day VWAP (as of Unaffected) December 2025 Vivotek Delta Electronics 17% 19% November 2025 Canon Electronics Canon 34% 32% October 2025 SCSK Corp Sumitomo Corporation 34% 25% June 2025 TELUS Digital TELUS Corp 52% 63% May 2025 NTT Data Group Corp Nippon Telegraph & Telephone Corp 32% 57% December 2024 Pentamaster International Pentamaster Corp 34% 44% November 2024 Aspen Technology Emerson Electric 49% 26% October 2024 NEC Networks & System Integration Corp. NEC Corp. 23% 17% August 2024 Silverlake Axis E2I Ltd. 20% 30% August 2024 Thoughtworks Apax Partners 254% 48% April 2024 Epsilon Net SA CEO & Co-Founder / General Atlantic / National Bank of Greece 19% 22% April 2024 Endeavor Group Silver Lake Partners 55% 38% February 2024 HireRight General Atlantic / Stone Point 43% 47% January 2024 Byggfakta Group Macquarie / Stirling Square Capital Partners / TA Associates 31% NA January 2024 TDCX CEO & Founder 49% 39% December 2023 Software AG Silver Lake Partners 63% 62% August 2023 SUSE SA EQT Partners 58% 48% January 2023 Kanematsu Electronics & Materials Corp Kanematsu Corp 69% 65% June 2022 Convey Health Solutions TPG Capital 149% 99% December 2021 Razer Inc. CEO / Non-Executive Director / CVC 10% 37% July 2021 AKKA Technologies Adecco Group 115% 108% May 2020 ARRK Corp. Mitsui Chemicals 11% 29% April 2020 Elec & Eltek International Elec & Eltek Holdings / Kingboard Holdings 99% 63% February 2020 Yamaha Motor Robotics Holdings Yamaha Motor Co. 47% 31% January 2020 Hitachi High-Technologies Corp Hitachi 68% 71% November 2019 AVX Corp Kyocera Corp 45% 26% November 2019 Line Corp Softbank Group / Naver Corp 17% 27% November 2019 NuFlare Technology Toshiba Electronics 46% 44% September 2019 Changyou Sohu 82% 57% January 2019 VeriServe Corp SCSK Corp (Sumitomo Corporation) 44% 43% January 2019 Tessi SA Pixel Holding 46% 38% June 2018 HAECO (Hong Kong Aircraft Engineering Co.) Swire Pacific 64% 64% May 2018 New Japan Radio Nisshinbo Holdings 15% 21% 1st Quartile 27% 27% Mean 54% 45% Median 46% 41% 3rd Quartile 64% 61%
The following pages contain material that was provided to the Board of Directors (the "Board") of Prism (the "Company") by Barclays Capital Inc. ("Barclays"). The accompanying material and any Barclays presentation related to the material was compiled or prepared on a confidential basis solely for consideration by the Board and no part of it may be reproduced, distributed or transmitted without the prior written consent of Barclays. The information contained in this material was obtained from the Company and/or publicly available sources, and Barclays has relied upon such information without independent verification thereof and does not assume any liability for any such information. These materials are being provided in connection with an actual corporate engagement and may not be used or relied upon for any purpose other than as specifically contemplated by a written agreement with Barclays. Moreover, any information provided herein was not prepared for or intended for use by any individual for personal, family or household purposes. Any estimates, historical financial information, projections and other information contained herein have been prepared by management of the Company or were obtained from publicly available sources (approved for Barclays' use by the Company) or are based upon such estimates and projections. With respect to such estimates and projections, Barclays has assumed that they have been reasonably prepared on a basis reflecting the best currently available estimates, projections and judgment of the management of the Company. The projections contained herein may or may not be achieved and differences between projected results and those actually achieved may be material. No representation or warranty, expressed or implied, is made as to the accuracy or completeness of such information and nothing contained herein is, or shall be relied upon as, a promise or representation, whether as to the past or the future. The analysis contained herein is based on current market conditions which are subject to change and Barclays assumes no obligation to update or otherwise revise these materials. Nothing in these materials shall be deemed to constitute a recommendation or investment, legal, tax, financial, accounting or other advice. Because these materials were prepared for use in the context of a presentation to the Board, these materials are incomplete without reference to, and should be assessed solely in conjunction with, the oral briefing provided by Barclays to the Board (in their capacity as directors and not in any individual capacity and is not for the benefit of any individual, including any individual officer, director, shareholder or any other person). These materials were not prepared for or intended for use by any individual for personal, family or household purposes nor were they prepared to comply with the disclosure standards under state and federal securities laws or any other applicable laws and, to the extent the material may be considered by readers not as familiar with the business and affairs of the Company as the Board, none of the Company, Barclays, their respective affiliates or any of their respective legal or financial advisors or accountants takes any responsibility for the accuracy or completeness of any of the material if used by persons other than the Board. These materials are not intended to provide the sole basis for evaluation of the proposed corporate transaction and do not purport to contain all information that may be required and should not be considered a recommendation with respect to the proposed corporate transaction. Barclays has not made or obtained any evaluations or appraisals of the assets or liabilities of the Company or any other party to any corporate transaction or any of their respective affiliates and has no obligation to evaluate the solvency of the Company or any other party to any transaction under any state or federal laws relating to bankruptcy, insolvency or similar matters. The analyses contained herein do not purport to be appraisals nor do they necessarily reflect the prices at which businesses or securities actually may be sold or purchased. Barclays' role in any due diligence review is limited solely to performing such a review as it shall deem necessary to support its own advice and analysis and shall not be on behalf of the Company, the Board or any individual officer, director, shareholder or any other person. Barclays, its subsidiaries and affiliates engage in a wide range of businesses from investment and commercial banking, lending, asset management and other financial and non-financial services. In the ordinary course of its business, Barclays and its affiliates may actively trade and effect transactions in the equity, debt and/or other securities (and any derivatives thereof) and financial instruments (including loans and other obligations) of the Company for its own account and for the accounts of its customers and, accordingly, may at any time hold long or short positions and investments in such securities and financial instruments or in other financial products and instruments. Unless otherwise expressly agreed or provided for in other applicable Barclays disclosures governing such corporate transactions or required by law or regulation, Barclays conducts these activities as principal and executes its principal transactions as an arm's length counterparty. Barclays does not act as a fiduciary in relation to these corporate transactions. These materials do not constitute investment advice nor do they form part of an offer to sell or purchase, or the solicitation of an offer to sell or purchase, any securities or any of the businesses or assets described herein or an offer of financing or an offer or recommendation to enter into any corporate transaction described herein. Barclays Capital Inc. is the United States investment bank of Barclays Bank PLC. Barclays Bank PLC is authorised by the Prudential Regulation Authority and regulated by the Financial Conduct Authority and the Prudential Regulation Authority (Financial Services Register No. 122702). Registered in England. Registered No. 1026167. Registered office: 1 Churchill Place, London E14 5HP. Neither Barclays Bank PLC, New York Branch nor Barclays Bank Delaware is responsible for the obligations of its affiliates. Copyright Barclays Bank PLC, 2026 (all rights reserved). Disclaimer 20
Exhibit (C)(10)
Project Prism: Valuation Analysis September 2026
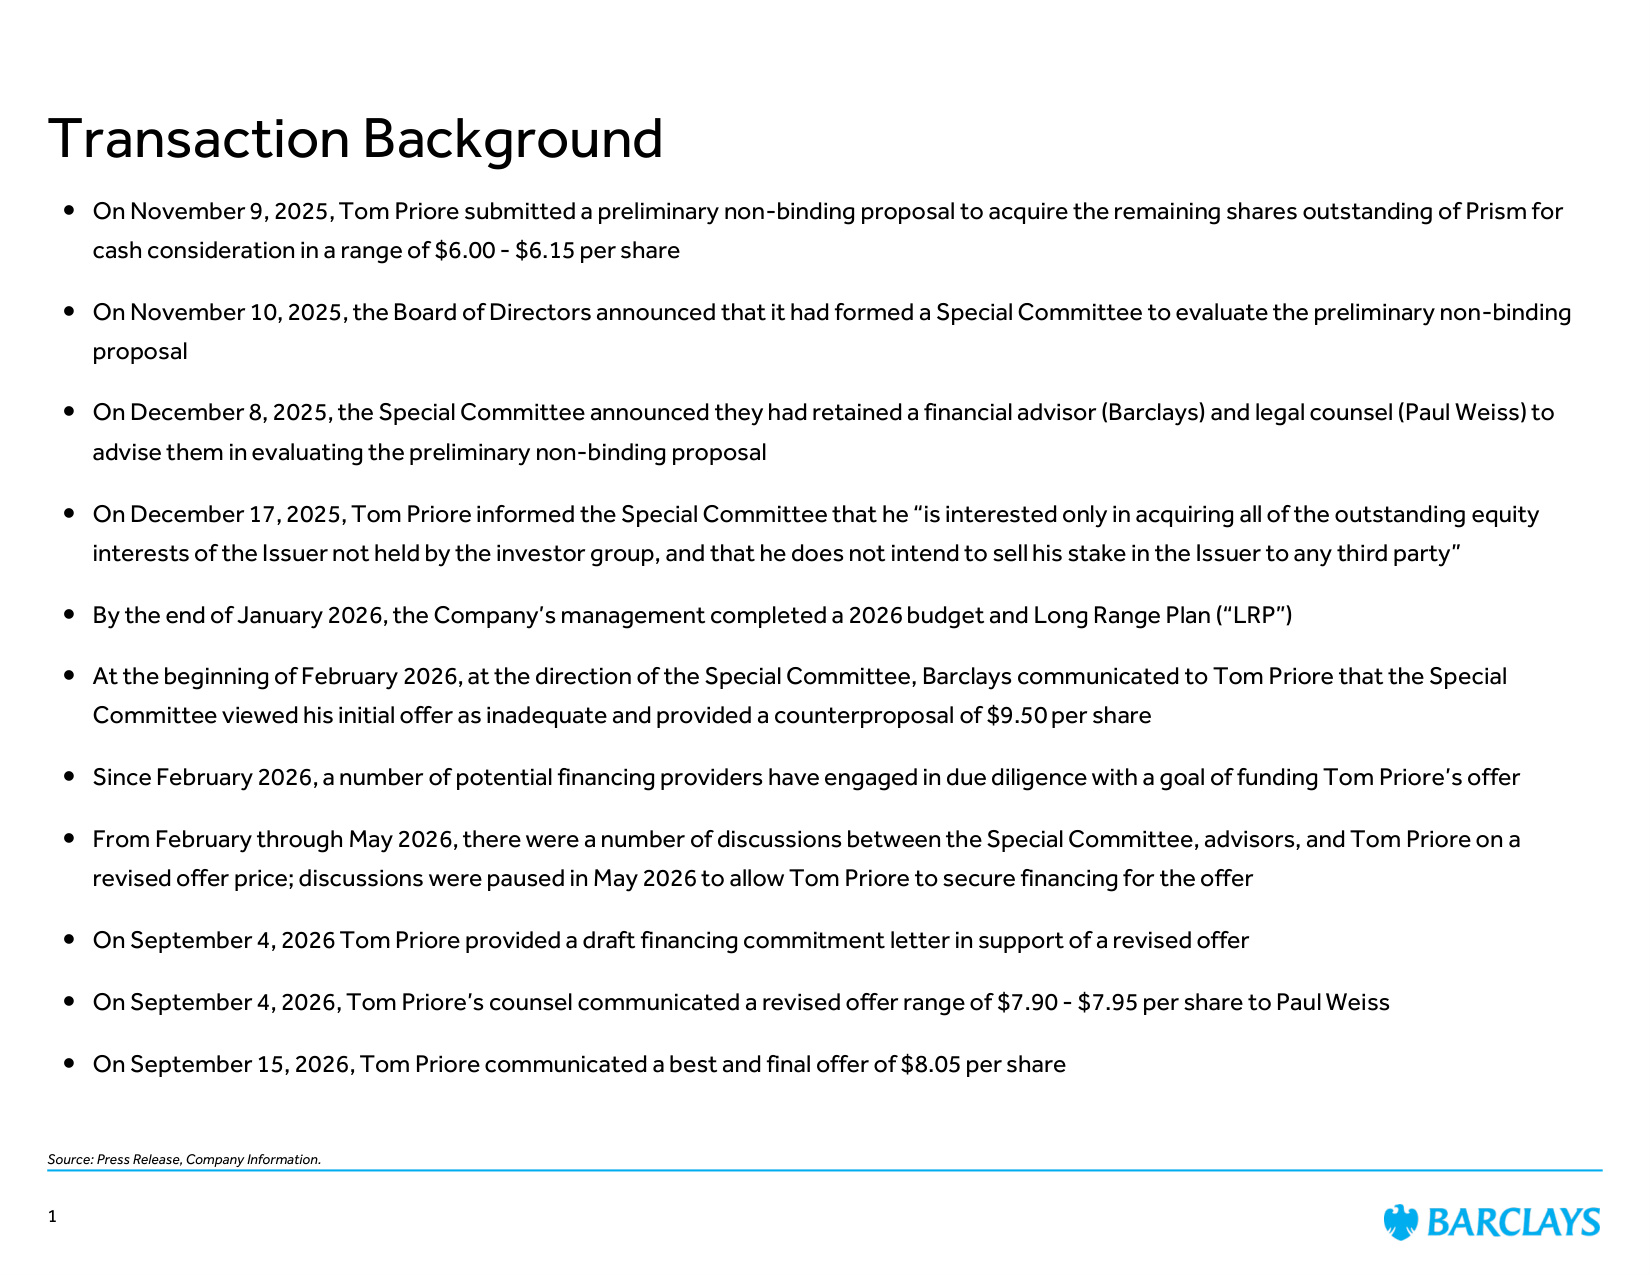
Source: Press Release, Company Information. Transaction Background On November 9, 2025, Tom Priore submitted a preliminary non-binding proposal to acquire the remaining shares outstanding of Prism for cash consideration in a range of $6.00 - $6.15 per share On November 10, 2025, the Board of Directors announced that it had formed a Special Committee to evaluate the preliminary non-binding proposal On December 8, 2025, the Special Committee announced they had retained a financial advisor (Barclays) and legal counsel (Paul Weiss) to advise them in evaluating the preliminary non-binding proposal On December 17, 2025, Tom Priore informed the Special Committee that he "is interested only in acquiring all of the outstanding equity interests of the Issuer not held by the investor group, and that he does not intend to sell his stake in the Issuer to any third party" By the end of January 2026, the Company's management completed a 2026 budget and Long Range Plan ("LRP") At the beginning of February 2026, at the direction of the Special Committee, Barclays communicated to Tom Priore that the Special Committee viewed his initial offer as inadequate and provided a counterproposal of $9.50 per share Since February 2026, a number of potential financing providers have engaged in due diligence with a goal of funding Tom Priore's offer From February through May 2026, there were a number of discussions between the Special Committee, advisors, and Tom Priore on a revised offer price; discussions were paused in May 2026 to allow Tom Priore to secure financing for the offer On September 4, 2026 Tom Priore provided a draft financing commitment letter in support of a revised offer On September 4, 2026, Tom Priore's counsel communicated a revised offer range of $7.90 - $7.95 per share to Paul Weiss On September 15, 2026, Tom Priore communicated a best and final offer of $8.05 per share 1
Contents 1. Market Backdrop and Trading Performance 2. Review of Company Financials & Forecasts 3. Valuation Perspectives 4. Appendix
Market Backdrop and Trading Performance
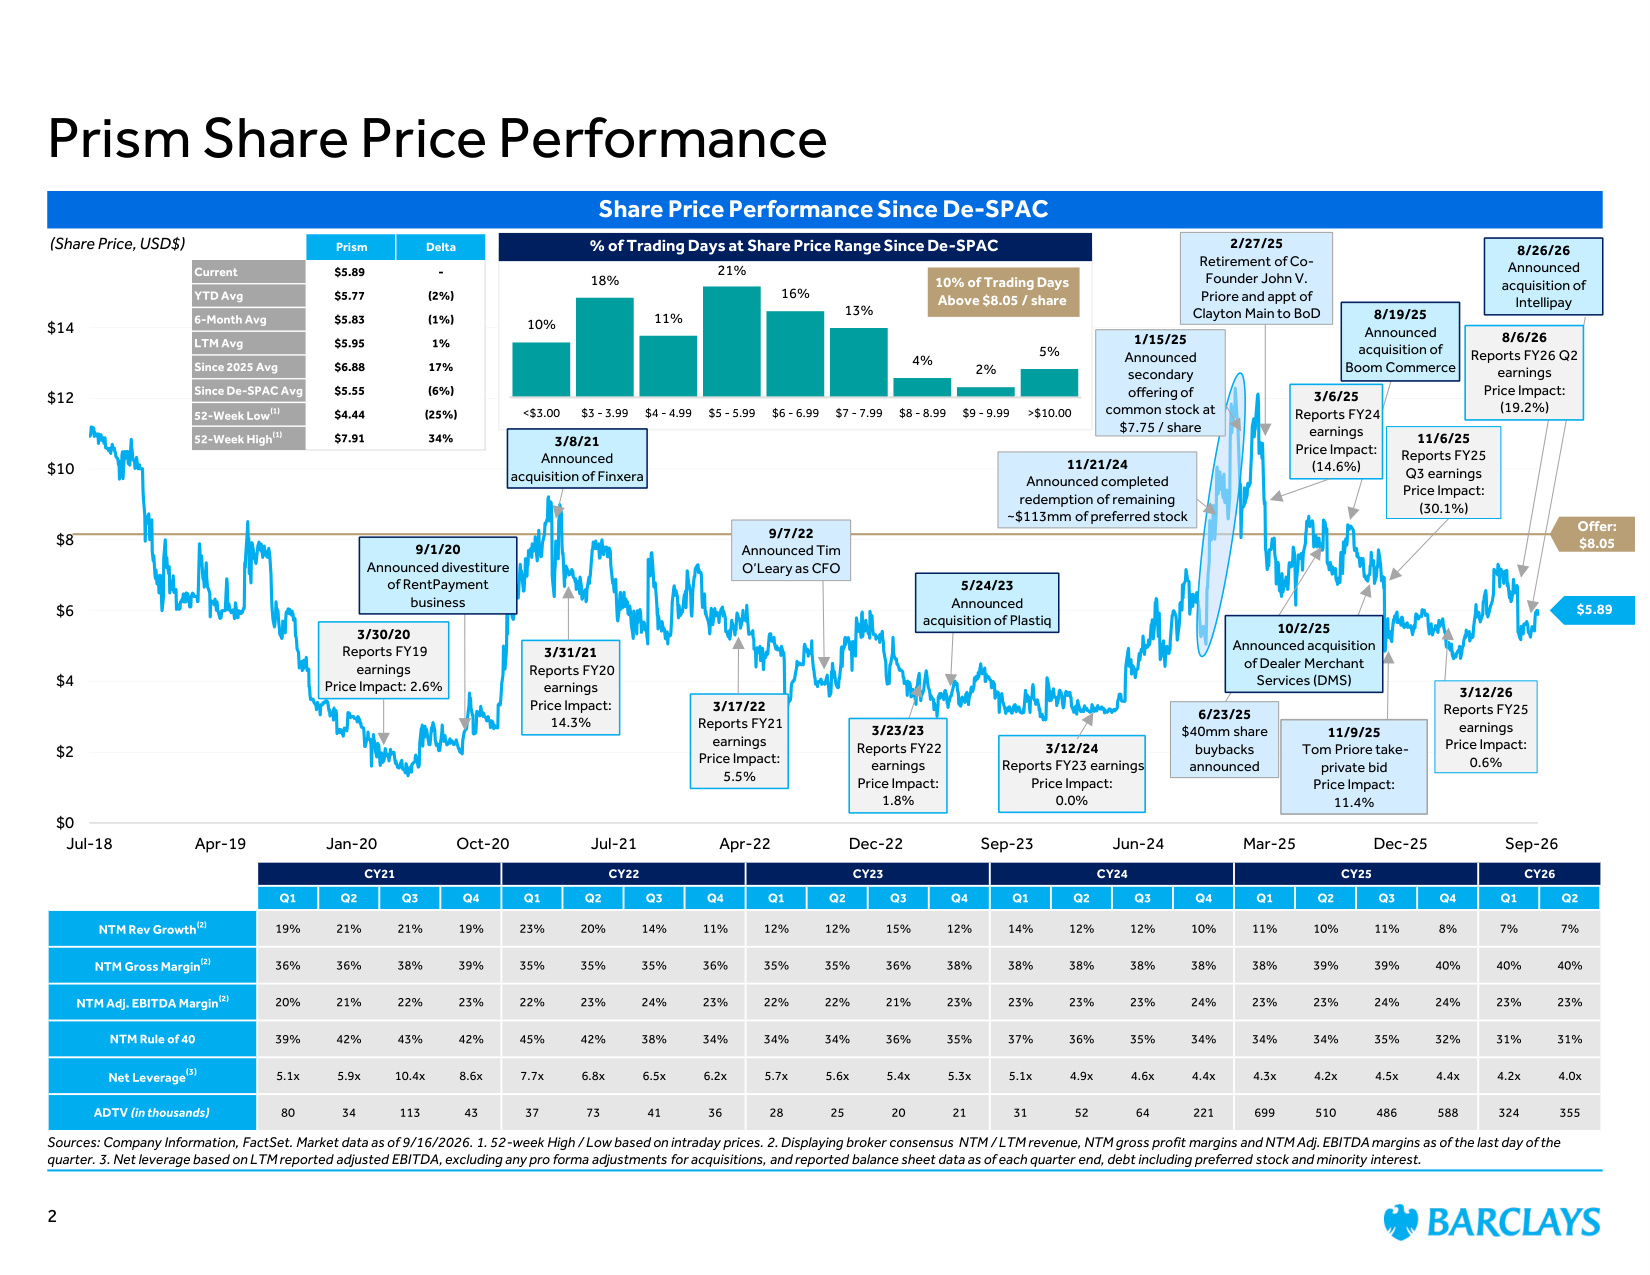
Offer: $8.05 $0 $2 $4 $6 $8 $10 $12 $14 Jul-18 Apr-19 Jan-20 Oct-20 Jul-21 Apr-22 Dec-22 Sep-23 Jun-24 Mar-25 Dec-25 Sep-26 Sources: Company Information, FactSet. Market data as of 9/16/2026. 1. 52-week High / Low based on intraday prices. 2. Displaying broker consensus NTM / LTM revenue, NTM gross profit margins and NTM Adj. EBITDA margins as of the last day of the quarter. 3. Net leverage based on LTM reported adjusted EBITDA, excluding any pro forma adjustments for acquisitions, and reported balance sheet data as of each quarter end, debt including preferred stock and minority interest. Prism Share Price Performance Share Price Performance Since De-SPAC (Share Price, USD$) 6/23/25 $40mm share buybacks announced 3/17/22 Reports FY21 earnings Price Impact: 5.5% $5.89 3/12/24 Reports FY23 earnings Price Impact: 0.0% 2/27/25 Retirement of Co- Founder John V. Priore and appt of Clayton Main to BoD 2 9/7/22 Announced Tim O'Leary as CFO 5/24/23 Announced acquisition of Plastiq 8/19/25 Announced acquisition of Boom Commerce 10/2/25 Announced acquisition of Dealer Merchant Services (DMS) 3/31/21 Reports FY20 earnings Price Impact: 14.3% CY21 CY22 CY23 CY24 CY25 CY26 Q1 Q2 Q3 Q4 Q1 Q2 Q3 Q4 Q1 Q2 Q3 Q4 Q1 Q2 Q3 Q4 Q1 Q2 Q3 Q4 Q1 Q2 NTM Rev Growth(2) 19% 21% 21% 19% 23% 20% 14% 11% 12% 12% 15% 12% 14% 12% 12% 10% 11% 10% 11% 8% 7% 7% NTM Gross Margin(2) 36% 36% 38% 39% 35% 35% 35% 36% 35% 35% 36% 38% 38% 38% 38% 38% 38% 39% 39% 40% 40% 40% NTM Adj. EBITDA Margin(2) 20% 21% 22% 23% 22% 23% 24% 23% 22% 22% 21% 23% 23% 23% 23% 24% 23% 23% 24% 24% 23% 23% NTM Rule of 40 39% 42% 43% 42% 45% 42% 38% 34% 34% 34% 36% 35% 37% 36% 35% 34% 34% 34% 35% 32% 31% 31% Net Leverage(3) 5.1x 5.9x 10.4x 8.6x 7.7x 6.8x 6.5x 6.2x 5.7x 5.6x 5.4x 5.3x 5.1x 4.9x 4.6x 4.4x 4.3x 4.2x 4.5x 4.4x 4.2x 4.0x ADTV (in thousands) 80 34 113 43 37 73 41 36 28 25 20 21 31 52 64 221 699 510 486 588 324 355 Prism Delta Current $5.89 - YTD Avg $5.77 (2%) 6-Month Avg $5.83 (1%) LTM Avg $5.95 1% Since 2025 Avg $6.88 17% Since De-SPAC Avg $5.55 (6%) 52-Week Low(1) $4.44 (25%) 52-Week High(1) $7.91 34% 3/30/20 Reports FY19 earnings Price Impact: 2.6% 9/1/20 Announced divestiture of RentPayment business 10% 18% 11% 21% 16% 13% 4% 2% 5% <$3.00 $3 - 3.99 $4 - 4.99 $5 - 5.99 $6 - 6.99 $7 - 7.99 $8 - 8.99 $9 - 9.99 >$10.00 % of Trading Days at Share Price Range Since De-SPAC 3/6/25 Reports FY24 earnings Price Impact: (14.6%) 11/6/25 Reports FY25 Q3 earnings Price Impact: (30.1%) 11/9/25 Tom Priore take- private bid Price Impact: 11.4% 3/12/26 Reports FY25 earnings Price Impact: 0.6% 3/8/21 Announced acquisition of Finxera 1/15/25 Announced secondary offering of common stock at $7.75 / share 11/21/24 Announced completed redemption of remaining ~$113mm of preferred stock 10% of Trading Days Above $8.05 / share 8/26/26 Announced acquisition of Intellipay 8/6/26 Reports FY26 Q2 earnings Price Impact: (19.2%) 3/23/23 Reports FY22 earnings Price Impact: 1.8%
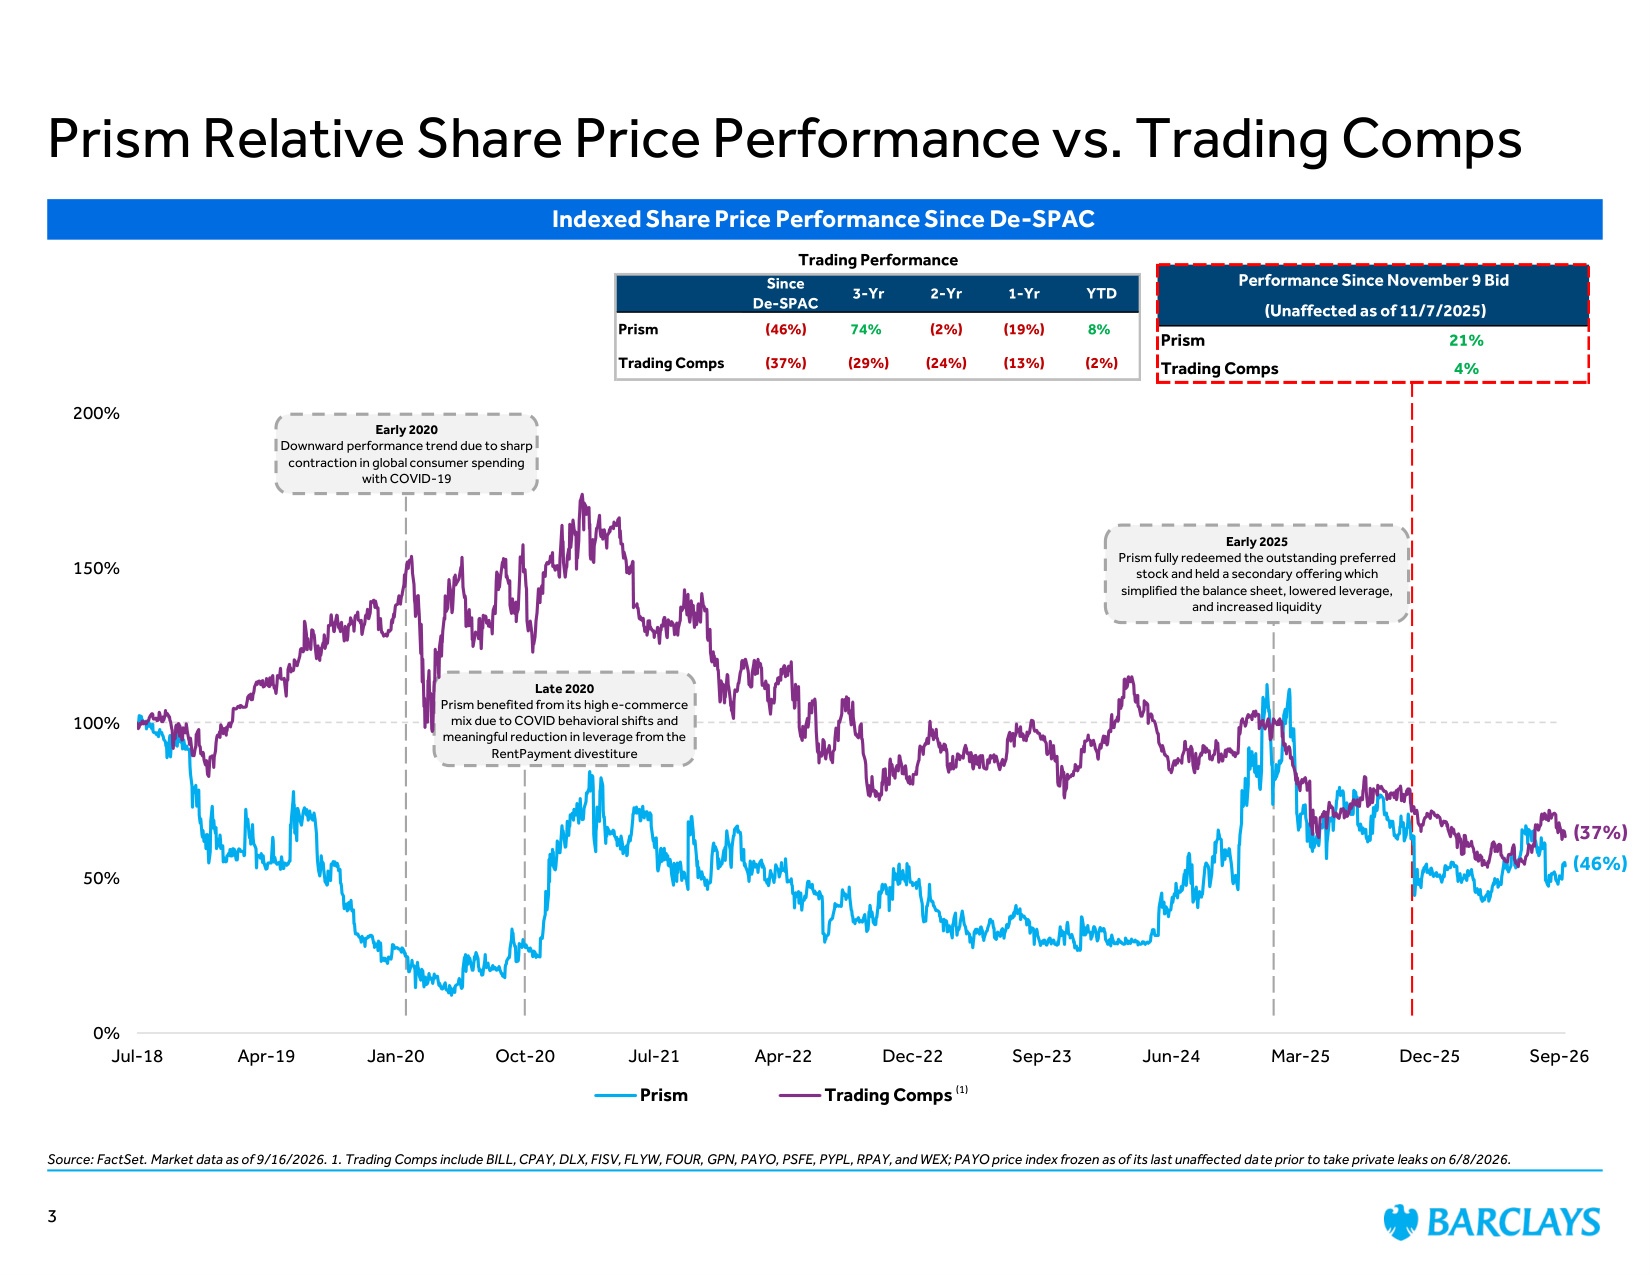
Indexed Share Price Performance Since De-SPAC (37%) (46%) (1) Performance Since November 9 Bid (Unaffected as of 11/7/2025) Prism 21% Trading Comps 4% Trading Performance Since De-SPAC 3-Yr 2-Yr 1-Yr YTD Prism (46%) 74% (2%) (19%) 8% Trading Comps (37%) (29%) (24%) (13%) (2%) Prism Relative Share Price Performance vs. Trading Comps Source: FactSet. Market data as of 9/16/2026. 1. Trading Comps include BILL, CPAY, DLX, FISV, FLYW, FOUR, GPN, PAYO, PSFE, PYPL, RPAY, and WEX; PAYO price index frozen as of its last unaffected date prior to take private leaks on 6/8/2026. Early 2020 Downward performance trend due to sharp contraction in global consumer spending with COVID-19 Early 2025 Prism fully redeemed the outstanding preferred stock and held a secondary offering which simplified the balance sheet, lowered leverage, and increased liquidity Late 2020 Prism benefited from its high e-commerce mix due to COVID behavioral shifts and meaningful reduction in leverage from the RentPayment divestiture 0% 50% 100% 150% 200% Jul-18 Apr-19 Jan-20 Oct-20 Jul-21 Apr-22 Dec-22 Sep-23 Jun-24 Mar-25 Dec-25 Sep-26 Prism Trading Comps 3
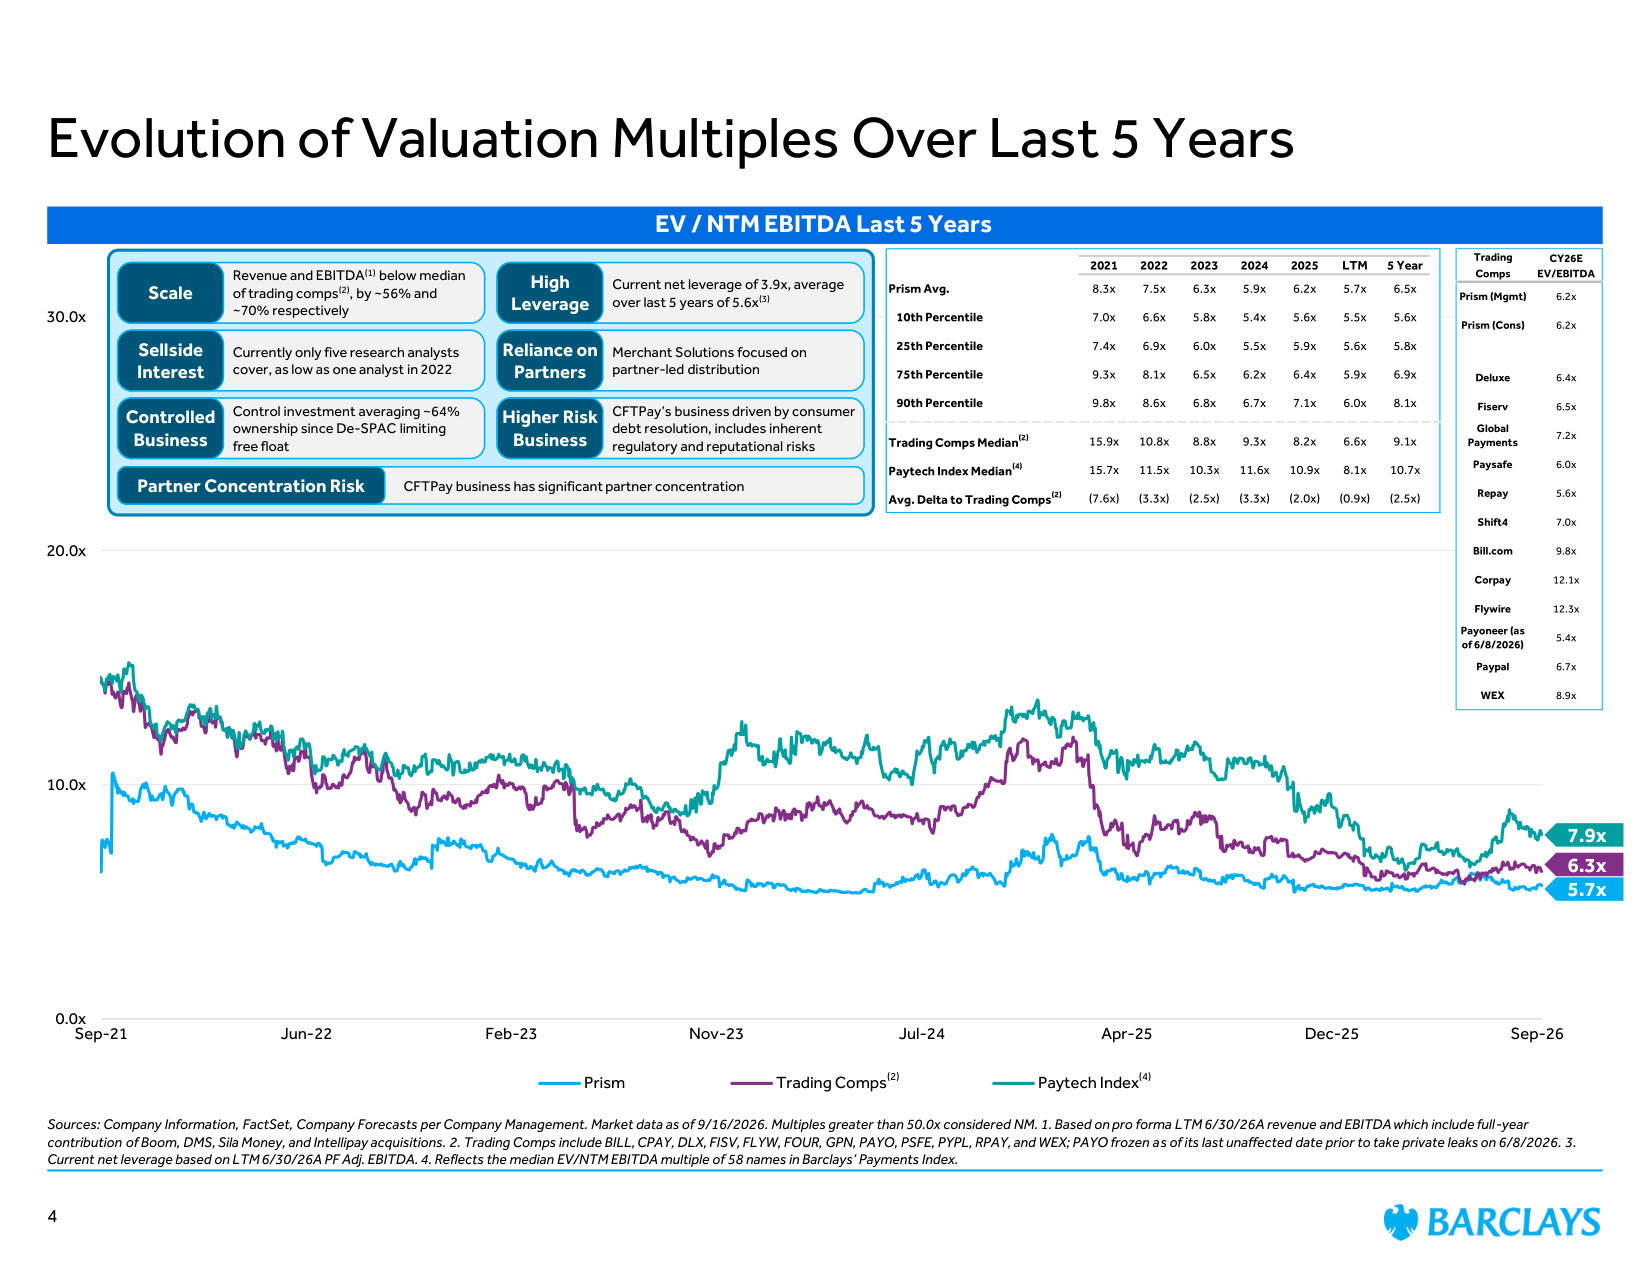
Sources: Company Information, FactSet, Company Forecasts per Company Management. Market data as of 9/16/2026. Multiples greater than 50.0x considered NM. 1. Based on pro forma LTM 6/30/26A revenue and EBITDA which include full-year contribution of Boom, DMS, Sila Money, and Intellipay acquisitions. 2. Trading Comps include BILL, CPAY, DLX, FISV, FLYW, FOUR, GPN, PAYO, PSFE, PYPL, RPAY, and WEX; PAYO frozen as of its last unaffected date prior to take private leaks on 6/8/2026. 3. Current net leverage based on LTM 6/30/26A PF Adj. EBITDA. 4. Reflects the median EV/NTM EBITDA multiple of 58 names in Barclays' Payments Index. Evolution of Valuation Multiples Over Last 5 Years 5.7x (2) 6.3x 7.9x (4) 0.0x 10.0x 20.0x 30.0x Sep-21 Jun-22 Feb-23 Nov-23 Jul-24 Apr-25 Dec-25 Sep-26 Prism Trading Comps Paytech Index EV / NTM EBITDA Last 5 Years 2021 2022 2023 2024 2025 LTM 5 Year Prism Avg. 8.3x 7.5x 6.3x 5.9x 6.2x 5.7x 6.5x 10th Percentile 7.0x 6.6x 5.8x 5.4x 5.6x 5.5x 5.6x 25th Percentile 7.4x 6.9x 6.0x 5.5x 5.9x 5.6x 5.8x 75th Percentile 9.3x 8.1x 6.5x 6.2x 6.4x 5.9x 6.9x 90th Percentile 9.8x 8.6x 6.8x 6.7x 7.1x 6.0x 8.1x Trading Comps Median(2) 15.9x 10.8x 8.8x 9.3x 8.2x 6.6x 9.1x Paytech Index Median(4) 15.7x 11.5x 10.3x 11.6x 10.9x 8.1x 10.7x Avg. Delta to Trading Comps(2) (7.6x) (3.3x) (2.5x) (3.3x) (2.0x) (0.9x) (2.5x) Control investment averaging ~64% ownership since De-SPAC limiting free float Controlled Business Current net leverage of 3.9x, average over last 5 years of 5.6x(3) High Leverage Currently only five research analysts cover, as low as one analyst in 2022 Sellside Interest Merchant Solutions focused on partner-led distribution Reliance on Partners Revenue and EBITDA(1) below median of trading comps(2), by ~56% and ~70% respectively Scale CFTPay's business driven by consumer debt resolution, includes inherent regulatory and reputational risks Higher Risk Business CFTPay business has significant partner concentration Partner Concentration Risk Trading CY26E Comps EV/EBITDA Prism (Mgmt) 6.2x Prism (Cons) 6.2x Deluxe 6.4x Fiserv 6.5x Global Payments 7.2x Paysafe 6.0x Repay 5.6x Shift4 7.0x Bill.com 9.8x Corpay 12.1x Flywire 12.3x Payoneer (as of 6/8/2026) 5.4x Paypal 6.7x WEX 8.9x 4
Review of Company Financials & Forecasts
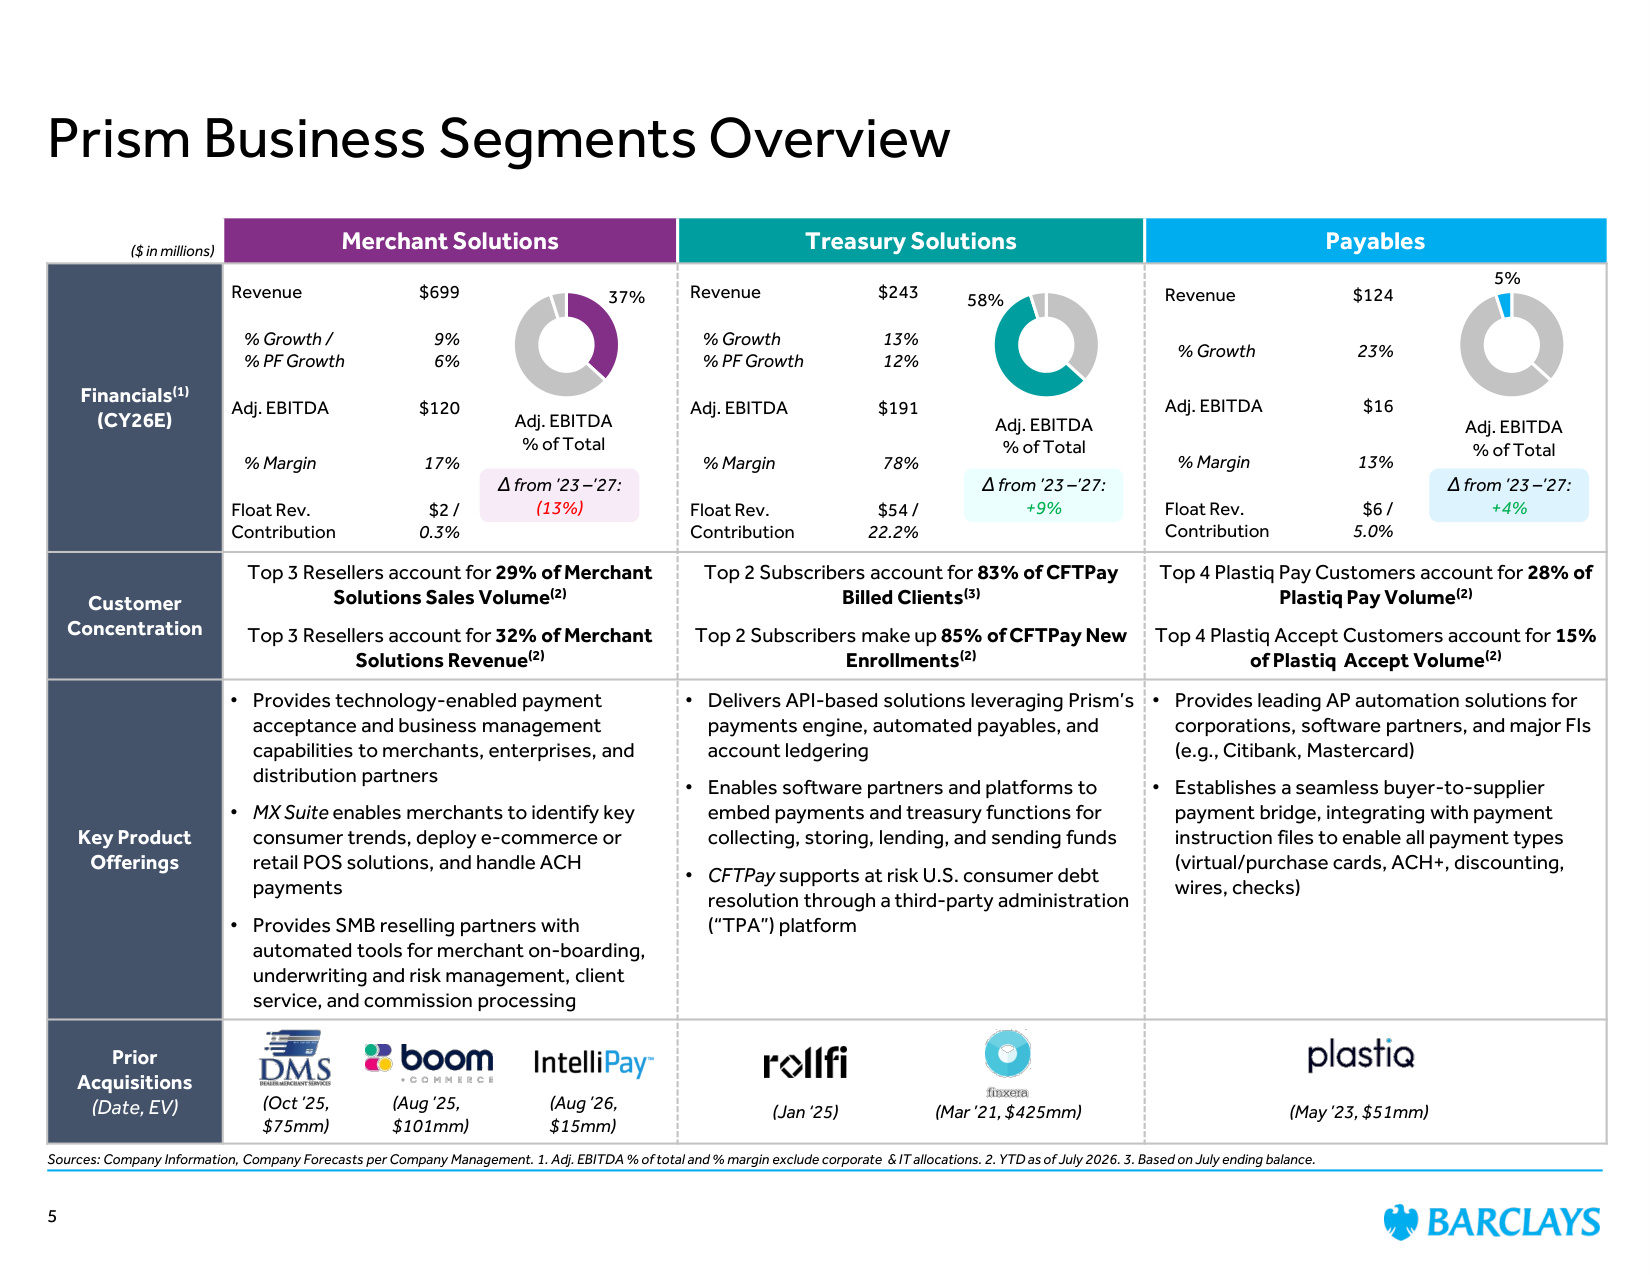
Prism Business Segments Overview Sources: Company Information, Company Forecasts per Company Management. 1. Adj. EBITDA % of total and % margin exclude corporate & IT allocations. 2. YTD as of July 2026. 3. Based on July ending balance. Merchant Solutions Treasury Solutions Payables Financials(1) (CY26E) Customer Concentration Top 3 Resellers account for 29% of Merchant Solutions Sales Volume(2) Top 3 Resellers account for 32% of Merchant Solutions Revenue(2) Top 2 Subscribers account for 83% of CFTPay Billed Clients(3) Top 2 Subscribers make up 85% of CFTPay New Enrollments(2) Top 4 Plastiq Pay Customers account for 28% of Plastiq Pay Volume(2) Top 4 Plastiq Accept Customers account for 15% of Plastiq Accept Volume(2) Key Product Offerings • Provides technology-enabled payment acceptance and business management capabilities to merchants, enterprises, and distribution partners • MX Suite enables merchants to identify key consumer trends, deploy e-commerce or retail POS solutions, and handle ACH payments • Provides SMB reselling partners with automated tools for merchant on-boarding, underwriting and risk management, client service, and commission processing • Delivers API-based solutions leveraging Prism's payments engine, automated payables, and account ledgering • Enables software partners and platforms to embed payments and treasury functions for collecting, storing, lending, and sending funds • CFTPay supports at risk U.S. consumer debt resolution through a third-party administration ("TPA") platform • Provides leading AP automation solutions for corporations, software partners, and major FIs (e.g., Citibank, Mastercard) • Establishes a seamless buyer-to-supplier payment bridge, integrating with payment instruction files to enable all payment types (virtual/purchase cards, ACH+, discounting, wires, checks) Prior Acquisitions (Date, EV) ($ in millions) 5 (Oct '25, $75mm) (Aug '25, $101mm) (Jan '25) (Mar '21, $425mm) (May '23, $51mm) 37% 58% 5% Adj. EBITDA % of Total Adj. EBITDA % of Total Adj. EBITDA % of Total Revenue $699 % Growth / % PF Growth 9% 6% Adj. EBITDA $120 % Margin 17% Float Rev. Contribution $2 / 0.3% Revenue $243 % Growth % PF Growth 13% 12% Adj. EBITDA $191 % Margin 78% Float Rev. Contribution $54 / 22.2% Revenue $124 % Growth 23% Adj. EBITDA $16 % Margin 13% Float Rev. Contribution $6 / 5.0% Δ from '23 –'27: (13%) Δ from '23 –'27: +9% Δ from '23 –'27: +4% (Aug '26, $15mm)
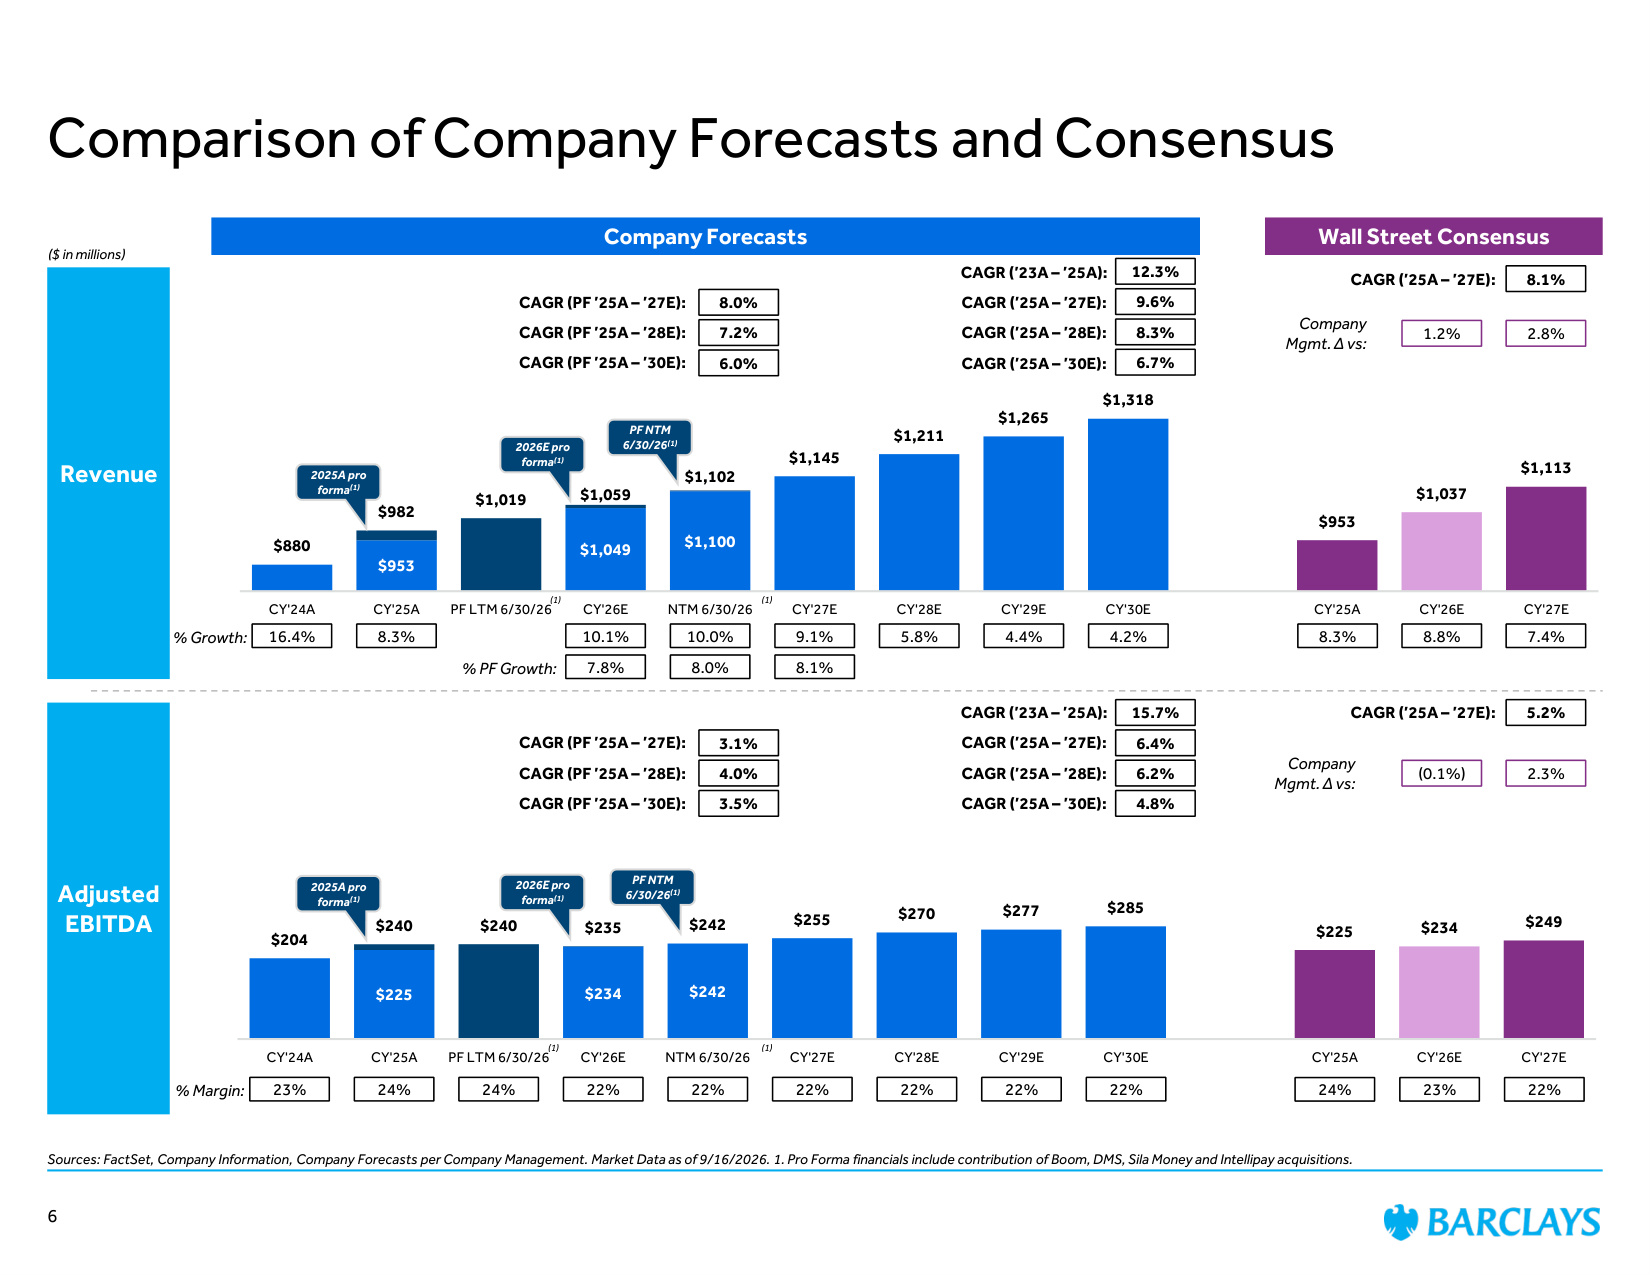
$225 $234 $242 $204 $240 $242 $255 $270 $277 $285 $225 $234 $249 $240 $235 CY'24A CY'25A PF LTM 6/30/26 CY'26E NTM 6/30/26 CY'27E CY'28E CY'29E CY'30E CY'25A CY'26E CY'27E $953 $1,049 $1,100 $880 $1,019 $1,145 $1,211 $1,265 $1,318 $953 $1,037 $1,113 $982 $1,059 $1,102 CY'24A CY'25A PF LTM 6/30/26 CY'26E NTM 6/30/26 CY'27E CY'28E CY'29E CY'30E CY'25A CY'26E CY'27E Revenue ($ in millions) Adjusted EBITDA % Growth: % Margin: 4.2% 24% 22% 23% 9.1% 5.8% 22% 22% 22% Company Forecasts Wall Street Consensus 8.1% CAGR ('25A – '27E): 22% 8.8% 7.4% 8.3% 10.1% 5.2% CAGR ('25A – '27E): 8.3% 23% 4.4% 22% Comparison of Company Forecasts and Consensus Sources: FactSet, Company Information, Company Forecasts per Company Management. Market Data as of 9/16/2026. 1. Pro Forma financials include contribution of Boom, DMS, Sila Money and Intellipay acquisitions. 16.4% 24% 12.3% 9.6% 8.3% 6.7% 15.7% 6.4% CAGR ('23A – '25A): CAGR ('25A – '27E): CAGR ('25A – '28E): CAGR ('25A – '30E): 6.2% 4.8% 1.2% 2.8% (0.1%) 2.3% Company Mgmt. Δ vs: 2025A pro forma(1) % PF Growth: 7.8% 8.0% CAGR (PF '25A – '27E): CAGR (PF '25A – '28E): CAGR (PF '25A – '30E): 7.2% 6.0% 3.1% CAGR (PF '25A – '27E): CAGR (PF '25A – '28E): CAGR (PF '25A – '30E): 4.0% 3.5% 2025A pro forma(1) CAGR ('23A – '25A): CAGR ('25A – '27E): CAGR ('25A – '28E): CAGR ('25A – '30E): 6 10.0% 8.0% Company Mgmt. Δ vs: 24% 22% (1) (1) 2026E pro forma(1) 8.1% 2026E pro forma(1) PF NTM 6/30/26(1) PF NTM 6/30/26(1) (1) (1)
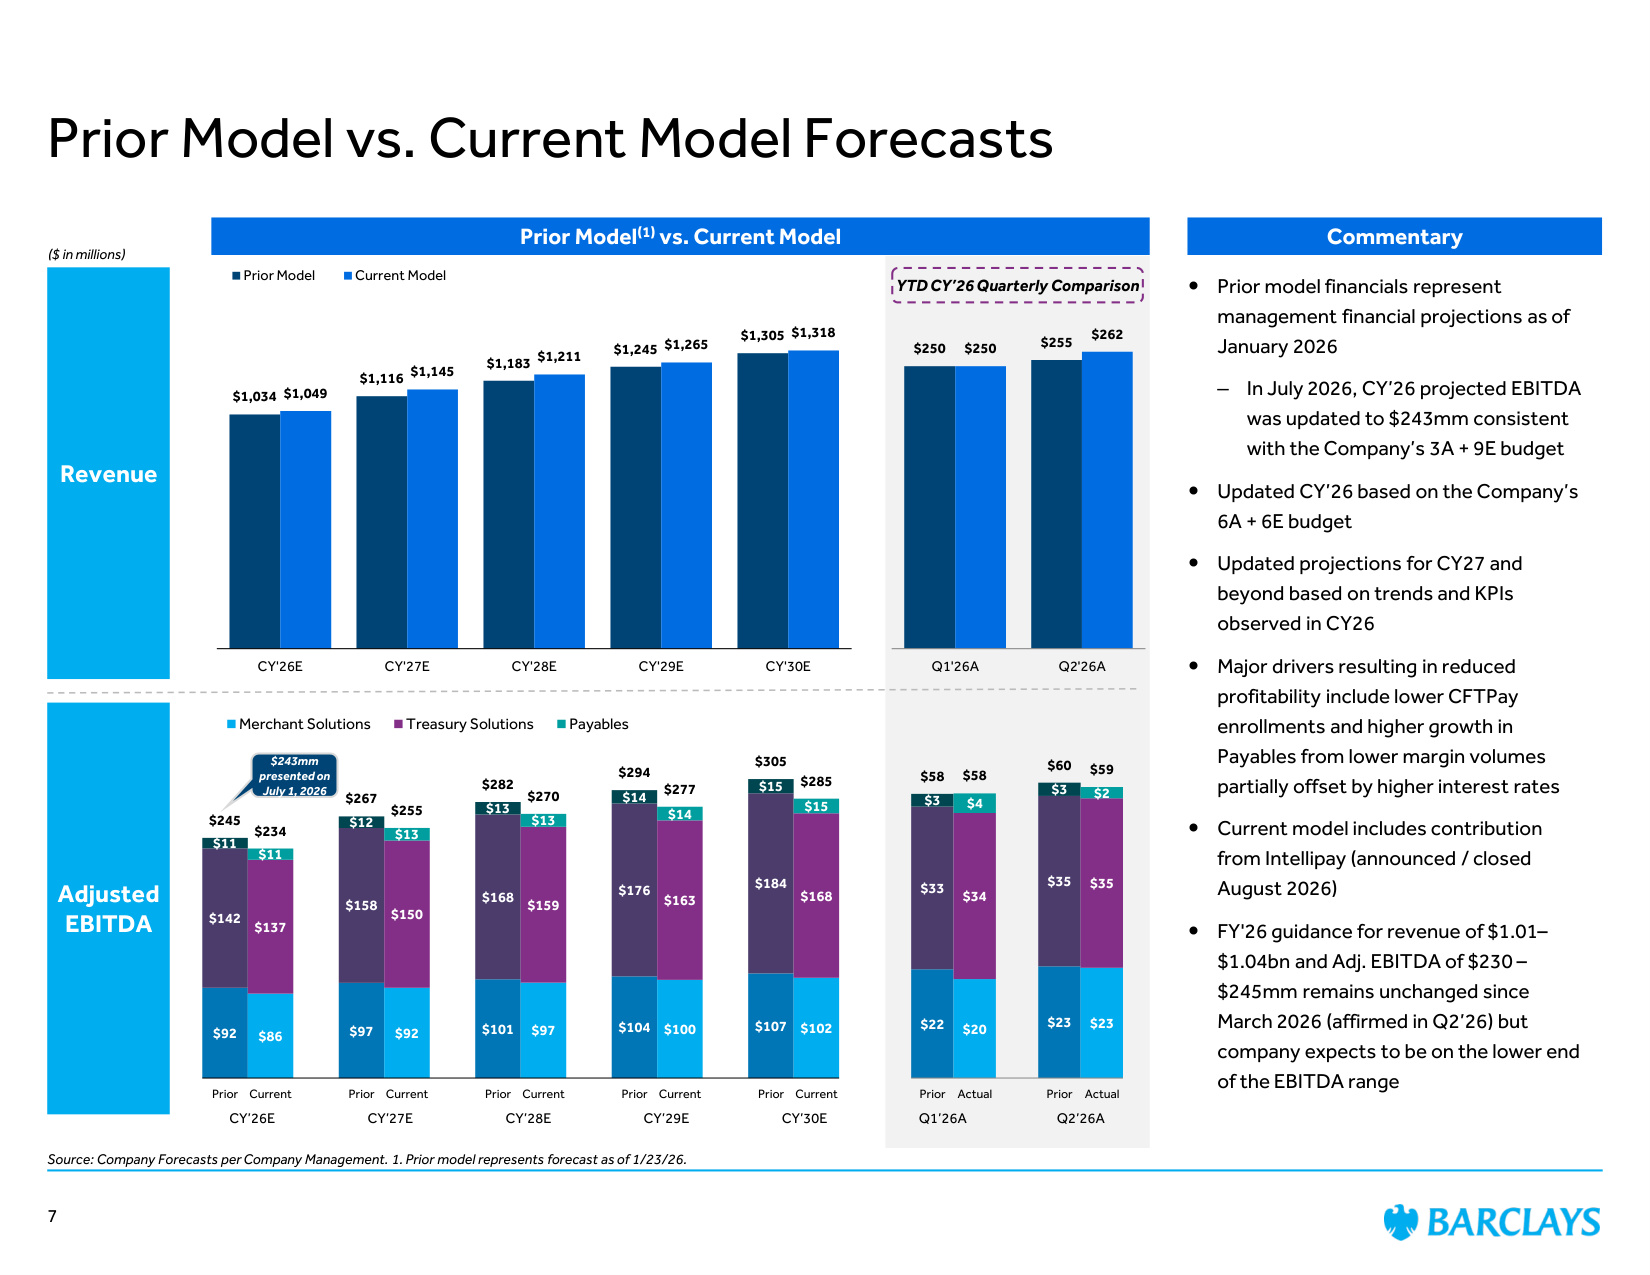
Prior Model(1) vs. Current Model Revenue Adjusted EBITDA Prior Model vs. Current Model Forecasts Commentary Prior model financials represent management financial projections as of January 2026 – In July 2026, CY'26 projected EBITDA was updated to $243mm consistent with the Company's 3A + 9E budget Updated CY'26 based on the Company's 6A + 6E budget Updated projections for CY27 and beyond based on trends and KPIs observed in CY26 Major drivers resulting in reduced profitability include lower CFTPay enrollments and higher growth in Payables from lower margin volumes partially offset by higher interest rates Current model includes contribution from Intellipay (announced / closed August 2026) FY'26 guidance for revenue of $1.01– $1.04bn and Adj. EBITDA of $230 – $245mm remains unchanged since March 2026 (affirmed in Q2'26) but company expects to be on the lower end of the EBITDA range $1,034 $1,116 $1,183 $1,245 $1,305 $1,049 $1,145 $1,211 $1,265 $1,318 CY'26E CY'27E CY'28E CY'29E CY'30E Prior Model Current Model $92 $86 $97 $92 $101 $97 $104 $100 $107 $102 $142 $137 $158 $150 $168 $159 $176 $163 $184 $168 $11 $11 $12 $13 $13 $13 $14 $14 $15 $15 $245 $234 $267 $255 $282 $270 $294 $277 $305 $285 Prior Current Prior Current Prior Current Prior Current Prior Current Merchant Solutions Treasury Solutions Payables YTD CY'26 Quarterly Comparison CY'26E CY'27E CY'28E CY'29E CY'30E Q1'26A Q2'26A $243mm presented on July 1, 2026 ($ in millions) $250 $255 $250 $262 Q1'26A Q2'26A $22 $20 $23 $23 $33 $34 $35 $35 $3 $4 $3 $2 $58 $58 $60 $59 Prior Actual Prior Actual 7 Source: Company Forecasts per Company Management. 1. Prior model represents forecast as of 1/23/26.

Valuation Perspectives
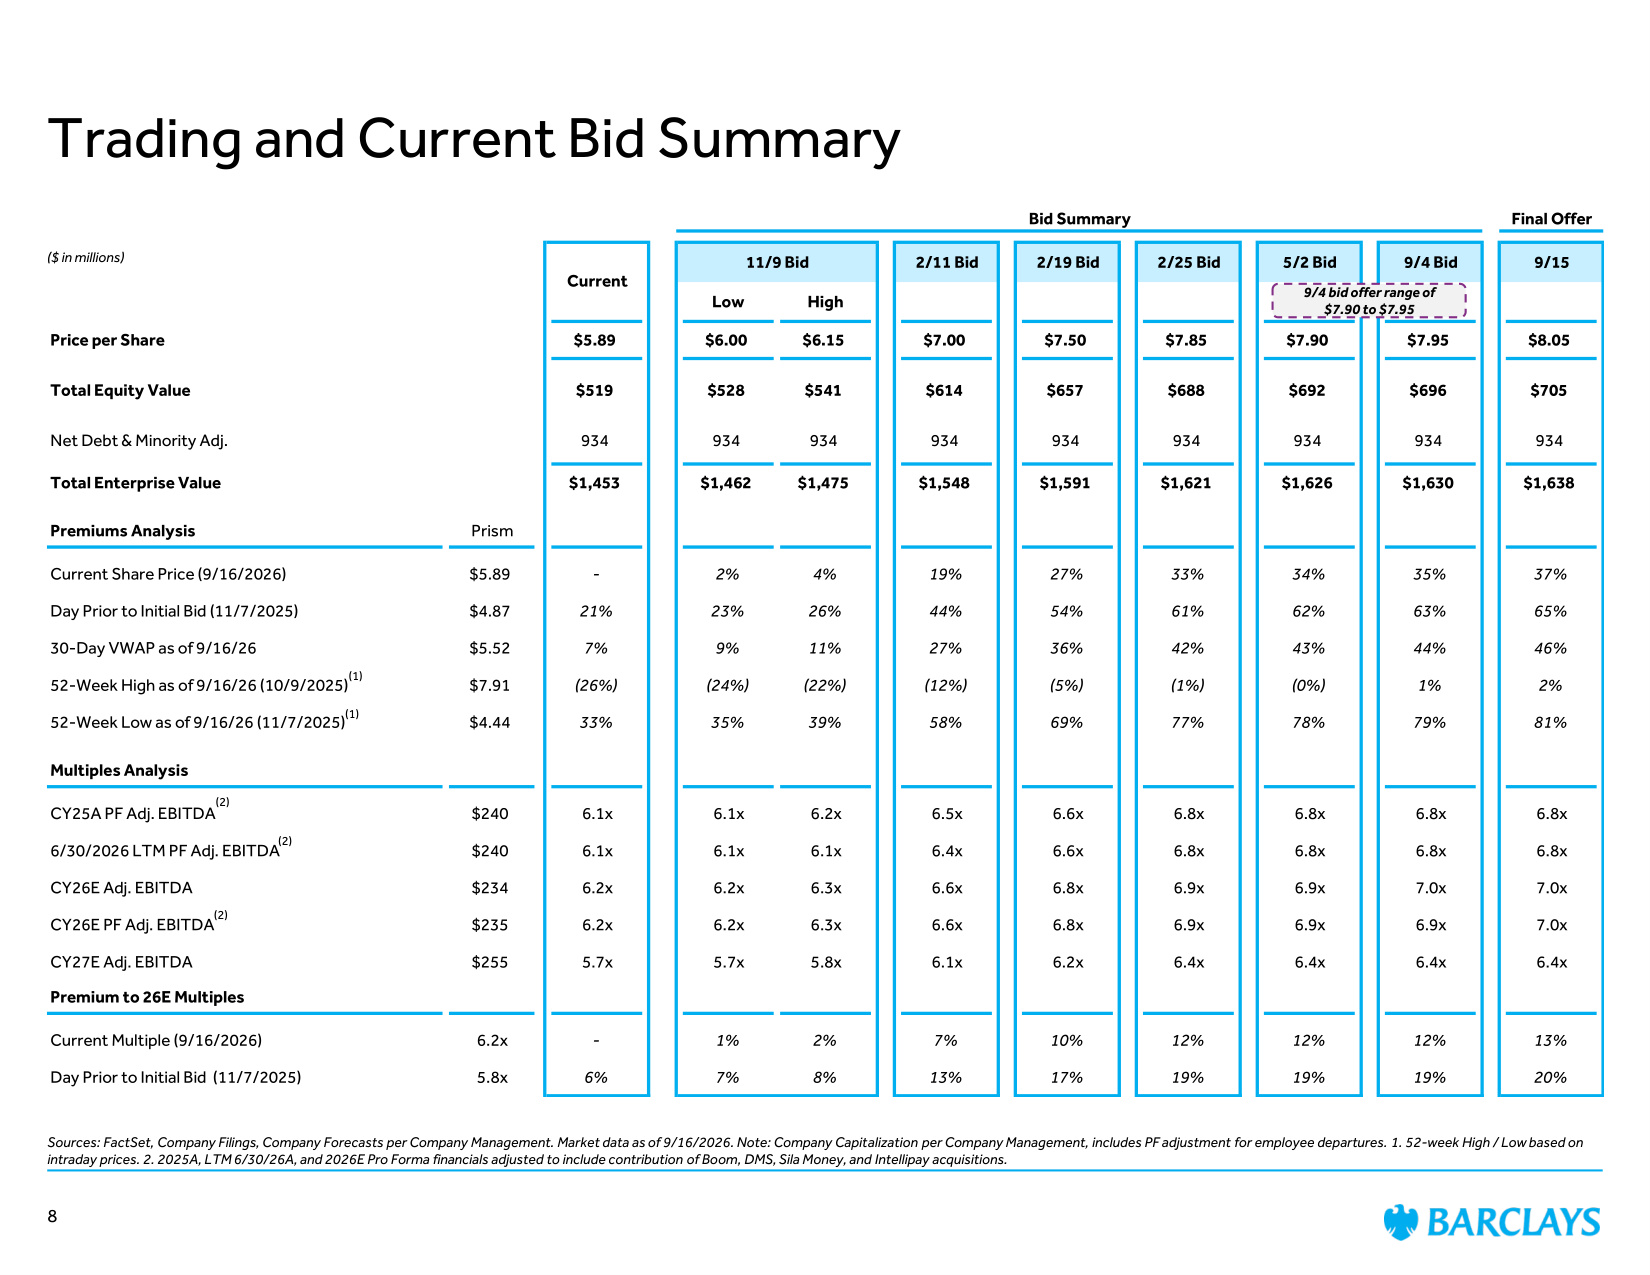
Bid Summary Final Offer 11/9 Bid 2/11 Bid 2/19 Bid 2/25 Bid 5/2 Bid 9/4 Bid 9/15 Low High Price per Share $5.89 $6.00 $6.15 $7.00 $7.50 $7.85 $7.90 $7.95 $8.05 Total Equity Value $519 $528 $541 $614 $657 $688 $692 $696 $705 Net Debt & Minority Adj. 934 934 934 934 934 934 934 934 934 Total Enterprise Value $1,453 $1,462 $1,475 $1,548 $1,591 $1,621 $1,626 $1,630 $1,638 Premiums Analysis Prism Current Share Price (9/16/2026) $5.89 - 2% 4% 19% 27% 33% 34% 35% 37% Day Prior to Initial Bid (11/7/2025) $4.87 21% 23% 26% 44% 54% 61% 62% 63% 65% 30-Day VWAP as of 9/16/26 $5.52 7% 9% 11% 27% 36% 42% 43% 44% 46% 52-Week High as of 9/16/26 (10/9/2025) $7.91 (26%) (24%) (22%) (12%) (5%) (1%) (0%) 1% 2% 52-Week Low as of 9/16/26 (11/7/2025) $4.44 33% 35% 39% 58% 69% 77% 78% 79% 81% Multiples Analysis CY25A PF Adj. EBITDA $240 6.1x 6.1x 6.2x 6.5x 6.6x 6.8x 6.8x 6.8x 6.8x 6/30/2026 LTM PF Adj. EBITDA $240 6.1x 6.1x 6.1x 6.4x 6.6x 6.8x 6.8x 6.8x 6.8x CY26E Adj. EBITDA $234 6.2x 6.2x 6.3x 6.6x 6.8x 6.9x 6.9x 7.0x 7.0x CY26E PF Adj. EBITDA $235 6.2x 6.2x 6.3x 6.6x 6.8x 6.9x 6.9x 6.9x 7.0x CY27E Adj. EBITDA $255 5.7x 5.7x 5.8x 6.1x 6.2x 6.4x 6.4x 6.4x 6.4x Premium to 26E Multiples Current Multiple (9/16/2026) 6.2x - 1% 2% 7% 10% 12% 12% 12% 13% Day Prior to Initial Bid (11/7/2025) 5.8x 6% 7% 8% 13% 17% 19% 19% 19% 20% Current Trading and Current Bid Summary Sources: FactSet, Company Filings, Company Forecasts per Company Management. Market data as of 9/16/2026. Note: Company Capitalization per Company Management, includes PF adjustment for employee departures. 1. 52-week High / Low based on intraday prices. 2. 2025A, LTM 6/30/26A, and 2026E Pro Forma financials adjusted to include contribution of Boom, DMS, Sila Money, and Intellipay acquisitions. ($ in millions) 8 9/4 bid offer range of $7.90 to $7.95 (2) (1) (2) (2) (1)
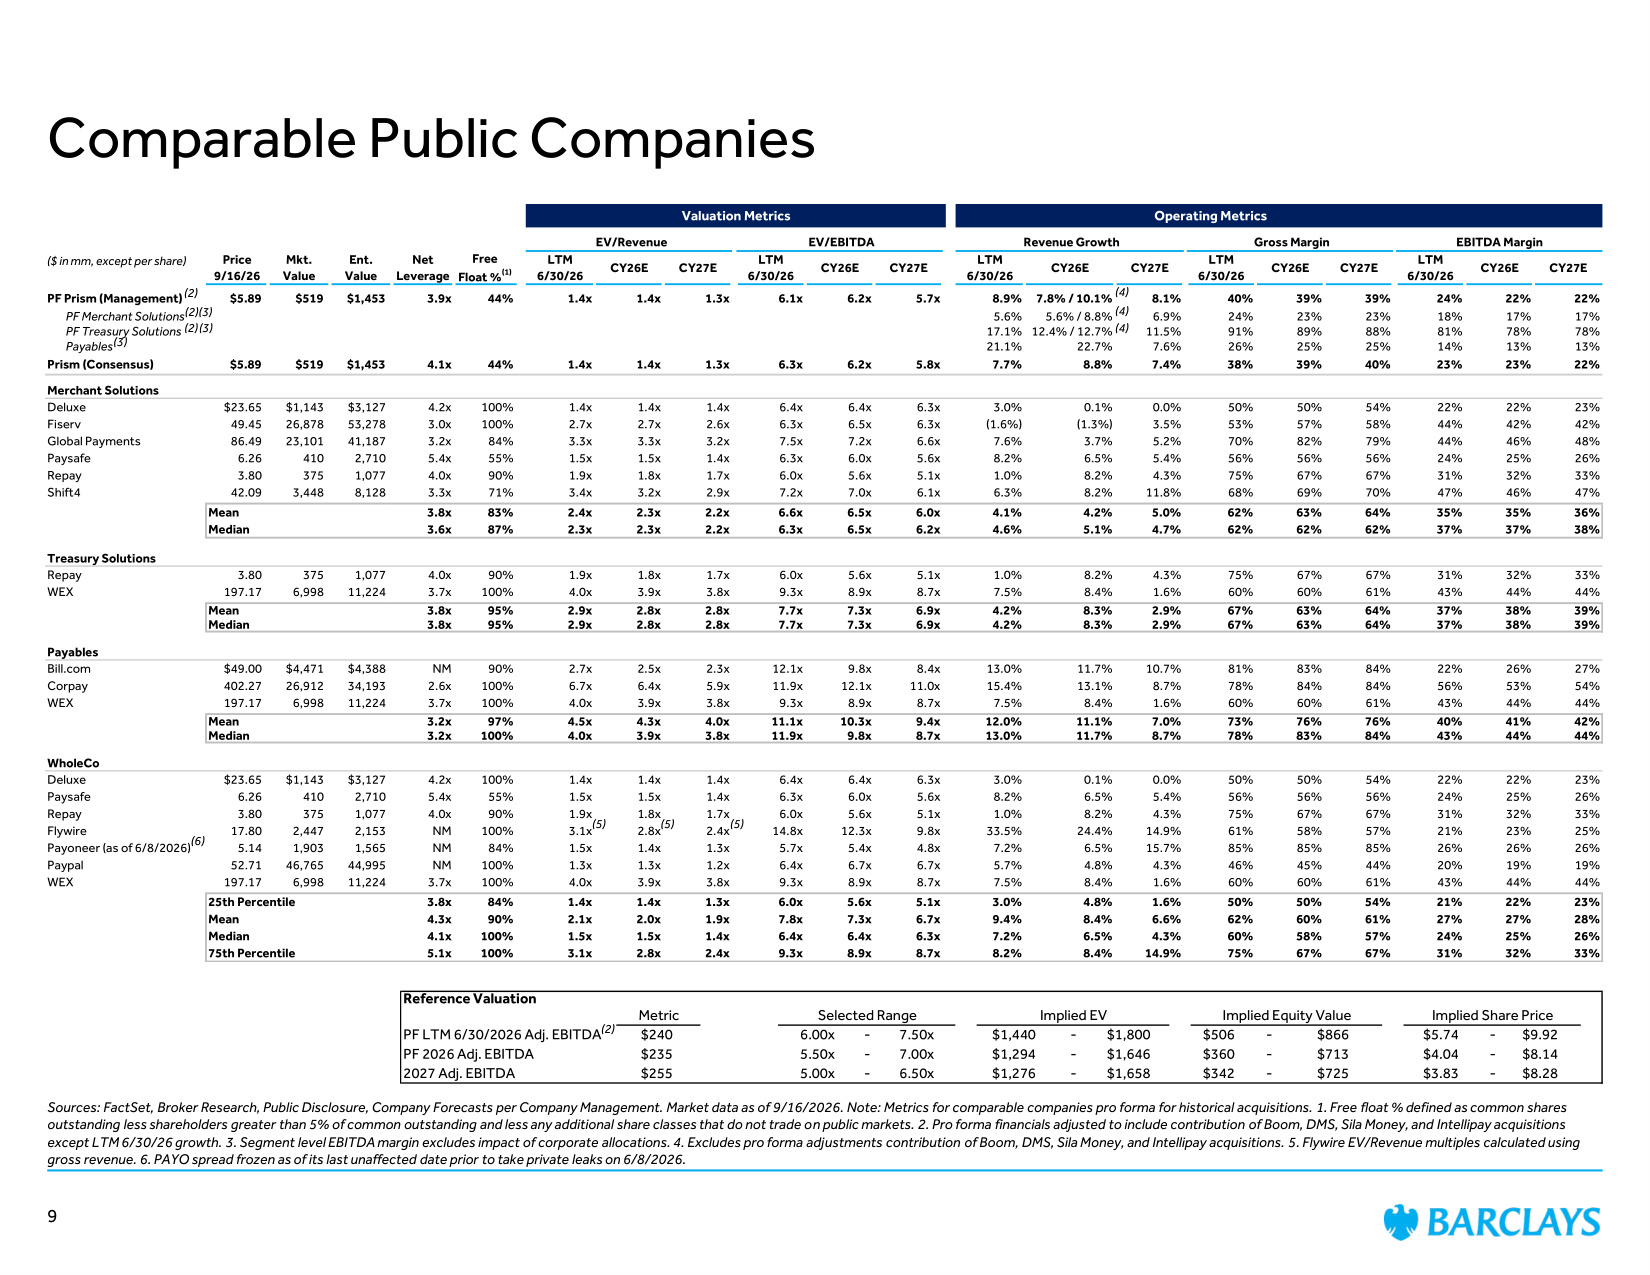
Comparable Public Companies Sources: FactSet, Broker Research, Public Disclosure, Company Forecasts per Company Management. Market data as of 9/16/2026. Note: Metrics for comparable companies pro forma for historical acquisitions. 1. Free float % defined as common shares outstanding less shareholders greater than 5% of common outstanding and less any additional share classes that do not trade on public markets. 2. Pro forma financials adjusted to include contribution of Boom, DMS, Sila Money, and Intellipay acquisitions except LTM 6/30/26 growth. 3. Segment level EBITDA margin excludes impact of corporate allocations. 4. Excludes pro forma adjustments contribution of Boom, DMS, Sila Money, and Intellipay acquisitions. 5. Flywire EV/Revenue multiples calculated using gross revenue. 6. PAYO spread frozen as of its last unaffected date prior to take private leaks on 6/8/2026. (5) (2) (2) (2) (3) (3) (3) (4) (4) (4) (5) (2) Valuation Metrics Operating Metrics EV/Revenue EV/EBITDA Revenue Growth Gross Margin EBITDA Margin Price 9/16/26 Mkt. Value Ent. Value Net Leverage Free Float %(1) LTM 6/30/26 CY26E CY27E LTM 6/30/26 CY26E CY27E LTM 6/30/26 CY26E CY27E LTM 6/30/26 CY26E CY27E LTM 6/30/26 CY26E CY27E PF Prism (Management) $5.89 $519 $1,453 3.9x 44% 1.4x 1.4x 1.3x 6.1x 6.2x 5.7x 8.9% 7.8% / 10.1% 8.1% 40% 39% 39% 24% 22% 22% PF Merchant Solutions 5.6% 5.6% / 8.8% 6.9% 24% 23% 23% 18% 17% 17% PF Treasury Solutions 17.1% 12.4% / 12.7% 11.5% 91% 89% 88% 81% 78% 78% Payables 21.1% 22.7% 7.6% 26% 25% 25% 14% 13% 13% Prism (Consensus) $5.89 $519 $1,453 4.1x 44% 1.4x 1.4x 1.3x 6.3x 6.2x 5.8x 7.7% 8.8% 7.4% 38% 39% 40% 23% 23% 22% Merchant Solutions Deluxe $23.65 $1,143 $3,127 4.2x 100% 1.4x 1.4x 1.4x 6.4x 6.4x 6.3x 3.0% 0.1% 0.0% 50% 50% 54% 22% 22% 23% Fiserv 49.45 26,878 53,278 3.0x 100% 2.7x 2.7x 2.6x 6.3x 6.5x 6.3x (1.6%) (1.3%) 3.5% 53% 57% 58% 44% 42% 42% Global Payments 86.49 23,101 41,187 3.2x 84% 3.3x 3.3x 3.2x 7.5x 7.2x 6.6x 7.6% 3.7% 5.2% 70% 82% 79% 44% 46% 48% Paysafe 6.26 410 2,710 5.4x 55% 1.5x 1.5x 1.4x 6.3x 6.0x 5.6x 8.2% 6.5% 5.4% 56% 56% 56% 24% 25% 26% Repay 3.80 375 1,077 4.0x 90% 1.9x 1.8x 1.7x 6.0x 5.6x 5.1x 1.0% 8.2% 4.3% 75% 67% 67% 31% 32% 33% Shift4 42.09 3,448 8,128 3.3x 71% 3.4x 3.2x 2.9x 7.2x 7.0x 6.1x 6.3% 8.2% 11.8% 68% 69% 70% 47% 46% 47% Mean 3.8x 83% 2.4x 2.3x 2.2x 6.6x 6.5x 6.0x 4.1% 4.2% 5.0% 62% 63% 64% 35% 35% 36% Median 3.6x 87% 2.3x 2.3x 2.2x 6.3x 6.5x 6.2x 4.6% 5.1% 4.7% 62% 62% 62% 37% 37% 38% Treasury Solutions Repay 3.80 375 1,077 4.0x 90% 1.9x 1.8x 1.7x 6.0x 5.6x 5.1x 1.0% 8.2% 4.3% 75% 67% 67% 31% 32% 33% WEX 197.17 6,998 11,224 3.7x 100% 4.0x 3.9x 3.8x 9.3x 8.9x 8.7x 7.5% 8.4% 1.6% 60% 60% 61% 43% 44% 44% Mean 3.8x 95% 2.9x 2.8x 2.8x 7.7x 7.3x 6.9x 4.2% 8.3% 2.9% 67% 63% 64% 37% 38% 39% Median 3.8x 95% 2.9x 2.8x 2.8x 7.7x 7.3x 6.9x 4.2% 8.3% 2.9% 67% 63% 64% 37% 38% 39% Payables Bill.com $49.00 $4,471 $4,388 NM 90% 2.7x 2.5x 2.3x 12.1x 9.8x 8.4x 13.0% 11.7% 10.7% 81% 83% 84% 22% 26% 27% Corpay 402.27 26,912 34,193 2.6x 100% 6.7x 6.4x 5.9x 11.9x 12.1x 11.0x 15.4% 13.1% 8.7% 78% 84% 84% 56% 53% 54% WEX 197.17 6,998 11,224 3.7x 100% 4.0x 3.9x 3.8x 9.3x 8.9x 8.7x 7.5% 8.4% 1.6% 60% 60% 61% 43% 44% 44% Mean 3.2x 97% 4.5x 4.3x 4.0x 11.1x 10.3x 9.4x 12.0% 11.1% 7.0% 73% 76% 76% 40% 41% 42% Median 3.2x 100% 4.0x 3.9x 3.8x 11.9x 9.8x 8.7x 13.0% 11.7% 8.7% 78% 83% 84% 43% 44% 44% WholeCo Deluxe $23.65 $1,143 $3,127 4.2x 100% 1.4x 1.4x 1.4x 6.4x 6.4x 6.3x 3.0% 0.1% 0.0% 50% 50% 54% 22% 22% 23% Paysafe 6.26 410 2,710 5.4x 55% 1.5x 1.5x 1.4x 6.3x 6.0x 5.6x 8.2% 6.5% 5.4% 56% 56% 56% 24% 25% 26% Repay 3.80 375 1,077 4.0x 90% 1.9x 1.8x 1.7x 6.0x 5.6x 5.1x 1.0% 8.2% 4.3% 75% 67% 67% 31% 32% 33% Flywire 17.80 2,447 2,153 NM 100% 3.1x 2.8x 2.4x 14.8x 12.3x 9.8x 33.5% 24.4% 14.9% 61% 58% 57% 21% 23% 25% Payoneer (as of 6/8/2026) 5.14 1,903 1,565 NM 84% 1.5x 1.4x 1.3x 5.7x 5.4x 4.8x 7.2% 6.5% 15.7% 85% 85% 85% 26% 26% 26% Paypal 52.71 46,765 44,995 NM 100% 1.3x 1.3x 1.2x 6.4x 6.7x 6.7x 5.7% 4.8% 4.3% 46% 45% 44% 20% 19% 19% WEX 197.17 6,998 11,224 3.7x 100% 4.0x 3.9x 3.8x 9.3x 8.9x 8.7x 7.5% 8.4% 1.6% 60% 60% 61% 43% 44% 44% 25th Percentile 3.8x 84% 1.4x 1.4x 1.3x 6.0x 5.6x 5.1x 3.0% 4.8% 1.6% 50% 50% 54% 21% 22% 23% Mean 4.3x 90% 2.1x 2.0x 1.9x 7.8x 7.3x 6.7x 9.4% 8.4% 6.6% 62% 60% 61% 27% 27% 28% Median 4.1x 100% 1.5x 1.5x 1.4x 6.4x 6.4x 6.3x 7.2% 6.5% 4.3% 60% 58% 57% 24% 25% 26% 75th Percentile 5.1x 100% 3.1x 2.8x 2.4x 9.3x 8.9x 8.7x 8.2% 8.4% 14.9% 75% 67% 67% 31% 32% 33% Reference Valuation Metric Selected Range Implied EV Implied Equity Value Implied Share Price PF LTM 6/30/2026 Adj. EBITDA $240 6.00x - 7.50x $1,440 - $1,800 $506 - $866 $5.74 - $9.92 PF 2026 Adj. EBITDA $235 5.50x - 7.00x $1,294 - $1,646 $360 - $713 $4.04 - $8.14 2027 Adj. EBITDA $255 5.00x - 6.50x $1,276 - $1,658 $342 - $725 $3.83 - $8.28 (6) (5) 9 ($ in mm, except per share)
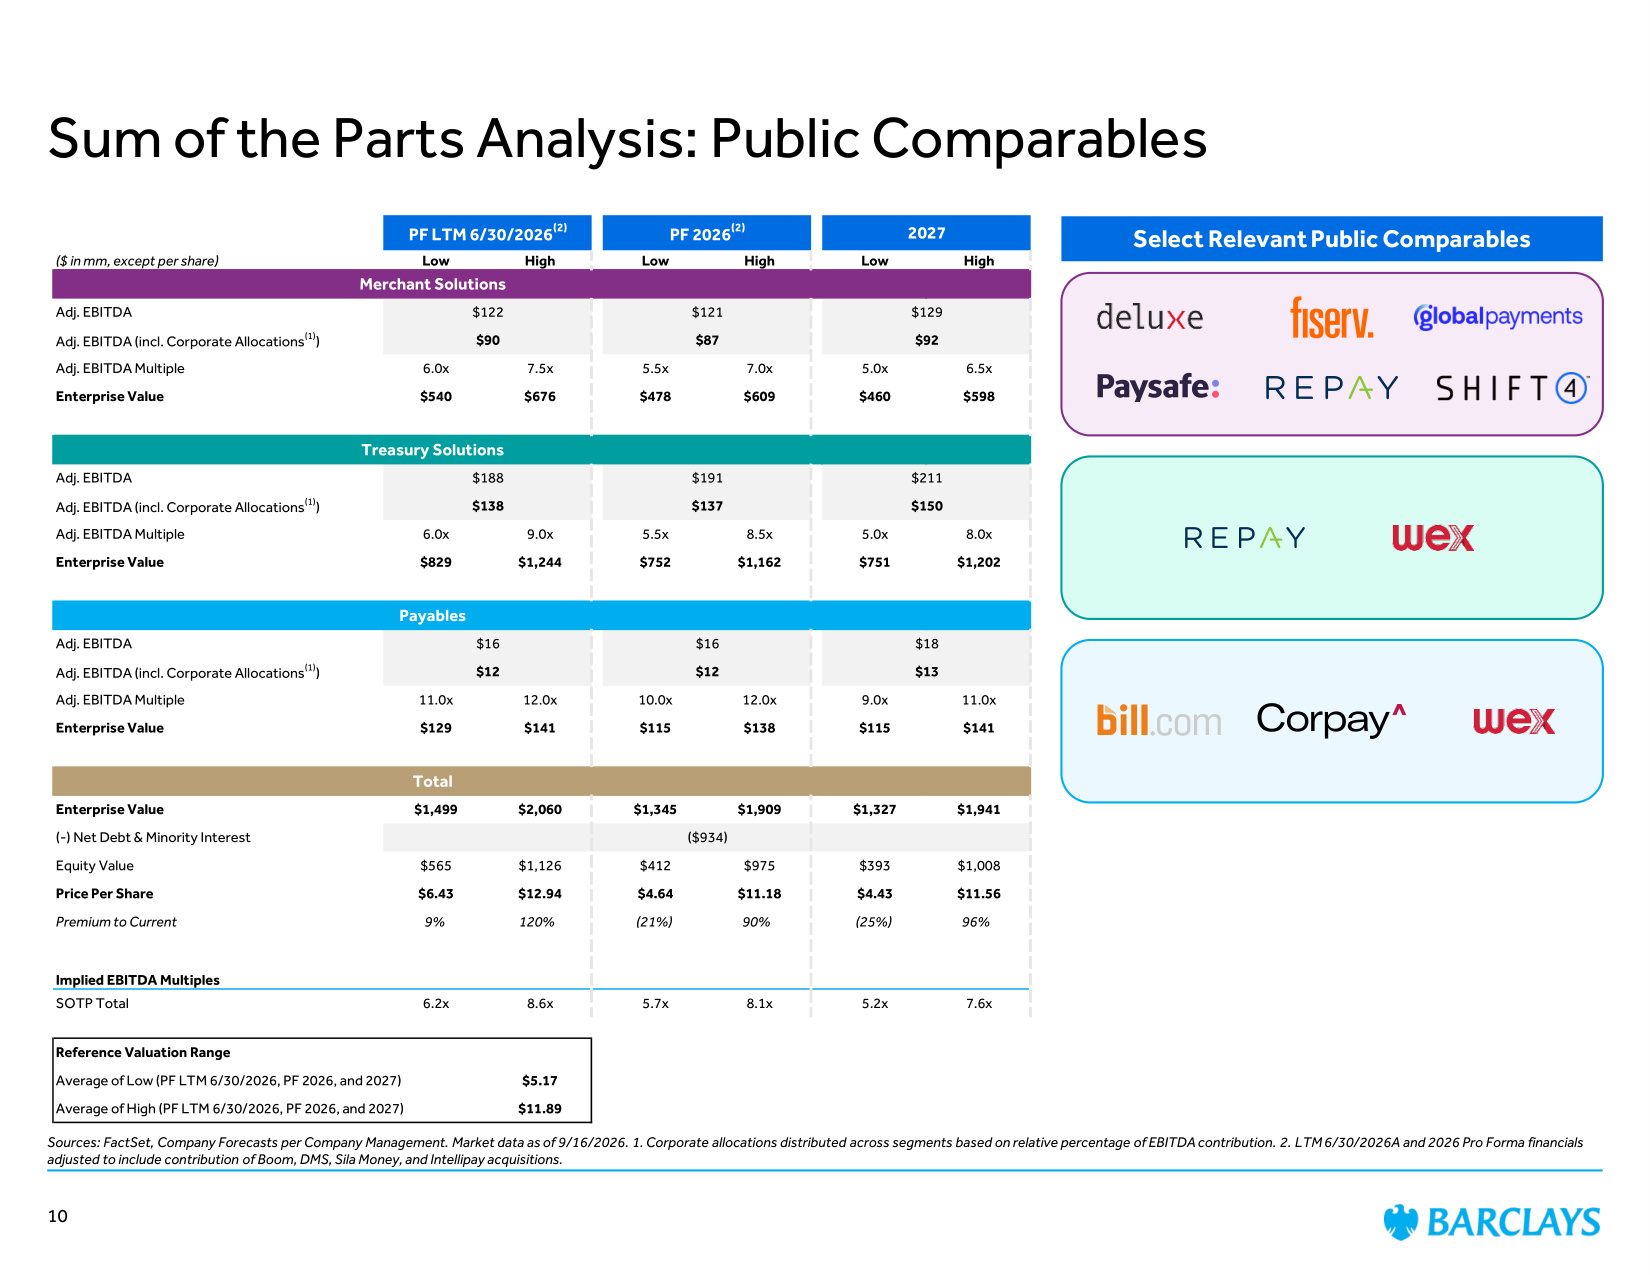
Sum of the Parts Analysis: Public Comparables Sources: FactSet, Company Forecasts per Company Management. Market data as of 9/16/2026. 1. Corporate allocations distributed across segments based on relative percentage of EBITDA contribution. 2. LTM 6/30/2026A and 2026 Pro Forma financials adjusted to include contribution of Boom, DMS, Sila Money, and Intellipay acquisitions. Select Relevant Public Comparables PF LTM 6/30/2026(2) PF 2026(2) 2027 ($ in mm, except per share) Low High Low High Low High Merchant Solutions Adj. EBITDA $122 $121 $129 Adj. EBITDA (incl. Corporate Allocations(1)) $90 $87 $92 Adj. EBITDA Multiple 6.0x 7.5x 5.5x 7.0x 5.0x 6.5x Enterprise Value $540 $676 $478 $609 $460 $598 Treasury Solutions Adj. EBITDA $188 $191 $211 Adj. EBITDA (incl. Corporate Allocations(1)) $138 $137 $150 Adj. EBITDA Multiple 6.0x 9.0x 5.5x 8.5x 5.0x 8.0x Enterprise Value $829 $1,244 $752 $1,162 $751 $1,202 Payables Adj. EBITDA $16 $16 $18 Adj. EBITDA (incl. Corporate Allocations(1)) $12 $12 $13 Adj. EBITDA Multiple 11.0x 12.0x 10.0x 12.0x 9.0x 11.0x Enterprise Value $129 $141 $115 $138 $115 $141 Total Enterprise Value $1,499 $2,060 $1,345 $1,909 $1,327 $1,941 (-) Net Debt & Minority Interest ($934) Equity Value $565 $1,126 $412 $975 $393 $1,008 Price Per Share $6.43 $12.94 $4.64 $11.18 $4.43 $11.56 Premium to Current 9% 120% (21%) 90% (25%) 96% Implied EBITDA Multiples SOTP Total 6.2x 8.6x 5.7x 8.1x 5.2x 7.6x Reference Valuation Range Average of Low (PF LTM 6/30/2026, PF 2026, and 2027) $5.17 Average of High (PF LTM 6/30/2026, PF 2026, and 2027) $11.89 10
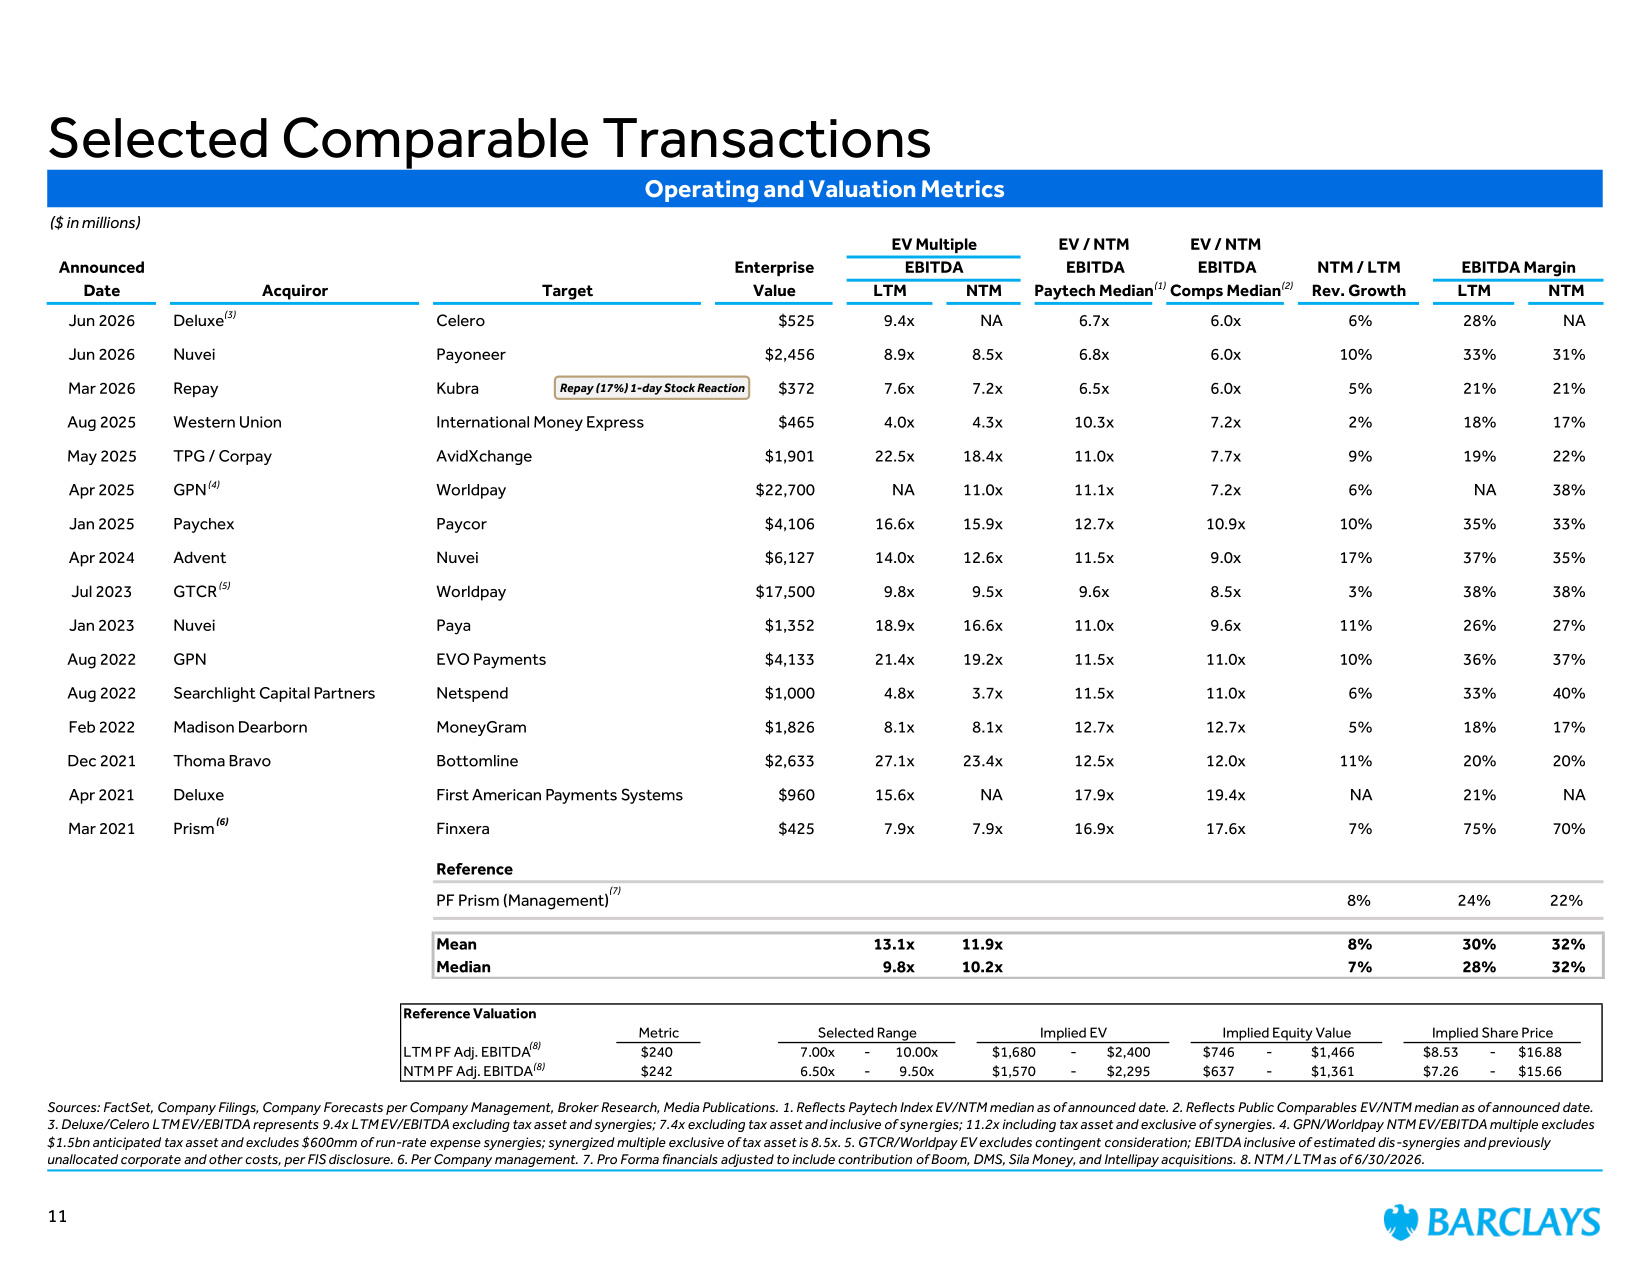
Selected Comparable Transactions Sources: FactSet, Company Filings, Company Forecasts per Company Management, Broker Research, Media Publications. 1. Reflects Paytech Index EV/NTM median as of announced date. 2. Reflects Public Comparables EV/NTM median as of announced date. 3. Deluxe/Celero LTM EV/EBITDA represents 9.4x LTM EV/EBITDA excluding tax asset and synergies; 7.4x excluding tax asset and inclusive of synergies; 11.2x including tax asset and exclusive of synergies. 4. GPN/Worldpay NTM EV/EBITDA multiple excludes $1.5bn anticipated tax asset and excludes $600mm of run-rate expense synergies; synergized multiple exclusive of tax asset is 8.5x. 5. GTCR/Worldpay EV excludes contingent consideration; EBITDA inclusive of estimated dis-synergies and previously unallocated corporate and other costs, per FIS disclosure. 6. Per Company management. 7. Pro Forma financials adjusted to include contribution of Boom, DMS, Sila Money, and Intellipay acquisitions. 8. NTM / LTM as of 6/30/2026. ($ in millions) EV Multiple EV / NTM EV / NTM Announced Enterprise EBITDA EBITDA EBITDA NTM / LTM EBITDA Margin Date Acquiror Target Value LTM NTM Paytech Median Comps Median Rev. Growth LTM NTM Jun 2026 Deluxe Celero $525 9.4x NA 6.7x 6.0x 6% 28% NA Jun 2026 Nuvei Payoneer $2,456 8.9x 8.5x 6.8x 6.0x 10% 33% 31% Mar 2026 Repay Kubra $372 7.6x 7.2x 6.5x 6.0x 5% 21% 21% Aug 2025 Western Union International Money Express $465 4.0x 4.3x 10.3x 7.2x 2% 18% 17% May 2025 TPG / Corpay AvidXchange $1,901 22.5x 18.4x 11.0x 7.7x 9% 19% 22% Apr 2025 GPN Worldpay $22,700 NA 11.0x 11.1x 7.2x 6% NA 38% Jan 2025 Paychex Paycor $4,106 16.6x 15.9x 12.7x 10.9x 10% 35% 33% Apr 2024 Advent Nuvei $6,127 14.0x 12.6x 11.5x 9.0x 17% 37% 35% Jul 2023 GTCR Worldpay $17,500 9.8x 9.5x 9.6x 8.5x 3% 38% 38% Jan 2023 Nuvei Paya $1,352 18.9x 16.6x 11.0x 9.6x 11% 26% 27% Aug 2022 GPN EVO Payments $4,133 21.4x 19.2x 11.5x 11.0x 10% 36% 37% Aug 2022 Searchlight Capital Partners Netspend $1,000 4.8x 3.7x 11.5x 11.0x 6% 33% 40% Feb 2022 Madison Dearborn MoneyGram $1,826 8.1x 8.1x 12.7x 12.7x 5% 18% 17% Dec 2021 Thoma Bravo Bottomline $2,633 27.1x 23.4x 12.5x 12.0x 11% 20% 20% Apr 2021 Deluxe First American Payments Systems $960 15.6x NA 17.9x 19.4x NA 21% NA Mar 2021 Prism Finxera $425 7.9x 7.9x 16.9x 17.6x 7% 75% 70% Reference PF Prism (Management) 8% 24% 22% Mean 13.1x 11.9x 8% 30% 32% Median 9.8x 10.2x 7% 28% 32% Operating and Valuation Metrics 11 (5) (6) (1) (7) Reference Valuation Metric Selected Range Implied EV Implied Equity Value Implied Share Price LTM PF Adj. EBITDA $240 7.00x - 10.00x $1,680 - $2,400 $746 - $1,466 $8.53 - $16.88 NTM PF Adj. EBITDA $242 6.50x - 9.50x $1,570 - $2,295 $637 - $1,361 $7.26 - $15.66 (2) (4) (8) (8) Repay (17%) 1-day Stock Reaction (3)
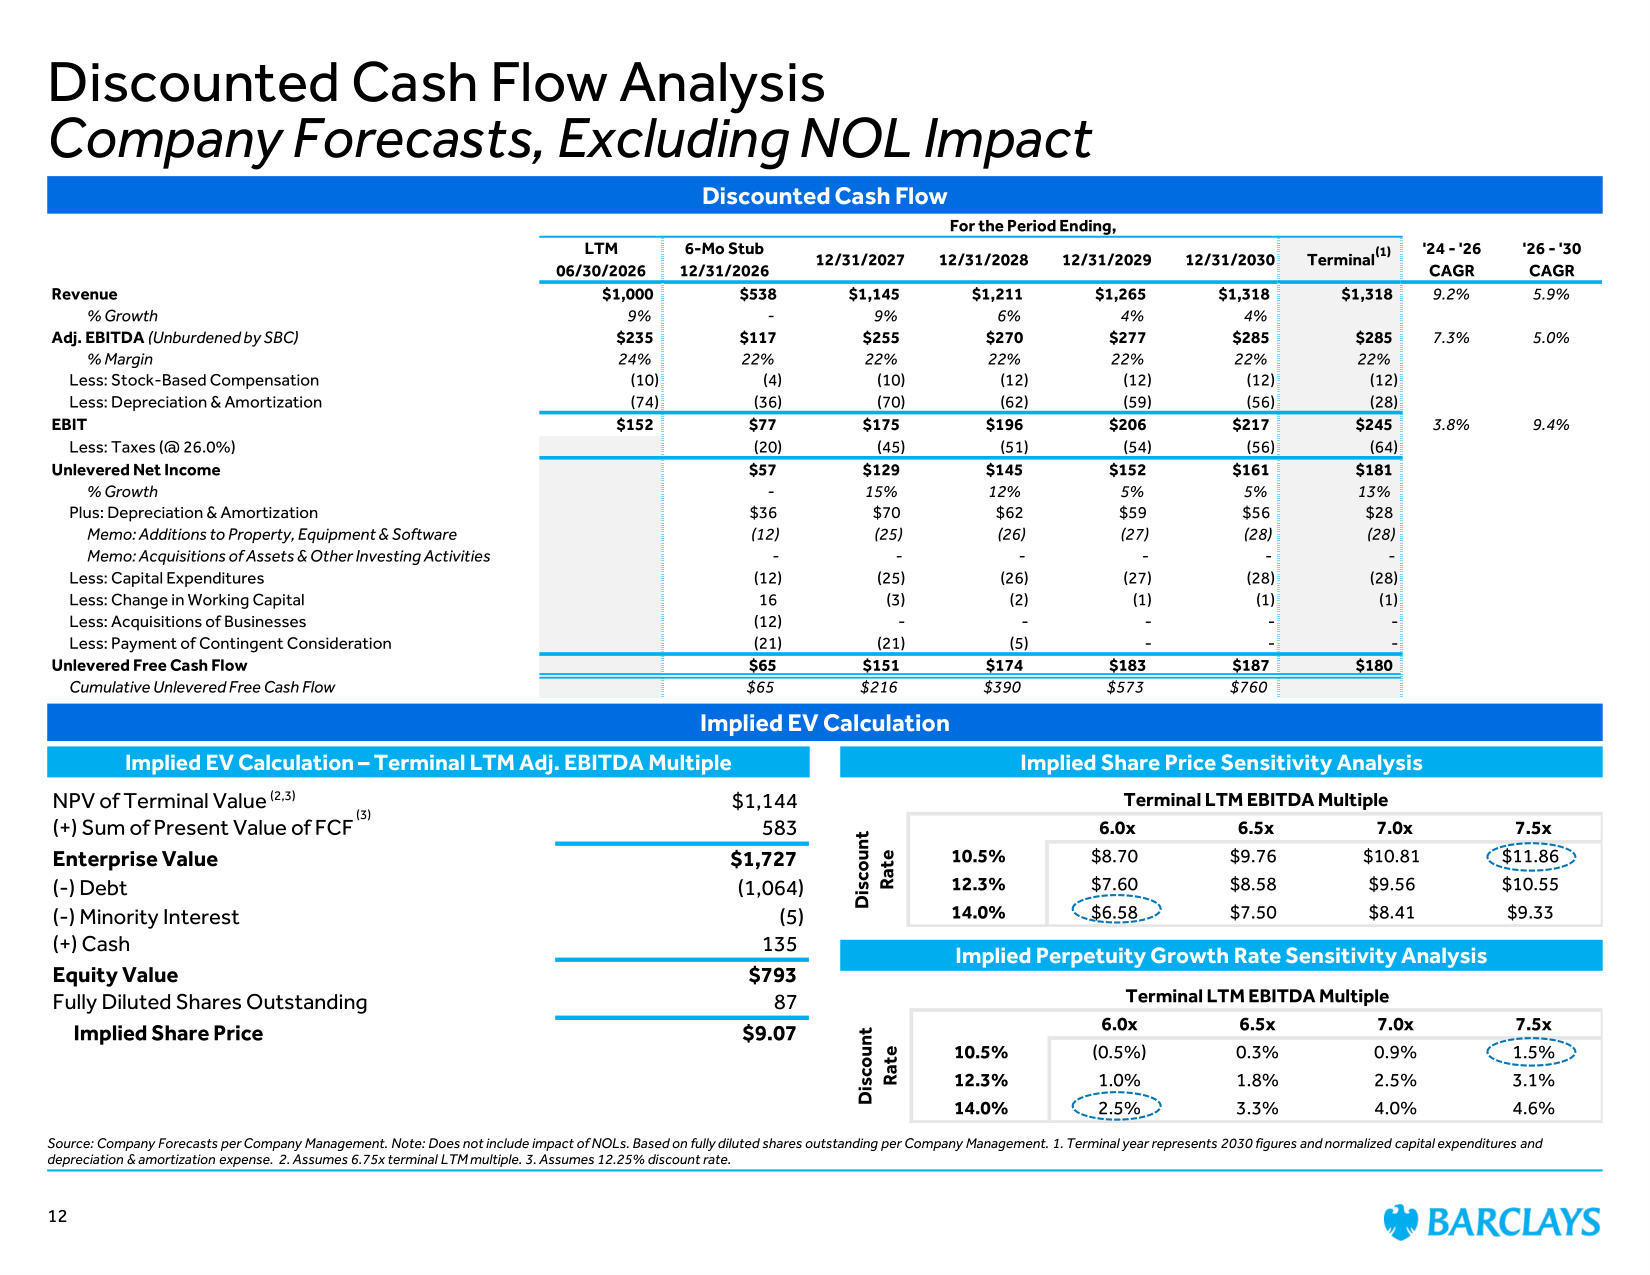
For the Period Ending, LTM 06/30/2026 6-Mo Stub 12/31/2026 12/31/2027 12/31/2028 12/31/2029 12/31/2030 Terminal '24 - '26 CAGR '26 - '30 CAGR Revenue $1,000 $538 $1,145 $1,211 $1,265 $1,318 $1,318 9.2% 5.9% % Growth 9% - 9% 6% 4% 4% Adj. EBITDA (Unburdened by SBC) $235 $117 $255 $270 $277 $285 $285 7.3% 5.0% % Margin 24% 22% 22% 22% 22% 22% 22% Less: Stock-Based Compensation (10) (4) (10) (12) (12) (12) (12) Less: Depreciation & Amortization (74) (36) (70) (62) (59) (56) (28) EBIT $152 $77 $175 $196 $206 $217 $245 3.8% 9.4% Less: Taxes (@ 26.0%) (20) (45) (51) (54) (56) (64) Unlevered Net Income $57 $129 $145 $152 $161 $181 % Growth - 15% 12% 5% 5% 13% Plus: Depreciation & Amortization $36 $70 $62 $59 $56 $28 Memo: Additions to Property, Equipment & Software (12) (25) (26) (27) (28) (28) Memo: Acquisitions of Assets & Other Investing Activities - - - - - - Less: Capital Expenditures (12) (25) (26) (27) (28) (28) Less: Change in Working Capital 16 (3) (2) (1) (1) (1) Less: Acquisitions of Businesses (12) - - - - - Less: Payment of Contingent Consideration (21) (21) (5) - - - Unlevered Free Cash Flow $65 $151 $174 $183 $187 $180 Cumulative Unlevered Free Cash Flow $65 $216 $390 $573 $760 Implied EV Calculation Implied EV Calculation – Terminal LTM Adj. EBITDA Multiple Implied Share Price Sensitivity Analysis Implied Perpetuity Growth Rate Sensitivity Analysis Discounted Cash Flow Terminal LTM EBITDA Multiple 6.0x 6.5x 7.0x 7.5x 10.5% $8.70 $9.76 $10.81 $11.86 12.3% $7.60 $8.58 $9.56 $10.55 14.0% $6.58 $7.50 $8.41 $9.33 Discount Rate Discounted Cash Flow Analysis Company Forecasts, Excluding NOL Impact Source: Company Forecasts per Company Management. Note: Does not include impact of NOLs. Based on fully diluted shares outstanding per Company Management. 1. Terminal year represents 2030 figures and normalized capital expenditures and depreciation & amortization expense. 2. Assumes 6.75x terminal LTM multiple. 3. Assumes 12.25% discount rate. (1) Terminal LTM EBITDA Multiple 6.0x 6.5x 7.0x 7.5x 10.5% (0.5%) 0.3% 0.9% 1.5% 12.3% 1.0% 1.8% 2.5% 3.1% 14.0% 2.5% 3.3% 4.0% 4.6% Discount Rate (2,3) (3) 12 NPV of Terminal Value $1,144 (+) Sum of Present Value of FCF 583 Enterprise Value $1,727 (-) Debt (1,064) (-) Minority Interest (5) (+) Cash 135 Equity Value $793 Fully Diluted Shares Outstanding 87 Implied Share Price $9.07
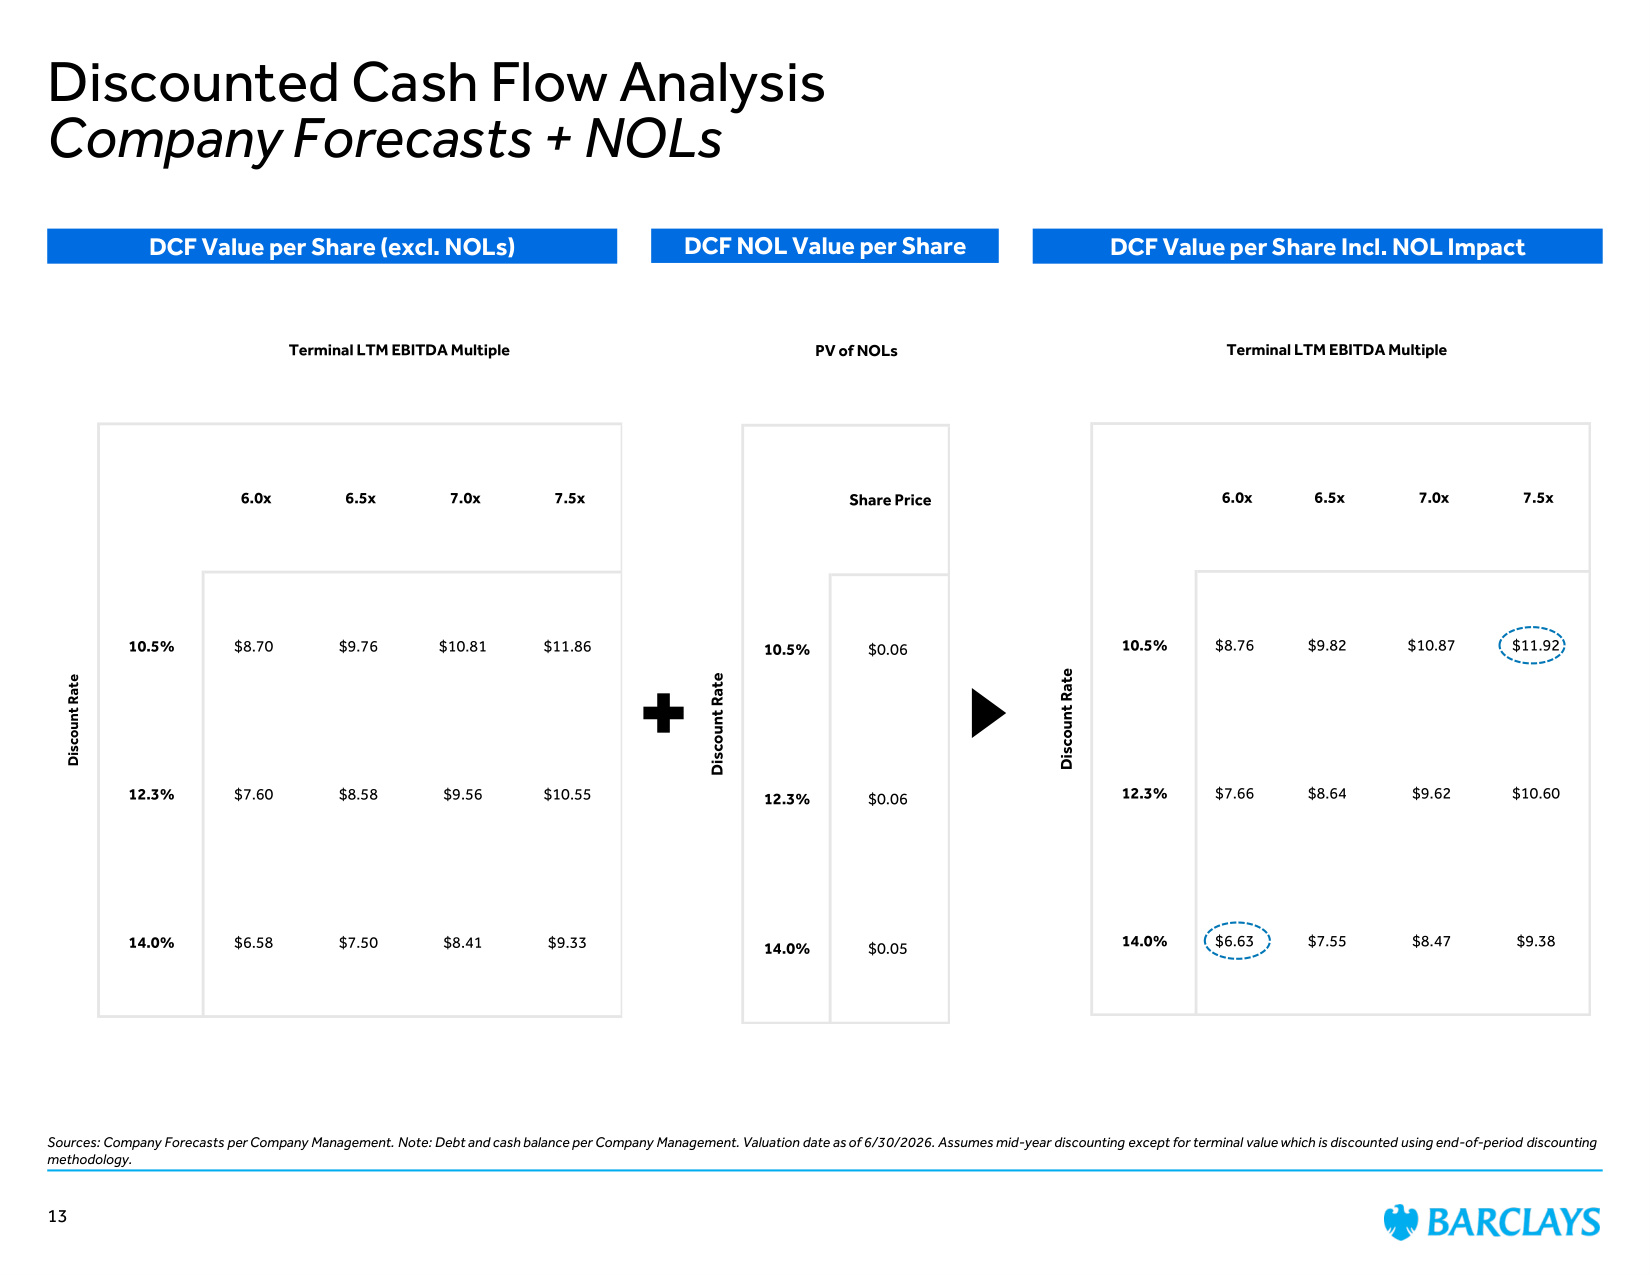
Terminal LTM EBITDA Multiple 6.0x 6.5x 7.0x 7.5x 10.5% $8.76 $9.82 $10.87 $11.92 12.3% $7.66 $8.64 $9.62 $10.60 14.0% $6.63 $7.55 $8.47 $9.38 Discount Rate Discounted Cash Flow Analysis Company Forecasts + NOLs Sources: Company Forecasts per Company Management. Note: Debt and cash balance per Company Management. Valuation date as of 6/30/2026. Assumes mid-year discounting except for terminal value which is discounted using end-of-period discounting methodology. DCF Value per Share (excl. NOLs) DCF NOL Value per Share DCF Value per Share Incl. NOL Impact Terminal LTM EBITDA Multiple 6.0x 6.5x 7.0x 7.5x 10.5% $8.70 $9.76 $10.81 $11.86 12.3% $7.60 $8.58 $9.56 $10.55 14.0% $6.58 $7.50 $8.41 $9.33 Discount Rate PV of NOLs Share Price 10.5% $0.06 12.3% $0.06 14.0% $0.05 Discount Rate 13
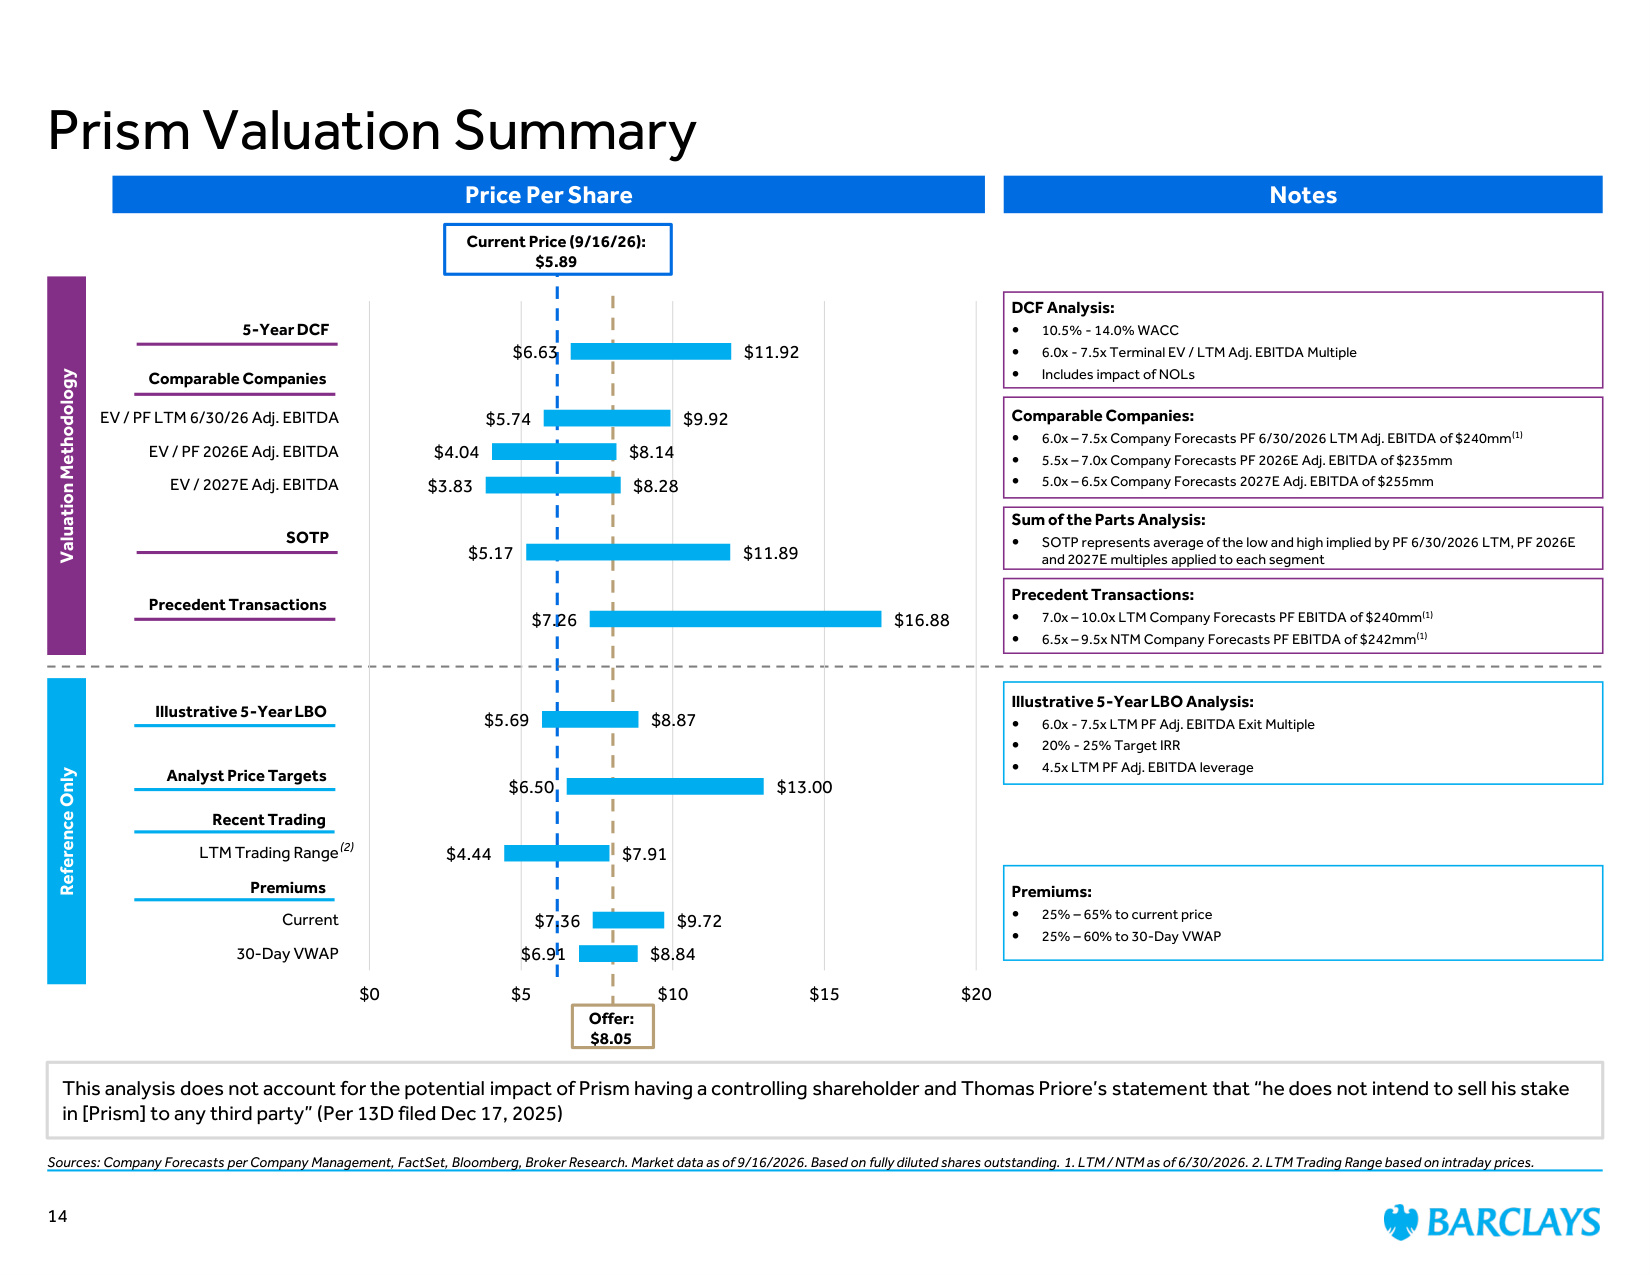
Price Per Share Notes Comparable Companies: 6.0x – 7.5x Company Forecasts PF 6/30/2026 LTM Adj. EBITDA of $240mm(1) 5.5x – 7.0x Company Forecasts PF 2026E Adj. EBITDA of $235mm 5.0x – 6.5x Company Forecasts 2027E Adj. EBITDA of $255mm Premiums: 25% – 65% to current price 25% – 60% to 30-Day VWAP Precedent Transactions: 7.0x – 10.0x LTM Company Forecasts PF EBITDA of $240mm(1) 6.5x – 9.5x NTM Company Forecasts PF EBITDA of $242mm(1) Valuation Methodology Reference Only Prism Valuation Summary DCF Analysis: 10.5% - 14.0% WACC 6.0x - 7.5x Terminal EV / LTM Adj. EBITDA Multiple Includes impact of NOLs Premiums Recent Trading Precedent Transactions Comparable Companies Sources: Company Forecasts per Company Management, FactSet, Bloomberg, Broker Research. Market data as of 9/16/2026. Based on fully diluted shares outstanding. 1. LTM / NTM as of 6/30/2026. 2. LTM Trading Range based on intraday prices. Illustrative 5-Year LBO Analysis: 6.0x - 7.5x LTM PF Adj. EBITDA Exit Multiple 20% - 25% Target IRR 4.5x LTM PF Adj. EBITDA leverage Illustrative 5-Year LBO Current Price (9/16/26): $5.89 5-Year DCF Analyst Price Targets $6.63 $5.74 $4.04 $3.83 $5.17 $7.26 $5.69 $6.50 $4.44 $7.36 $6.91 $11.92 $9.92 $8.14 $8.28 $11.89 $16.88 $8.87 $13.00 $7.91 $9.72 $8.84 $0 $5 $10 $15 $20 EV / PF LTM 6/30/26 Adj. EBITDA EV / PF 2026E Adj. EBITDA EV / 2027E Adj. EBITDA LTM Trading Range Current 30-Day VWAP This analysis does not account for the potential impact of Prism having a controlling shareholder and Thomas Priore's statement that "he does not intend to sell his stake in [Prism] to any third party" (Per 13D filed Dec 17, 2025) SOTP Sum of the Parts Analysis: SOTP represents average of the low and high implied by PF 6/30/2026 LTM, PF 2026E and 2027E multiples applied to each segment Offer: $8.05 14 (2)
Appendix
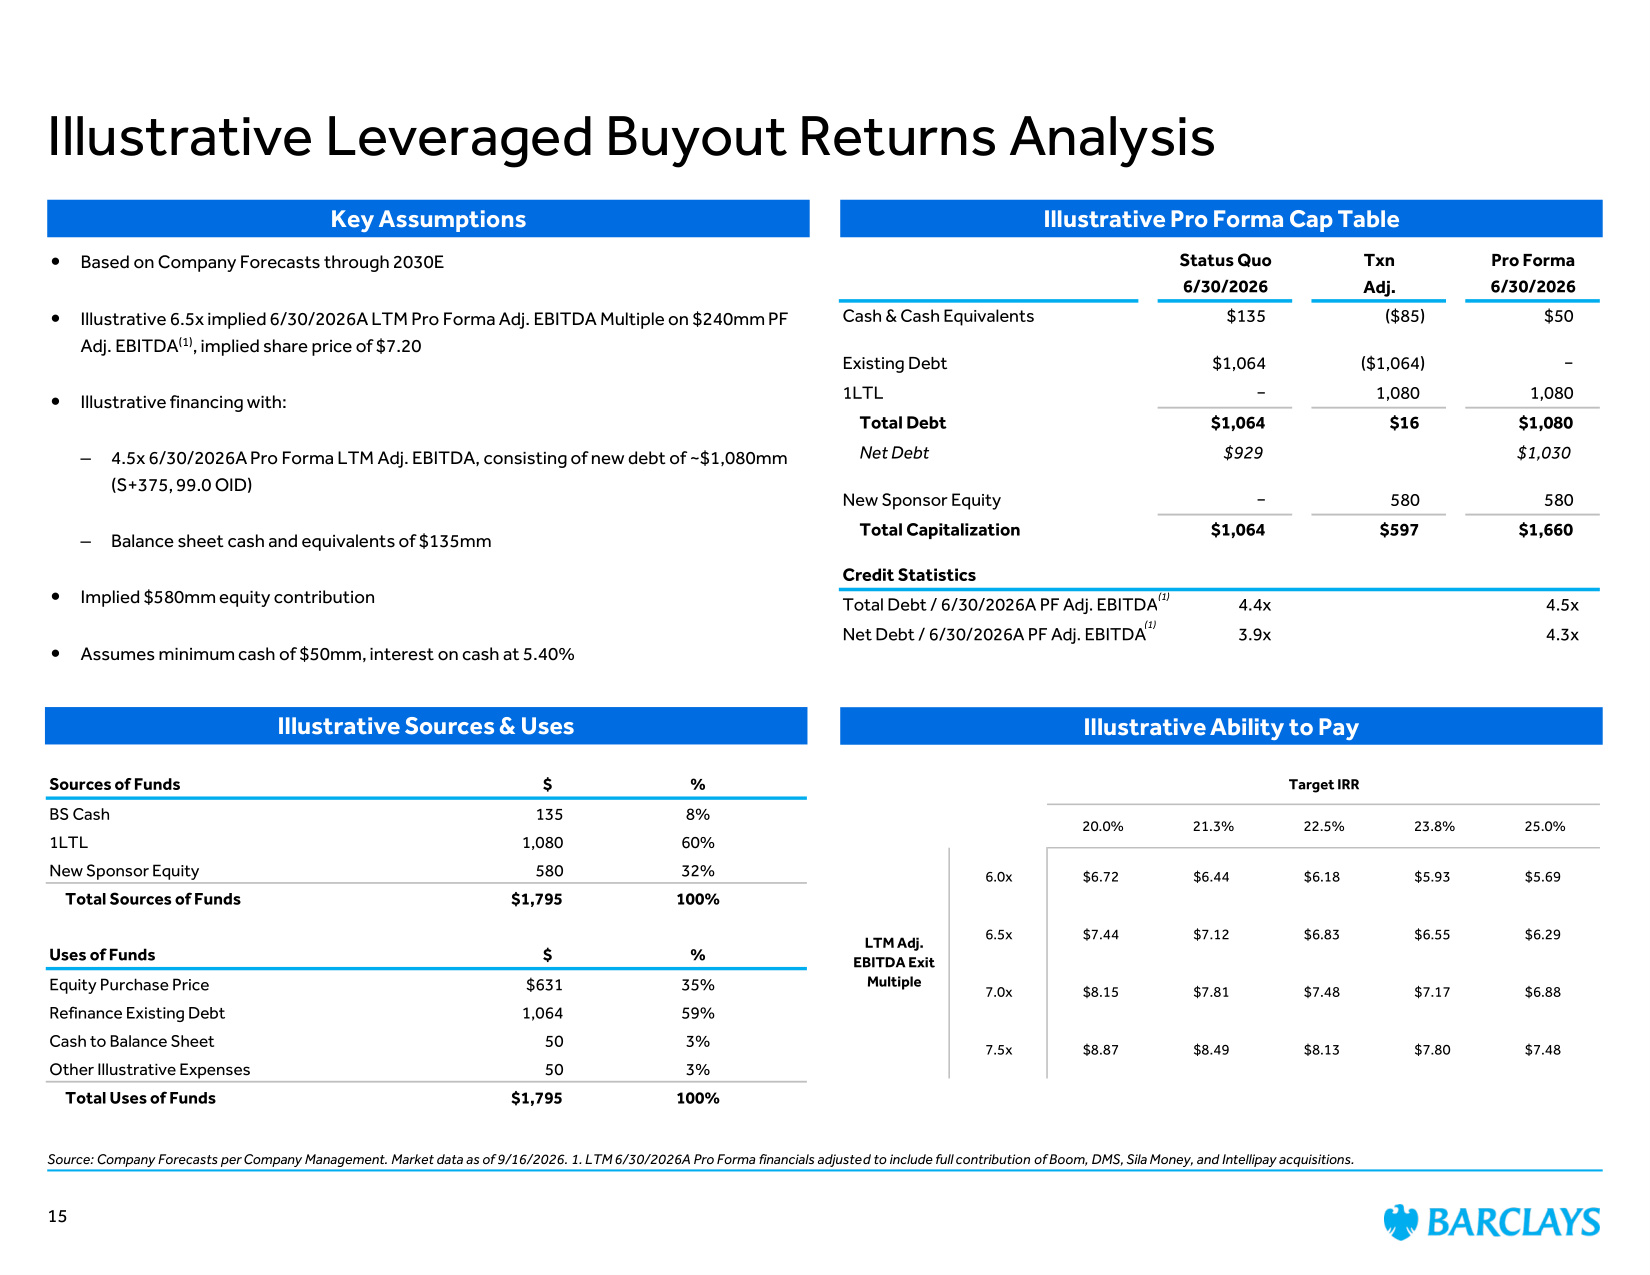
Illustrative Pro Forma Cap Table Illustrative Ability to Pay Key Assumptions Sources of Funds $ % BS Cash 135 8% 1LTL 1,080 60% New Sponsor Equity 580 32% Total Sources of Funds $1,795 100% Uses of Funds $ % Equity Purchase Price $631 35% Refinance Existing Debt 1,064 59% Cash to Balance Sheet 50 3% Other Illustrative Expenses 50 3% Total Uses of Funds $1,795 100% Status Quo Txn Pro Forma 6/30/2026 Adj. 6/30/2026 Cash & Cash Equivalents $135 ($85) $50 Existing Debt $1,064 ($1,064) − 1LTL − 1,080 1,080 Total Debt $1,064 $16 $1,080 Net Debt $929 $1,030 New Sponsor Equity − 580 580 Total Capitalization $1,064 $597 $1,660 Credit Statistics Total Debt / 6/30/2026A PF Adj. EBITDA 4.4x 4.5x Net Debt / 6/30/2026A PF Adj. EBITDA 3.9x 4.3x Target IRR 20.0% 21.3% 22.5% 23.8% 25.0% 6.0x $6.72 $6.44 $6.18 $5.93 $5.69 6.5x $7.44 $7.12 $6.83 $6.55 $6.29 7.0x $8.15 $7.81 $7.48 $7.17 $6.88 7.5x $8.87 $8.49 $8.13 $7.80 $7.48 LTM Adj. EBITDA Exit Multiple Illustrative Sources & Uses Based on Company Forecasts through 2030E Illustrative 6.5x implied 6/30/2026A LTM Pro Forma Adj. EBITDA Multiple on $240mm PF Adj. EBITDA(1), implied share price of $7.20 Illustrative financing with: – 4.5x 6/30/2026A Pro Forma LTM Adj. EBITDA, consisting of new debt of ~$1,080mm (S+375, 99.0 OID) – Balance sheet cash and equivalents of $135mm Implied $580mm equity contribution Assumes minimum cash of $50mm, interest on cash at 5.40% Illustrative Leveraged Buyout Returns Analysis Source: Company Forecasts per Company Management. Market data as of 9/16/2026. 1. LTM 6/30/2026A Pro Forma financials adjusted to include full contribution of Boom, DMS, Sila Money, and Intellipay acquisitions. (1) (1) 15
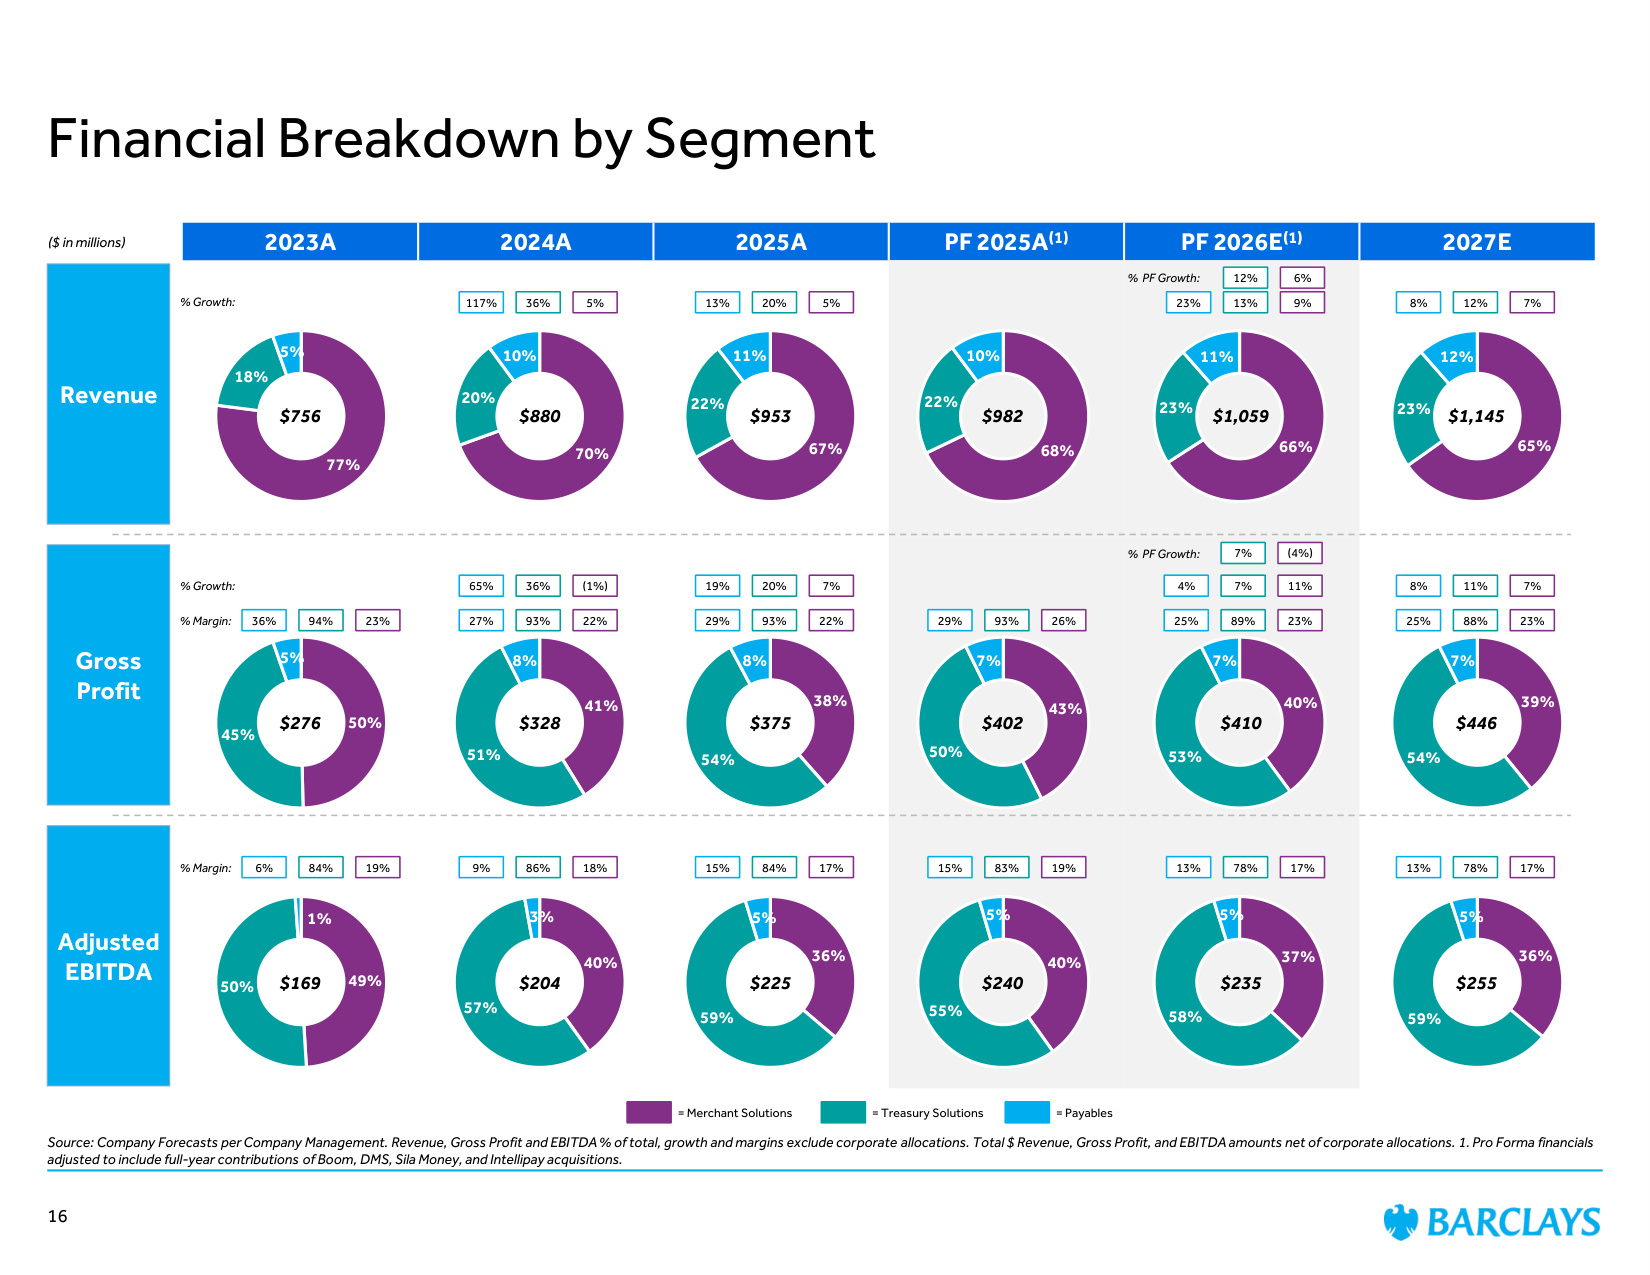
2023A 2024A 2025A PF 2025A(1) PF 2026E(1) 2027E Source: Company Forecasts per Company Management. Revenue, Gross Profit and EBITDA % of total, growth and margins exclude corporate allocations. Total $ Revenue, Gross Profit, and EBITDA amounts net of corporate allocations. 1. Pro Forma financials adjusted to include full-year contributions of Boom, DMS, Sila Money, and Intellipay acquisitions. Financial Breakdown by Segment Revenue ($ in millions) Adjusted EBITDA 16 Gross Profit 77% 18% 5% 70% 20% 10% 67% 22% 11% 68% 22% 10% 66% 23% 11% 50% 45% 5% 41% 51% 8% 38% 54% 8% 43% 50% 7% 40% 53% 7% 49% 50% 1% 40% 57% 3% 36% 59% 5% 40% 55% 5% 37% 58% 5% % Margin: % Margin: % Growth: 5% 117% 36% 5% 13% 20% 9% 23% 13% 22% 27% 93% 22% 29% 93% 26% 29% 93% 23% 25% 88% 18% 9% 86% 17% 15% 84% 19% 15% 83% 17% 13% 78% 23% 36% 94% 19% 6% 84% $953 $982 $1,059 $756 $880 $375 $402 $410 $276 $328 $225 $240 $235 $169 $204 = Merchant Solutions = Payables = Treasury Solutions % Growth: (1%) 65% 36% 7% 19% 20% 7% 8% 11% 23% 25% 89% 11% 4% 7% 36% 59% 5% $1,145 $446 $255 17% 13% 78% 6% 12% % PF Growth: (4%) 7% % PF Growth: 8% 12% 39% 54% 7% 7% 65% 23% 12%
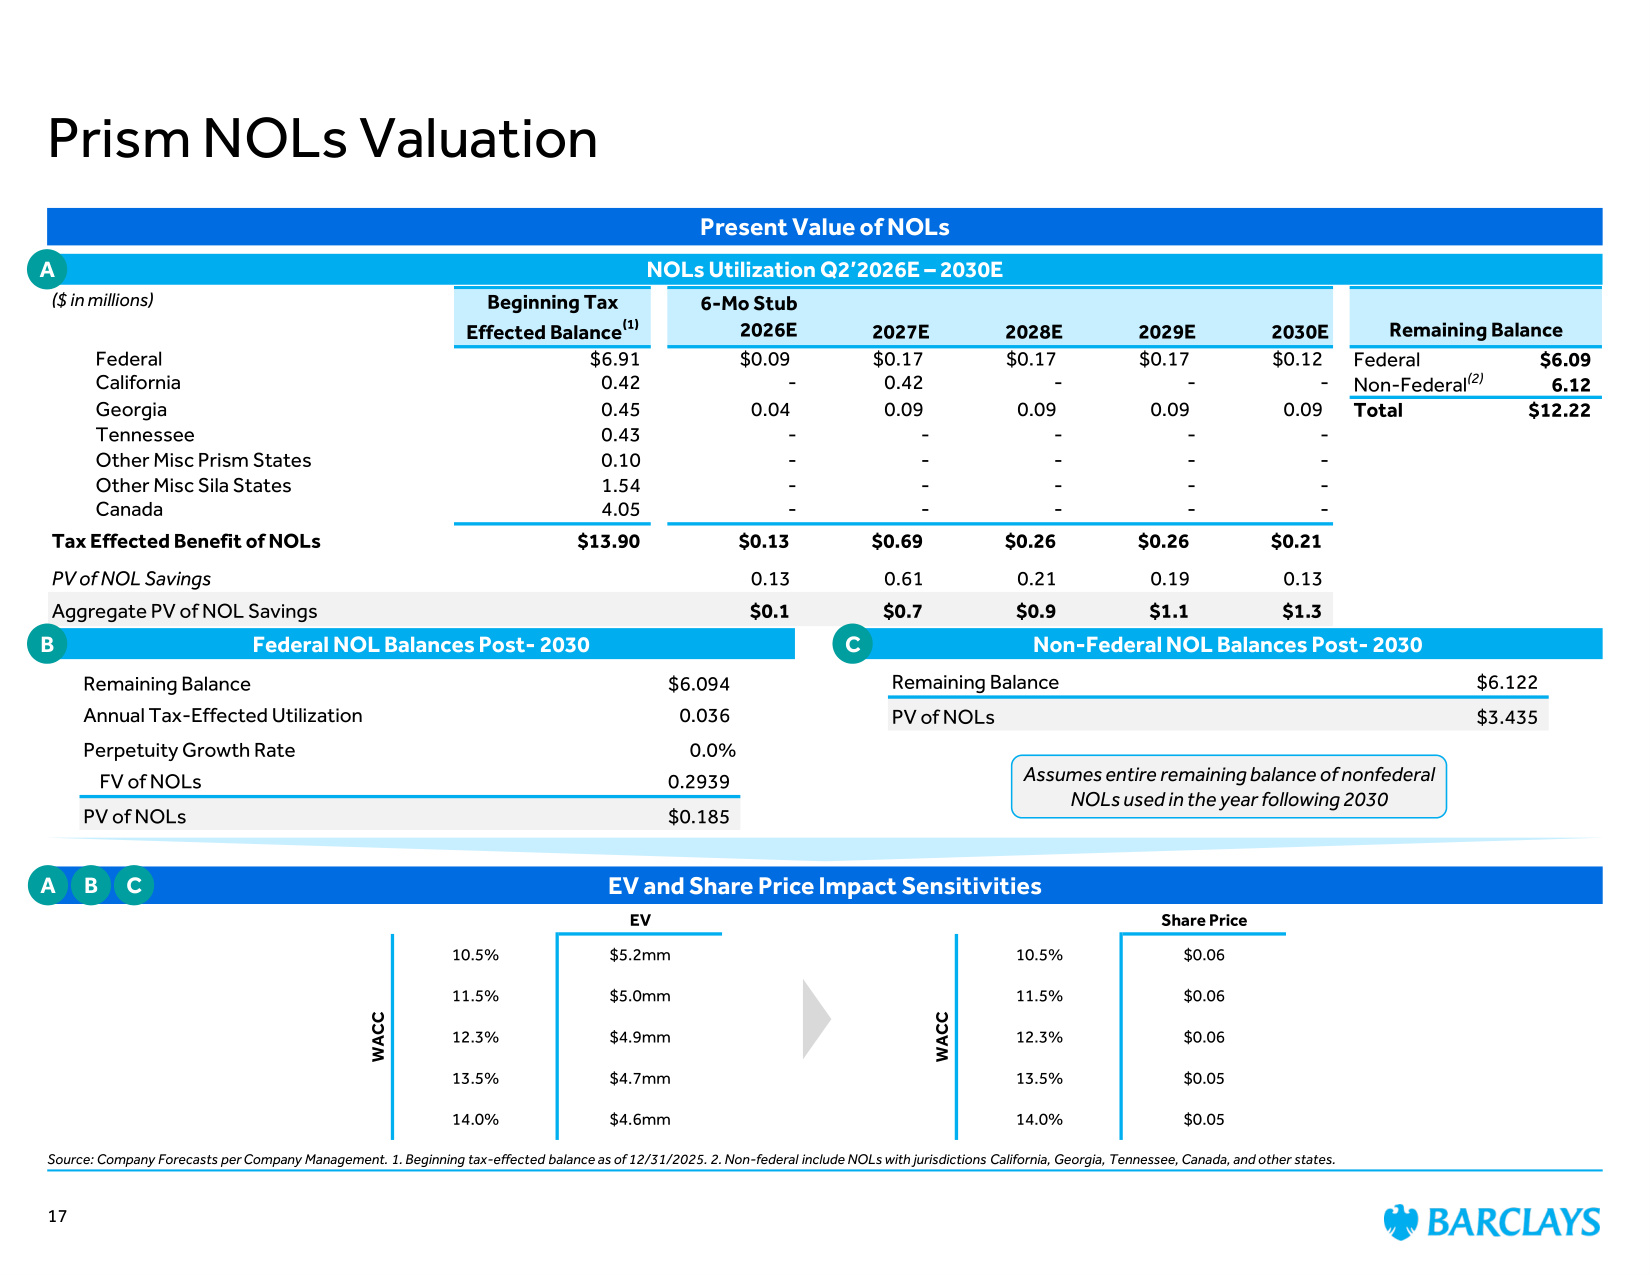
Present Value of NOLs ($ in millions) Beginning Tax Effected Balance(1) 6-Mo Stub 2026E 2027E 2028E 2029E 2030E Remaining Balance Federal $6.91 $0.09 $0.17 $0.17 $0.17 $0.12 Federal $6.09 California 0.42 - 0.42 - - - Non-Federal 6.12 Georgia 0.45 0.04 0.09 0.09 0.09 0.09 Total $12.22 Tennessee 0.43 - - - - - Other Misc Prism States 0.10 - - - - - Other Misc Sila States 1.54 - - - - - Canada 4.05 - - - - - Tax Effected Benefit of NOLs $13.90 $0.13 $0.69 $0.26 $0.26 $0.21 PV of NOL Savings 0.13 0.61 0.21 0.19 0.13 Aggregate PV of NOL Savings $0.1 $0.7 $0.9 $1.1 $1.3 EV and Share Price Impact Sensitivities Prism NOLs Valuation Source: Company Forecasts per Company Management. 1. Beginning tax-effected balance as of 12/31/2025. 2. Non-federal include NOLs with jurisdictions California, Georgia, Tennessee, Canada, and other states. Remaining Balance $6.094 Annual Tax-Effected Utilization 0.036 Perpetuity Growth Rate 0.0% FV of NOLs 0.2939 PV of NOLs $0.185 NOLs Utilization Q2'2026E – 2030E Federal NOL Balances Post- 2030 Non-Federal NOL Balances Post- 2030 Remaining Balance $6.122 PV of NOLs $3.435 EV Share Price 10.5% $5.2mm 10.5% $0.06 11.5% $5.0mm 11.5% $0.06 12.3% $4.9mm 12.3% $0.06 13.5% $4.7mm 13.5% $0.05 14.0% $4.6mm 14.0% $0.05 WACC WACC Assumes entire remaining balance of nonfederal NOLs used in the year following 2030 A B C A B C (2) 17
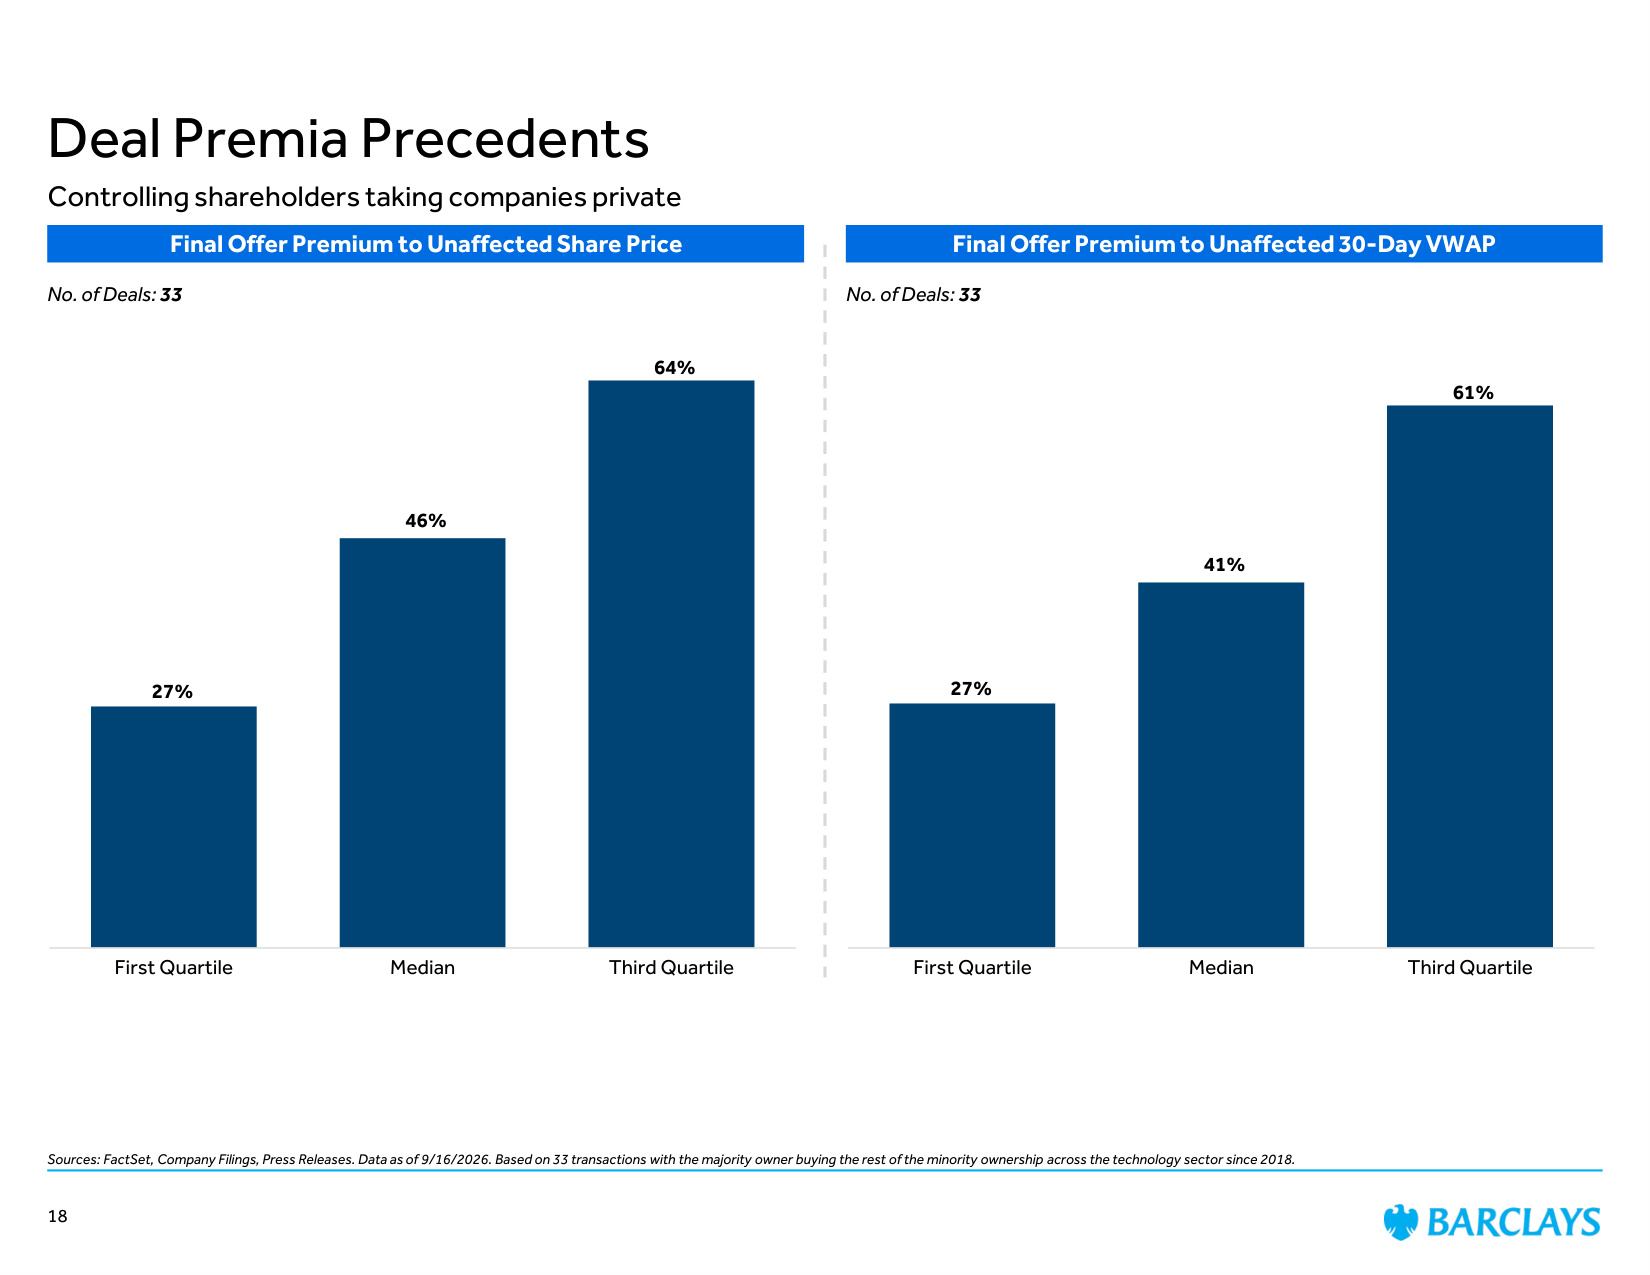
Sources: FactSet, Company Filings, Press Releases. Data as of 9/16/2026. Based on 33 transactions with the majority owner buying the rest of the minority ownership across the technology sector since 2018. Controlling shareholders taking companies private 18 Deal Premia Precedents 27% 46% 64% First Quartile Median Third Quartile Final Offer Premium to Unaffected Share Price No. of Deals: 33 Final Offer Premium to Unaffected 30-Day VWAP 27% 41% 61% First Quartile Median Third Quartile No. of Deals: 33
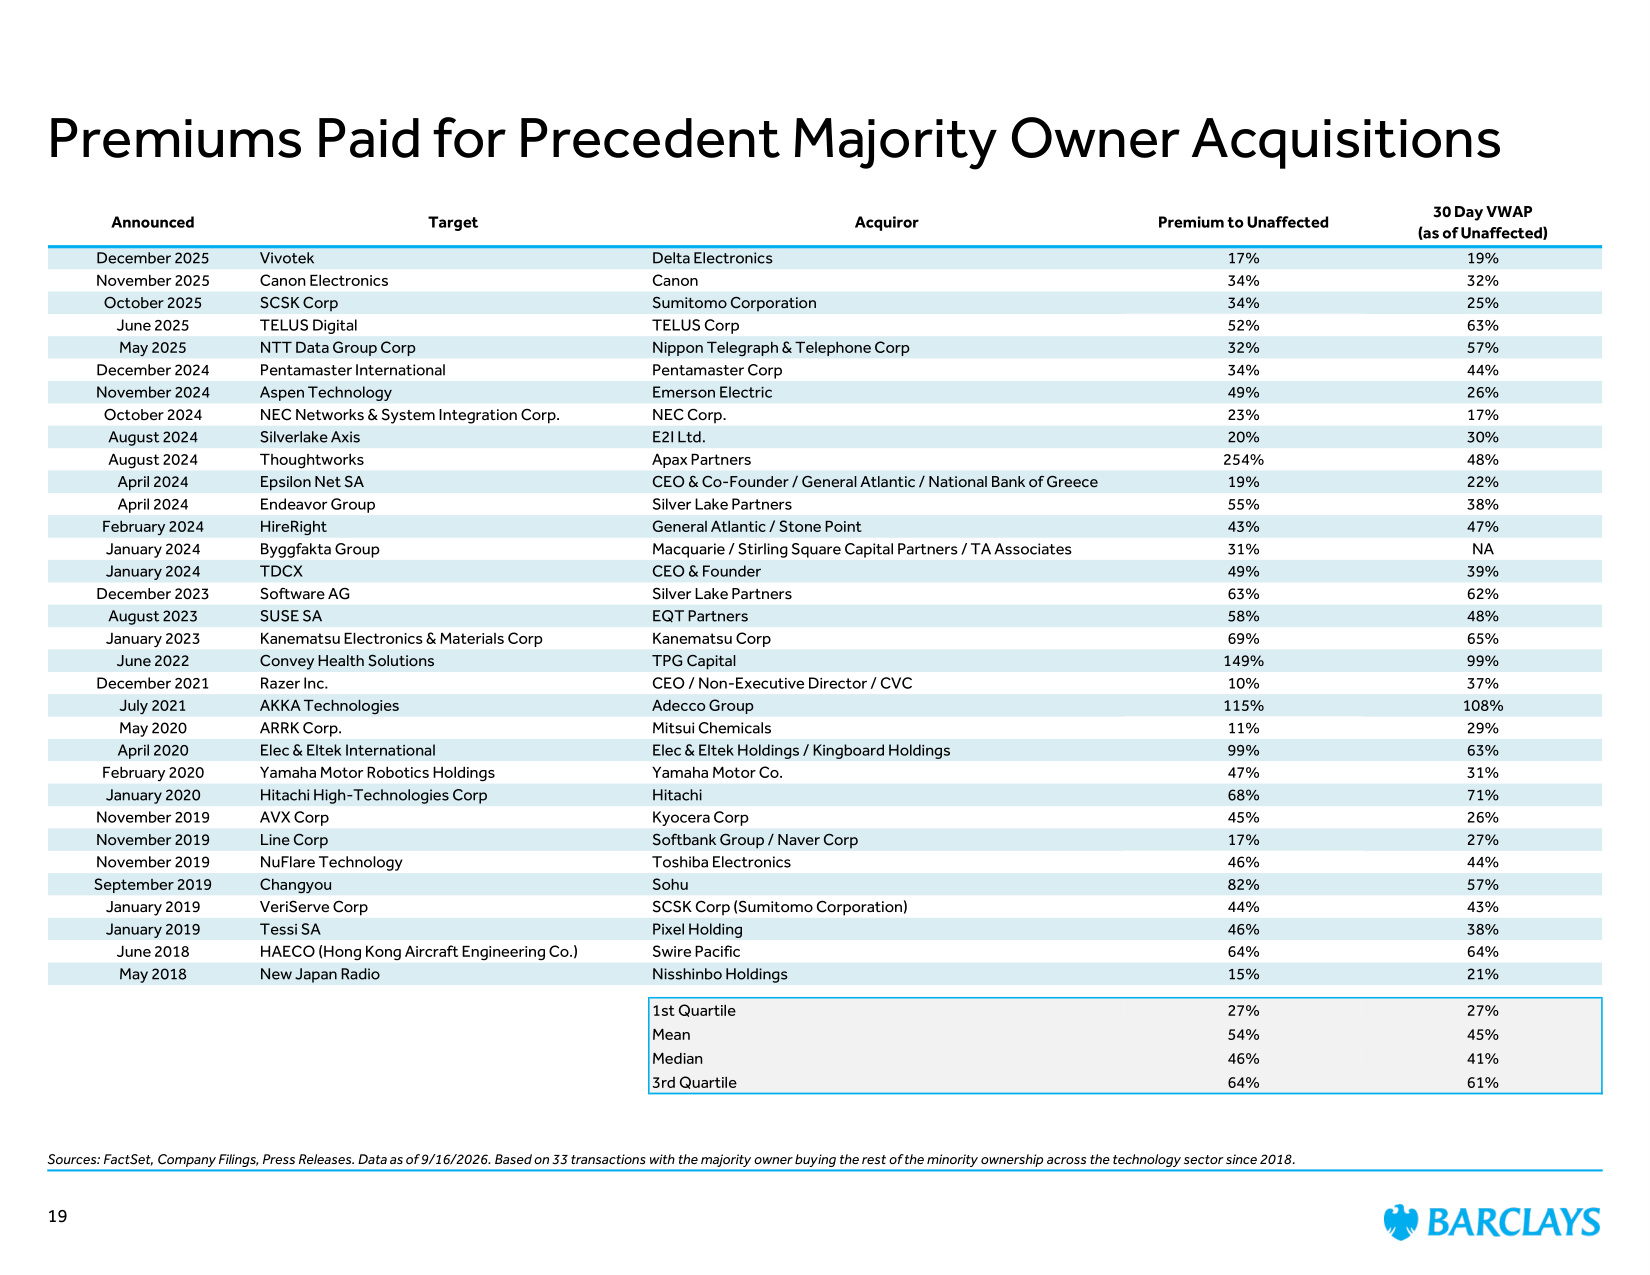
Sources: FactSet, Company Filings, Press Releases. Data as of 9/16/2026. Based on 33 transactions with the majority owner buying the rest of the minority ownership across the technology sector since 2018. Premiums Paid for Precedent Majority Owner Acquisitions 19 Announced Target Acquiror Premium to Unaffected 30 Day VWAP (as of Unaffected) December 2025 Vivotek Delta Electronics 17% 19% November 2025 Canon Electronics Canon 34% 32% October 2025 SCSK Corp Sumitomo Corporation 34% 25% June 2025 TELUS Digital TELUS Corp 52% 63% May 2025 NTT Data Group Corp Nippon Telegraph & Telephone Corp 32% 57% December 2024 Pentamaster International Pentamaster Corp 34% 44% November 2024 Aspen Technology Emerson Electric 49% 26% October 2024 NEC Networks & System Integration Corp. NEC Corp. 23% 17% August 2024 Silverlake Axis E2I Ltd. 20% 30% August 2024 Thoughtworks Apax Partners 254% 48% April 2024 Epsilon Net SA CEO & Co-Founder / General Atlantic / National Bank of Greece 19% 22% April 2024 Endeavor Group Silver Lake Partners 55% 38% February 2024 HireRight General Atlantic / Stone Point 43% 47% January 2024 Byggfakta Group Macquarie / Stirling Square Capital Partners / TA Associates 31% NA January 2024 TDCX CEO & Founder 49% 39% December 2023 Software AG Silver Lake Partners 63% 62% August 2023 SUSE SA EQT Partners 58% 48% January 2023 Kanematsu Electronics & Materials Corp Kanematsu Corp 69% 65% June 2022 Convey Health Solutions TPG Capital 149% 99% December 2021 Razer Inc. CEO / Non-Executive Director / CVC 10% 37% July 2021 AKKA Technologies Adecco Group 115% 108% May 2020 ARRK Corp. Mitsui Chemicals 11% 29% April 2020 Elec & Eltek International Elec & Eltek Holdings / Kingboard Holdings 99% 63% February 2020 Yamaha Motor Robotics Holdings Yamaha Motor Co. 47% 31% January 2020 Hitachi High-Technologies Corp Hitachi 68% 71% November 2019 AVX Corp Kyocera Corp 45% 26% November 2019 Line Corp Softbank Group / Naver Corp 17% 27% November 2019 NuFlare Technology Toshiba Electronics 46% 44% September 2019 Changyou Sohu 82% 57% January 2019 VeriServe Corp SCSK Corp (Sumitomo Corporation) 44% 43% January 2019 Tessi SA Pixel Holding 46% 38% June 2018 HAECO (Hong Kong Aircraft Engineering Co.) Swire Pacific 64% 64% May 2018 New Japan Radio Nisshinbo Holdings 15% 21% 1st Quartile 27% 27% Mean 54% 45% Median 46% 41% 3rd Quartile 64% 61%
The following pages contain material that was provided to the Board of Directors (the "Board") of Prism (the "Company") by Barclays Capital Inc. ("Barclays"). The accompanying material and any Barclays presentation related to the material was compiled or prepared on a confidential basis solely for consideration by the Board and no part of it may be reproduced, distributed or transmitted without the prior written consent of Barclays. The information contained in this material was obtained from the Company and/or publicly available sources, and Barclays has relied upon such information without independent verification thereof and does not assume any liability for any such information. These materials are being provided in connection with an actual corporate engagement and may not be used or relied upon for any purpose other than as specifically contemplated by a written agreement with Barclays. Moreover, any information provided herein was not prepared for or intended for use by any individual for personal, family or household purposes. Any estimates, historical financial information, projections and other information contained herein have been prepared by management of the Company or were obtained from publicly available sources (approved for Barclays' use by the Company) or are based upon such estimates and projections. With respect to such estimates and projections, Barclays has assumed that they have been reasonably prepared on a basis reflecting the best currently available estimates, projections and judgment of the management of the Company. The projections contained herein may or may not be achieved and differences between projected results and those actually achieved may be material. No representation or warranty, expressed or implied, is made as to the accuracy or completeness of such information and nothing contained herein is, or shall be relied upon as, a promise or representation, whether as to the past or the future. The analysis contained herein is based on current market conditions which are subject to change and Barclays assumes no obligation to update or otherwise revise these materials. Nothing in these materials shall be deemed to constitute a recommendation or investment, legal, tax, financial, accounting or other advice. Because these materials were prepared for use in the context of a presentation to the Board, these materials are incomplete without reference to, and should be assessed solely in conjunction with, the oral briefing provided by Barclays to the Board (in their capacity as directors and not in any individual capacity and is not for the benefit of any individual, including any individual officer, director, shareholder or any other person). These materials were not prepared for or intended for use by any individual for personal, family or household purposes nor were they prepared to comply with the disclosure standards under state and federal securities laws or any other applicable laws and, to the extent the material may be considered by readers not as familiar with the business and affairs of the Company as the Board, none of the Company, Barclays, their respective affiliates or any of their respective legal or financial advisors or accountants takes any responsibility for the accuracy or completeness of any of the material if used by persons other than the Board. These materials are not intended to provide the sole basis for evaluation of the proposed corporate transaction and do not purport to contain all information that may be required and should not be considered a recommendation with respect to the proposed corporate transaction. Barclays has not made or obtained any evaluations or appraisals of the assets or liabilities of the Company or any other party to any corporate transaction or any of their respective affiliates and has no obligation to evaluate the solvency of the Company or any other party to any transaction under any state or federal laws relating to bankruptcy, insolvency or similar matters. The analyses contained herein do not purport to be appraisals nor do they necessarily reflect the prices at which businesses or securities actually may be sold or purchased. Barclays' role in any due diligence review is limited solely to performing such a review as it shall deem necessary to support its own advice and analysis and shall not be on behalf of the Company, the Board or any individual officer, director, shareholder or any other person. Barclays, its subsidiaries and affiliates engage in a wide range of businesses from investment and commercial banking, lending, asset management and other financial and non-financial services. In the ordinary course of its business, Barclays and its affiliates may actively trade and effect transactions in the equity, debt and/or other securities (and any derivatives thereof) and financial instruments (including loans and other obligations) of the Company for its own account and for the accounts of its customers and, accordingly, may at any time hold long or short positions and investments in such securities and financial instruments or in other financial products and instruments. Unless otherwise expressly agreed or provided for in other applicable Barclays disclosures governing such corporate transactions or required by law or regulation, Barclays conducts these activities as principal and executes its principal transactions as an arm's length counterparty. Barclays does not act as a fiduciary in relation to these corporate transactions. These materials do not constitute investment advice nor do they form part of an offer to sell or purchase, or the solicitation of an offer to sell or purchase, any securities or any of the businesses or assets described herein or an offer of financing or an offer or recommendation to enter into any corporate transaction described herein. Barclays Capital Inc. is the United States investment bank of Barclays Bank PLC. Barclays Bank PLC is authorised by the Prudential Regulation Authority and regulated by the Financial Conduct Authority and the Prudential Regulation Authority (Financial Services Register No. 122702). Registered in England. Registered No. 1026167. Registered office: 1 Churchill Place, London E14 5HP. Neither Barclays Bank PLC, New York Branch nor Barclays Bank Delaware is responsible for the obligations of its affiliates. Copyright Barclays Bank PLC, 2026 (all rights reserved). Disclaimer 20
|
Calculation of Filing Fee Tables |
|
Table 1: Transaction Valuation |
|---|
|
Transaction Valuation |
Fee Rate |
Amount of Filing Fee |
||
|---|---|---|---|---|
|
|
1 |
$
|
|
$
|
| Fees Previously Paid | ||||
|
Total Transaction Valuation: |
$
|
|||
|
Total Fees Due for Filing: |
$
|
|||
|
Total Fees Previously Paid: |
$
|
|||
|
Total Fee Offsets: |
$
|
|||
|
Net Fee Due: |
$
|
|
Offering Note |
|
1 |
|
||||||
|
|
|||||||
| Table 2: Fee Offset Claims and Sources |
|---|
| Registrant or Filer Name | Form or Filing Type | File Number | Initial Filing Date | Filing Date | Fee Offset Claimed | Fee Paid with Fee Offset Source | ||
|---|---|---|---|---|---|---|---|---|
|
|
|
|
$
|
|||||
|
|
1 |
|
|
|
$
|
|
Offset Note |
|
1 |
|
||||||
|
|
|||||||